Journal of Experimental Psychology: Animal Behavior Processes 1996, Vol. 22, No, 2, 175-182
Copyright 1996 by the American Psychological Association, lnc, 0097-7403/96/$3.00
Averaging Temporal Duration and Spatial Position Ken Cheng University of Toronto
M a r c i a L. S p e t c h University of Alberta Paul M i c e l i University of Toronto
Pigeons and humans performed on a task in which spatial position and elapsed time redundantly signaled the availability of reward. On each training trial, a landmark moved steadily across a monitor screen. After a fixed amount of time and movement, reward was available for a response. On occasional unrewarded tests, the landmark moved at 0.50, 0.75, 1.00, 1.50, or 2.00 times the training speed. In both pigeons and humans, the central tendency in the response distribution on tests differed across speeds, when measured in terms of both elapsed time and landmark position. Pigeons and humans seem to average a duration of time and a spatial position to find a single criterion time-place corresponding to the expected time-place of reward.
In deciding when to engage in a task, an animal usually has a number of cues indicating the appropriate time for action. In doing a task at a particular time during the day, for example, the animal typically can rely on its internal circadian clock as well as external cues such as the position of the sun (see Gallistel, 1990, for a review). On a time scale shorter than the time during a day, the timing of events is also usually indicated by multiple cues. Consider, for example, a pet cat waiting for the arrival of food after hearing the electric can opener operating. The food will arrive approximately at a fixed time after the onset of the sound, so that its internal interval clock can be used to estimate food arrival. But other cues in the actions of the person feeding the cat also indicate the time of arrival of food. In deciding where to search for a desired object, multiple cues also indicate the location to search. For instance, different landmarks might be used to pinpoint the target location. Laboratory studies indicate that when multiple cues are available in the temporal and spatial domains, an animal will often average the dictates of different cues (Cheng, 1992). For example, in one spatial search task pigeons were looking for hidden food within a square arena covered with wood chips (Cheng, 1988). The goal was at a particular place within the arena, located in front of a piece of blue cardboard. When the cardboard was shifted on tests, the
birds searched most at a location in between the goal location as dictated by the cardboard and the goal location as dictated by the rest of the (unshifted) landmarks. Numerous other experiments with pigeons in search tasks, both on the laboratory floor (Cheng, 1989, 1994; Cheng & Sherry, 1992) and on the surface of a monitor (Spetch, Cheng, & Mondloch, 1992), corroborate this point. In interval timing, Cheng and Roberts (1991) tested pigeons on the peak procedure with multiple cues. In the peak procedure, two types of trials are given. On training trials, which constitute most of the trials, a signal indicates the start of a trial. After a fixed interval (FI) since signal onset, a response is rewarded. On occasional test trials, the signal comes on as usual, but it stays on for a long period and then is extinguished. No reward is given, no matter how the subject responds. On tests, the subject typically makes a burst of responding at a high rate, called a run, around the time of the FI when food is expected (Cheng & Westwood, t993; Cheng, Westwood, & Crystal, 1993; Church, Meck, & Gibbon, 1994; Gibbon & Church, 1990). When the distribution of responses in time since signal onset are pooled over many trials, a Gaussian shape is obtained with the peak (peak time) near the FI. Cheng and Roberts (1991) trained pigeons on a peak procedure with two separate signals associated with different FIs. On tests with both signals presented together, the birds peaked at a time in between the two FIs, indicating that they had averaged the dictates of the two signals. Cheng and Roberts (1989) found a similar instance of averaging in interval timing. Recently, Fetterman (1993) also found pigeons using both timing and counting in a single task, thus averaging temporal and numerical dictates. Counting, however, has been suggested to be a part of the timing system (Meck & Church, 1983). In this study we used a variant of the peak procedure, which we call the spatiotemporalpeak procedure, to determine whether pigeon and human participants averaged the dictates of two very different domains, namely time and space. The signal in the task consisted of a graphic object
Ken Cheng and Paul Miceli, Department of Psychology, University of Toronto, Toronto, Ontario, Canada; Marcia L. Spetch, Department of Psychology, University of Alberta, Edmonton, Alberta, Canada. This work was supported by grants from the Natural Sciences and Engineering Research Council of Canada. Correspondence concerning this article should be addressed to Ken Cheng, who is now at the School of Behavioural Sciences, Macquarie University, Sydney NSW 2109 Australia, or to Marcia L. Spetch, Department of Psychology, University of Alberta, Edmonton, Alberta, Canada T6G 2E9. Electronic mail may be sent via Internet to
[email protected] or to mspetch@ psych.ualberta,ca. 175
176
CHENG, SPETCH, AND MICELI
(white rectangle) that moved at a constant speed on a monitor. As a result, the availability of reward was given not only by an FI of time but also by the spatial position of the moving object. Specifically, on a trial the rectangle starts moving across the screen at 1 cm/s. Alter 10 s and 10 cm for some participants and 8 s and 8 cm for others, a response is rewarded. Participants can use either the passage of time or the position of the rectangle to recognize when reward is available. On occasional tests, the rectangle moves across the screen at a constant speed that is sometimes different from that used in training. Consider, for example, the case in which it moves at twice the speed (2 cm/s). A participant following solely the dictates of interval timing would show peak responding at about the same time as on control tests (i.e., for participants on FI 10 s, peak responding would occur around 10 s since signal onset). But a participant following solely the dictates of the spatial position of the rectangle would show peak responding much earlier, at approximately the time when the rectangle reaches its usual position where reward becomes available, in this case around 5 s. A participant averaging the dictates of space and time, however, would show peak responding at a point in between these two durations. And should a participant show such an intermediate peak time, this would suggest that the participant had somehow averaged the dictates of two separate systems, an interval-timing system and some system processing information on spatial positions. Such a compromise reveals something interesting about the brain. It indicates that different systems or modules within the brain dealing with fundamentally different aspects of the world, space and time, can be working in tandem on a task. It indicates that dictates couched in terms of spatial positions and dictates couched in terms of temporal durations must at some point be translated into a common code that can be averaged. We used pigeons on this task because they have been traditional subjects in experiments on timing and a large body of data exists about them. Human interval timing shares much with that of rats and pigeons (e.g., Wearden, 1991, 1995; Wearden & McShane, 1988). But the peak procedure has been used little with humans (Hinton, Gibbon, Rakitin, & Meck, 1993). In comparing humans with pigeons, we are not only testing the generality of the finding of interest but also attempting a version of the peak procedure with humans. With the touch-screen apparatus, human participants can be tested on the same task with but few modifications, making data gathering efficient.
Method
Participants The pigeons were 4 White Kings, each experienced at touchscreen tasks and at timing tasks. They were housed individually in large cages with free access to water and grit on a 14:10 light-dark cycle (lights on at 6:00 a.m.). They were maintained at approximately 85% of their free feeding weight by pellets received during
experimental sessions and mixed grain received after experimental sessions. The humans were undergraduate students who participated in the experiment for credit in their introductory psychology course. One man and 5 women, ranging from 18 to 23 years of age, were tested in Group FI 10. Three men and 7 women, ranging from 18 to 51 years of age, were tested in Group FI 8.
Apparatuses The birds were tested in two custom-built chambers (35 cm long × 30 cm wide X 45 cm high). The floor of the chambers (parallel bars) were raised 4 cm from the table on which the chamber stood. At one end was an opening large enough for the entire surface of the Zenith 1492 monitor with attached Carroll Touch 1492 Smart Frame (Carroll Touch, Little Rock, TX). The size of the monitor was 27 cm wide X 19 cm high. At the floor to the front, a stand, that was 5 cm wide x 6 cm high from the floor of the chamber, was constructed. On this stand was a hopper into which a Gerbrands feeder delivered pellets from the left side. The reward delivered was three 20-mg pigeon pellets (P. J. Noyes, Inc., Arlington, VA). A 7-watt light on the ceiling above the hopper lit up during food delivery until 4 s after the last pellet was delivered. Microcomputers, located in an adjacent room, controlled experimental contingencies and recorded peck coordinates and times. The humans were tested in a small, private room that contained a computer equipped with a touch-screen. The computer monitor (Zenith 1490) and touch-screen (Carroll Touch 1490 Smart Frame) provided the same search space and stimuli as used for pigeons. Participants sat in a chair in front of the monitor and searched by touching the screen with the eraser end of a pencil.
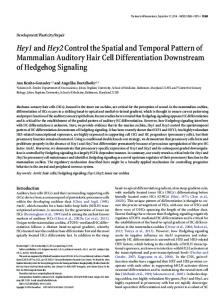
Procedure for Pigeons The birds were first autoshaped to peck at a warning stimulus for reward. The warning stimulus was a 2.0-cm red square with its center located 6.5 cm from the bottom and 12.5 cm from the left. During the experiment, all sessions were 100 trials long or a maximum of 1.5 hr. Intertrial intervals were 10 s throughout. The birds were first given one pretraining session. On each trial, the warning stimulus appeared. When it was pecked once, it disappeared and was replaced with the target stimulus. This was a green isosceles triangle, 2.0 cm across at the base and 2.0 cm high, with its center located 7.0 cm from the bottom and 12.5 cm from the left. Pecking at the target terminated the display and resulted in the delivery of reward. The effective area that was programmed for the warning and target stimulus was actually a 8.0 cm X 8.0 cm square, so that any peck near the stimulus would be registered. The birds were next given 12 training sessions. On each trial, the warning stimulus first appeared. A peck at it replaced it with the stimulus display (Figure 1). This consisted of the target stimulus and a moving white rectangle at the top left of the screen. The rectangle measured 1.2 cm wide and 2.0 cm high, and its center was 5.0 cm from the top. The rectangle moved to the right at a rate of 1 cm/s until a reward was earned or until it disappeared off the right edge. A reward was programmed for the first peck at the target (the stationary green triangle) after 10 s. Pecking at the moving rectangle had no consequences. During casual observations, no bird pecked regularly at this stimulus. The birds were next given five test sessions with control tests, in order to accustom them to unrewarded trials. Every block of four trials contained a test, but tests were not given on consecutive trials. On a control test, the warning stimulus first appeared as
177
AVERAGING TIME AND PLACE
1
MovingLandmark
A Target
Figure 1. The stimulus display as it appeared at the start of a trial, after the participant has touched the warning stimulus. The landmark at the top left moved from left to right while responses on the green triangle were registered. The exact locations of the target and landmark varied for the pigeons and two groups of humans.
usual. A peck at it replaced it with the stimulus display, as on training trials. The white rectangle moved to the right at the usual speed for 40 s, after which the test ended, with no reward delivered. The times of the pecks made by the bird were recorded. The birds were next given 30 test sessions with different tests. These sessions resembled the previous phase except that five different kinds of tests were given, five each in each session. The tests only differed in the speed at which the white rectangle moved across the screen. The speeds (cm/s) on tests were 0.50, 0.75, 1.00, 1.50, and 2.00. To ensure that behavior was asymptotic, Sessions 11-30 were used for data. The number of pecks in each 1-s bin after the appearance of the white rectangle was totaled for each bird in each test condition. From these distributions, a time of peak pecking (peak time) was calculated by the median iteration procedure used in many such studies (e.g., Cheng & Westwood, 1993; S. Roberts, 1981; W. A. Roberts, Cheng, & Cohen, 1989).
Procedure f o r Humans At the beginning of each session, participants were provided with the following information: Their task would be to try to earn points by touching the green triangle. A prize of I00 points would be available on some randomly selected trials. A cost of 1 point would be incurred for every touch. Participants were told to "try to figure out the conditions under which you can obtain the prize." No mention was made of spatial or temporal factors. The experimenter asked the participant to write down his or her age and sex on a piece of paper and then ran a demonstration program that presented one training trial. The experimenter showed the participant how to touch the screen with a pencil. Any procedural questions posed by the participant were answered with the statement, "I'm sorry, but I cannot reveal any other information about the procedure as it may influence the way you perform." After obtaining confirmation that the participant still wished to participate, the experimenter then started the program for the participant and left the room. The procedure on training and test trials paralleled those for pigeons. The participant's program began with three training trials. On each training trial, the warning stimulus, with a center 9 cm
from the bottom and 13 cm from the left, first came on. A touch at it produced the experimental display. In the display for the first 6 participants tested (Group FI 10), the center of the green triangle (target) was 9.5 cm from the bottom and 13.0 cm from the left, and the center of the white rectangle (moving landmark) was 3.0 cm from the top. The display for the last 10 participants tested (Group FI 8) was identical except that the target was 20.0 rather than 13.0 cm from the left. For participants in Group FI 10, reinforcement in the form of a 100-point prize was available for the first touch at the target 10 s after the beginning of the display, which was accompanied by a 10.0-cm advancement of the moving landmark toward the right. For participants in Group FI 8, the 100-point prize was available for the first touch at the target 8 s after the beginning of the display, which was accompanied by an 8.0-cm advancement of the moving landmark. In all other ways, the procedure was identical for the two groups. The reinforcement display indicated the 100-point prize, as well as the total points earned to date, the total points used to date, and the net total points earned to date. The display stayed on for 3 s, and then the warning stimulus for the next trial appeared. After the first 3 training trials, participants received two blocks of 3 trials in which each block contained one control test and 2 training trials. These two tests were not used for data. Then participants completed 3 blocks of 15 trials. In each block was one test of each type and 10 training trials. The same test types (five speeds) that were given to pigeons were given to humans (three of each type). All tests lasted for 40 s and terminated with a display that read, "No points earned on this trial," with information about the total points earned to date, total points used to date, and net points earned to date. The median time of response on each test type for each participant was used for data (i.e., peak time was the median response time). In reporting the results, the alpha level of significance was set at 0.05 throughout.
Results The average peak times for the birds and humans are shown in Figure 2, top panel. The same data are translated to peak places (i.e., the position of the moving landmark at peak time) and shown in the bottom panel of Figure 2. The data from 4 human participants in Group FI 8 condition were excluded because the peak times on the control tests exceeded twice the value of the FI. In all groups of participants for both time and space, the data appear linear. A best-fitting regression line (least-squares criterion) has been drawn through each set of data points. Statistical analyses, summarized in Table 1, confirm these impressions. In each data set for both time and space, a within-subjects analysis of variance on peak times and peak places reveals significant differences across conditions. Furthermore, a trend analysis with unequal intervals (Grandage, 1958) shows highly significant linear trends but no significant higher order trends. A linear regression line accounts for most of the variance, and errors around the regression line appear unsystematic, as testified by the lack of significant higher order trends. Thus, the data fall into the pattern of a straight line with a nonzero slope. In every case, peak times vary linearly with 1/speed, and peak places vary linearly with speed. Exclusive use of position in determining criterion would produce constant peak places across conditions, whereas exclusive use of time in determining criterion would produce constant peak times across condi-
178
CHENG, SPETCH, AND MICELI
•
PIGEONS
•
HUMANS F110
•
HUMANS FI 8
25 20 LU
15
v