“We’re All Connected”: Business Cycle Synchronization in G-7 Countries
Marc Tomljanovich* Colgate University Yung-Hsiang Ying** National Sun Yat-Sen University
November 2005 Abstract: The high degree of business cycle correlation across industrialized countries in the past quarter century has become a stylized fact; however, the reasons for this phenomenon remain unclear. We construct a model incorporating distinct types of global and domestic channels of shock transmissions that potentially affect output for a given country. Using quarterly data from 1980 to 2003 for the G-7 countries, our results show that both trade liberalization and financial market integration positively influence the synchronization of business cycle. Thus, for developed economies, government policies aimed at erecting trade barriers or capital controls have the potential to negatively impact business cycle correlations. Keywords: Business Cycle Correlation, Political Business Cycle JEL Codes: E32, F15, F43
*
Colgate University. Hamilton, NY 13346. Email:
[email protected] Corresponding Author. The Institute of Interdisciplinary Studies. The College of Social Science. National Sun Yat-Sen University. Kaohsiung, Taiwan 804. Email:
[email protected].
**
I.
Introduction How business cycles are correlated among countries has become a pressing matter
for policy makers, as the effects of other nations’ economic policies become more directly and contemporaneously felt due to improvements in informational and capital flows. The issue is particularly acute for countries considering tying their currencies to another currency. Certainly, incorporating a single currency within a common trade area eliminates the risk of exchange rate fluctuations, which enhances trade integration among its members.
However, adopting a single currency would be a
serious economic constraint if these countries have traditionally dampened country-specific shocks through macroeconomic stabilization tools (Frankel and Rose, 1998).
Therefore, the degree to which synchronization of business cycles
occurs across countries is a potentially important criterion when considering whether to join an optimum currency area (OCA). A substantial literature has accumulated in the effort to document the high degree of business cycle correlation across industrialized countries.
Although tremendous
efforts have been made in providing the stylized facts concerning the co-movement of international business cycles, the causes of this phenomenon are less well known. In an empirical study, Gerlach (1988) discovers output co-movement correlation across countries under both fixed and floating exchange rate regimes.1
Backus and Kehoe
(1992) use historical data for 10 industrialized countries and find evidence of, consistently high co-movement across countries.
Canova and Marrinan (1998)
emphasized the relation of highly correlated business cycles to different sources of
1
Gerlach (1988) also concludes that variations of monthly industrial production of OECD countries are more pronounced in floating exchange rate regimes than in fixed exchange rate regimes. The degree of variation is also linked to the openness of economies. Interestingly enough, small open economies tend to experience high level of industrial production variability, since specialization tends to be in relatively few sectors. On the other hand, richer and more diversified economies experience less variability.
1
shocks and transmission mechanisms.2
These studies all find a well-built
interdependence between industrialized countries. Another perspective on the high degree of output co-movement between industrialized countries derives from the assumption that similar economies are driven at least partially by common shocks.
Stockman (1988) and Costello (1993) focus on
seven European countries and G-6 countries, respectively, and their empirical results show that common shocks transmit across borders and influence the same industrial sectors across countries.
Gregory et al (1997) emphasize the importance of both
global and country-specific shocks. One way that economies may become linked stems from the political atmospheres within each country. Political economists have tried to provide valid theories on the relation between political parties and business cycles. There exist two major theories; the opportunistic theory has emphasized incumbent’s opportunistic behavior immediately before the election, while the partisan theory has focused on linking the political parties’ ideologies with policy goals. Nordhaus (1975) and Lindbeck (1976) pioneer the formation of opportunistic school theories.3
Hibbs (1977) finds
that left-wing parties in industrialized countries are more willing to bear the cost of inflation in order to decrease unemployment and increase growth of output. On the other hand, right-wing parties care more about the cost of inflation, thus, lower economic growth and high unemployment have been usually observed during their leadership spans.
Recently, Alesina (1987) proposes a model that incorporates
2
Stockman (1988) decomposes the growth of industrial production for two-digit manufacturing sectors into two components. The first is specific to industries that are common across nations, for example technological shocks. The second is specific to individual countries, in which the same industries are present; for example, national specific monetary or fiscal policies. Costello (1993) finds that output growth is more correlated across countries than productivity growth. 3 Nordhaus-Linderbeck’s political business cycle theory is categorized as a “traditional opportunistic” approach. It is assumed that incumbent politicians consistently launch expansionary monetary or fiscal policies right before an election to increase the probability of victory. Cukierman and Meltzer (1986), Rogoff and Sibert (1988), and Persson and Tabellini (1990) propose a “rational opportunistic” approach, which focuses primarily on politicians’ abilities and asymmetric information between voters and politicians. More detail is provided in the next section. (FRANK, we should do this, like the referee said. I’ll add it tomorrow)
2
rational expectations into a partisan model of macroeconomic policy. Alesina and Roubini (1999) and Heckelman (2002) both empirically show that rational partisan theory works quite well when empirically investigating the OECD and Canadian economies, respectively. At this point, a natural objective becomes identifying the manners in which different channels or transmission mechanisms propagate shocks originating in one country to the other.
These channels fall into three broad categories.
First, trade is
the most recognized channel through which shocks are transmitted across economies (See, inter alia, Canova and Dellas (1993), Frankel and Rose (1998), Otto et al. (2001), and Imbs (2004)). Economists also have reached a consensus that close bilateral trade between economies tends to accompany highly correlated business cycles. Second, the integration of financial markets arguably creates another distinct mechanism for the transmission of shocks.
However, the direction and magnitude
of its influence are still inconclusive (Bordo and Helbling, (2003)). On the one hand, foreign capital allows countries borrow necessary funds to either smooth domestic consumption during recession, or spur domestic investment without forcing an increase in domestic saving. If this effect dominates, the relation to synchronous business cycles correlation would be positive.
On the other hand, if investors have
imperfect information and tend to withdraw their funds suddenly, the tremendous capital reversal may result in decreasing business cycles correlations. Calvo and Mendoza (2000), Mendoza (2001) and Imbs (2004) all discuss this possibility. A third channel of shock transmission depends on a country’s choice of exchange rate regime.
Flood and Hodrick (1986) and Gerlach (1988) recognize that the
variability of output differs between fixed and flexible regimes. Baxter and Stockman (1989) show that the volatility of output in fixed exchange rate regimes is less than in floating exchange rate regimes. Artis and Zhang (1997) emphasize that 3
a successful fixed exchange rate regime likely leads to the synchronization of business cycles. Therefore, we explicitly include all of these channels that potentially influence business cycles in our study. This paper is mainly designed to empirically explore the business cycles of G-7 countries. We add to the existing literature in the following ways. First, we are more comprehensive than existing studies by explicitly exploring the aforementioned three distinct channels of business cycles transmission across countries.
Second, we
confirm the validity of previous findings using a substantially longer span of data. A third notable contribution in this paper is to incorporate political business cycle theories into our model.
Traditional applications from theories of political business
cycles (PBCs) focus exclusively on closed economies. More specifically, effects of ideological policies executed by parties are assumed to only influence the domestic economy. However, we argue that different type (right-wing or left-wing) parties holding offices in both countries are potentially sources of shocks across countries. Since highly interdependent economies tend to explicitly or implicitly link their currencies together, it is likewise possible that co-ordination of monetary policies or fiscal policies is also a source of international business cycles. Therefore, effects of policies implemented by right-wing or left-wing parties may impact business cycles correlation.
Our paper also extends the current political business cycle literature by
both placing partisan schools into an open economy application and by applying time-series techniques to the issue. The paper proceeds as follows: section 2 provides preliminary data analysis. Section 3 presents an illustrative model for an open economy. reported in section 4. Section 5 concludes.
II. Preliminary Data Analysis 4
Estimation results are
The G-7 countries were chosen for this study since they have relatively similar institutions, common levels of infrastructures, and diversified industries.
In addition,
according to Alesina and Roubini (1999), the two-party competition in national elections is easily identified in G-7 countries. Therefore, policy preferences undertaken by parties and consequences of policy actions on business cycles are conceivably linked. The next question is becomes how to evaluate the international business cycles correlation between countries.
From Table 1, it can easily be seen that the growth
rates of gross domestic product (GDP) and industrial production (IP) are not highly correlated.
Using GDP is preferable for the following reasons. First, we are
interested in why the output of main industrialized countries tends to move together as the whole.
Extracting the existence of common elements in aggregate cyclical
behavior using GDP preserves more information about shock transmissions and influences than using IP. Second, the effectiveness of policies undertaken by the political parties usually influences the economy as a whole rather than industries or sectors. Since we only have seven countries in our analysis, we use rolling time series methods to construct business cycle correlations (BCCs) instead of traditional contemporaneous cross correlations (which generates but a single number for each pair of countries). These rolling time series are correlations that update each period: (1)
$ (# , d ) ij ," ! f ( x1 ,..., x k )
where # denotes output, d represents various detrending methods (linear detrending, the Hodrick-Prescott (HP) filter, and the Band-Pass filter proposed by Baxter-King (1999)),
$ ij ," captures the pairwise correlation between country i and j , when i ! j,
5
and xi are the explanatory variables to depict the variation of $ ij ," . " represents the time frame associated with the given quarter. For example, " is designed for period (t-s+1,t) inclusive, if s represents 16 quarters.4
Thus this dynamic correlation
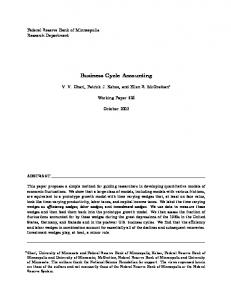
is readjusted each quarter. Figures 1 displays several of these series, with solid and dotted lines represent rolling-time series correlation coefficients for GDP and IP respectively. Business cycles in the United States and Canada have exhibited high degrees of correlation in both GDP and industrial production, which suggests high synchronization across international economies.5
GDP between Germany and France indicate high
co-movements as well, however IP displays a more tenuous relation.
A possible
reason might be that German and French industries are relatively more comparativeadvantage oriented and experience different shocks, but GDP being comprised of whole goods and service sectors are driven by the same aggregate shocks6. Finally, the U.S. and Japan exhibit a high degree of positive correlation until 1990, when Japan’s economy plunged into a long recession just as the U.S. poised ready to spring into its longest expansion of the 20th century. More recently, the output co-movements are once again positive for both series, as the U.S. joined Japan in recession in 2001.
Table 2 presents a more general, though static, picture of BCCs
across the G-7 countries, displaying the medians for all correlation pairs across the time span.
The countries that appear most in synch with one another, on average,
include Canada and the U.S. (0.508), Germany and France (0.570), and to a lesser extent Japan and the U.S. (0.264). Correlations between other pairings are not so
4
We also tried spans of 8, 12, and other longer quarters. The results are not significantly different (available upon request). 5 Since we have twenty-one graphs documenting business cycle correlations for G-7 countries, we only reported three illustrative graphs in Figure 1. Others available upon request. 6 We henceforth focus exclusively on GDP for the remainder of our analysis.
6
readily apparent. We now turn to a model that helps to explain these business cycle movements.
III. An Illustrative Model
In this section, we present a simple two country model that explicitly defines business cycle relationships.
Deriving in part from Frankel and Rose (1998), it is
meant to be illustrative. Its main purpose is to clarify what kinds of assumptions are being made in our empirical analysis. In this model, each country is perturbed by several types of domestic shocks as well as by global and foreign country-specific shocks. Global shocks are of the aggregate supply type. Country-specific shocks can emanate from supply-side, demand-side, monetary, or political factors. They are potentially transmitted to other countries through various channels including the usual trade channel, the interest rate linkage, and exchange rate fluctuations. Changes in output in each country depend on not only global and own country-specific shocks but also transmitted foreign shocks. These shocks are summarized in the following equations.
(2) &y#i ,t ! a1 wt % a 2 uts % a3utd % a4 utm % a5utp % a6 vts % a7 vtd % a8 vtm % a9 vtp (3) &y#* j ,t ! b1 wt % b2 uts % b3utd % b4 utm % b5utp % b6 vts % b7 vtd % b8 vtm % b9 vtp
where &y# ,it ( &y *# ,it ) represents the growth of domestic (foreign) output in country i at time t, # represents GDP, wt denotes global shock at time t, and u and v are shocks originating within the home country and in the foreign country, respectively. Superscripts s , d , m , and p refer to supply or productivity shocks, 7
non-monetary demand shocks, monetary demand shocks, and political shocks.
The
ai and bi coefficients may be scalars or polynomial functions of lag operators. Home and foreign supply shocks are uncorrelated by construction, since the correlated part is separated and called global shocks7.
Home and foreign demand shocks,
monetary shocks, and political shocks however, can be correlated due to reasons such as policy coordination among countries and synchronous changes in preferences against inflation. The covariance of output changes between the generic home and foreign countries is then a function of the variances and covariances of these various shocks, as specified in the following equation which directly derives from (2) and (3):
Cov(&y#i ,t , &y#* j ,t ) ! c1V ( wt ) % c2V (uts ) % c3V (utd ) % c4V (utm ) % c5V (utp )
(4)
% c6V (vts ) % c7V (vtd ) % c8V (vtm ) % c9V (vtp ) % c10Cov (utd , vtd ) % c11Cov (utm , vtm ) % c12Cov (utp , vtp )
where V (') and Cov (',') represent the variance and covariance operators, respectively.
In (4), global shocks have a direct influence on the covariance of GDP through V (w) . Other country-specific productivity, demand, monetary, and political shocks affect the covariance to the extent that they are transmitted to other countries or correlated with similar foreign shocks. In this simple setup, the ongoing process of trade and financial integration takes the forms of both systematic changes in the variances and covariances of structural shocks and changes in the coefficients a 's and b 's, which are then reflected in corresponding changes in c 's. Both the Commission of the European Communities (1990) and Frankel and Rose (1998), inter
alia, support the view that more integration leads to more trade; and that greater international trade results in more highly synchronous business cycles. More 7
A prime example of a global supply shock would be a change in crude oil prices.
8
precisely, the greater degree to which countries engage in intra-trade goods exchange, the more likely these economies are to be driven by common shocks. Thus, V ( wt ) will increase, causing the effects of supply shocks to be captured in c2 and c6 . The covariance of business cycles in intra-trade cases would be unequivocally positive.
However, the view of trade being linked with synchronous business cycles
is not universally accepted.
Eichengreen (1992) and Krugman (1993) argue that
trade integration promotes regional specialization under inter-industry style trade. With specialization, countries will be subjected to relatively more idiosyncratic or country-specific shocks.
Therefore, the effects of inter-industry shocks will be
shown as changes in c 2 and c6 , so that supply shocks have smaller effects on the covariance outputs with higher trade integration.
In addition, increasing divergence
of economic structure implies that countries are less subject to common shocks, such that V ( w) will decline with trade integration. These forces will reduce the covariance of outputs. The effects of financial integration seem more pervasive and likely influence the international transmission of various types of shocks. Financial integration that promotes positive transmission of country-specific shocks will increase coefficients c2 through c8 .
It is also possible that financial integration increases positive
transmission of certain types of shocks while promoting negative transmission for other types. Heathcote and Perri (2003) show that business cycles between the U.S. and the rest of industrialized countries have declined since 1980 and posit that financial integration has been playing a major role in the reduction of international co-movements. The model is also affected by the exchange rate system. For instance, in the Mundell-Fleming model, fixed exchange rates tend to increase the positive transmission of foreign monetary shocks and thus increases c4 , c6 , c7 , and c8 . The
9
strength of transmission also depends on the degree of capital mobility. Capital controls are thought to have enabled countries to maintain divergent economic policies under the Bretton Woods system or the EMS. (Giovannini, 1989) In terms of the above model, such effects of capital controls amount to a reduction in the same set of coefficients c2 through c8 , except for c5 (the foreign political measure). We extend the traditional PBCs8 which have been restricted to closed economy applications to an open economy framework.
The political parties need to form
policies which meet the expectations of their supporting constituencies. Therefore, if similar parties (e.g. right-wing) are in the two administrations at the same time in both countries, policies could be consciously or unconsciously coordinated (while differing political parties would be uncoordinated).
The coefficients of equation (4)
will positively (or negatively) influence business cycle correlations. On a related note, Hibbs (1977) and Alsenia and Roubini (1999) indicate that right-wing parties tend to execute relatively more conservative monetary policies than left-wing parties, and thus tend to have high unemployment rates.
IV. Empirical Results
a. Regression Model In this study, we measure the co-movement of business cycles in two countries by the correlation coefficients between domestic and foreign GDP.
Given that the
correlation series are nonstationary, detrending is necessary. We considered three different methods of detrending: linear detrending, the Hodrick-Prescott (HP) filter,
8
We first emphasize the traditional (permanent) partisan model in our analysis. Hibbs (1977) argues that right-wing parties consistently average lower economic growth, higher unemployment rates, and lower inflation rates, as compared to left-wing parties. However, Alesina (1987) argues the partisan influences only lasting few quarters due to the rational behavior of agents. Thus we also consider rational partisan models using four quarters.
10
and the band-pass filter, since previous researchers have found results to be somewhat sensitive to the choice of detrending method.9 Discussion in the previous section and equation (4) together suggest that BCC depends on integration of goods and financial markets, different ideologies of political parties, the exchange rate regime, and the extent of policy coordination or similarity of policy choices as well as the relative sizes of structural shocks to the economies. On the assumption that the latter remain constant, we employ the following empirical relationship:
(5)
$ ty ! ) 0 % )1Tradet % CM t % ) 3 Party t % ) 4 EXEt % ) 5 DRt % ( t
where $ ty is the business cycle correlation (BCC), and Trade and CM are the respective degrees of goods and financial integration. We measure trade integration by bilateral trade intensity.
Party represents the absolute value of difference
between two incumbents across countries. For each country, the incumbent party takes on the value 1 for right-wing and 0 for left-wing affiliation.
Thus, value of one
recorded in Party denotes different type of parties in the offices. EXE denotes exchange rate variability, defined as the standard deviation of the exchange rate over the past quarter.
The last term, DR, captures the progress in policy convergence as
measured by the nominal interest rates10. Defining the extent of trade integration is relatively straightforward.
We define
Trade as the ratio of bilateral exports plus imports to GDP. Capital mobility or
9
The first difference filter tends to emphasize high frequencies while the linear trend filter weighs high and low frequencies equally. The HP filter approximately passes cycles of frequency eight years or less with the customary value of the smoothing parameter equal to 1600. Baxter and King (1994) propose a third method, called an approximate band-pass filter, which yields similar results to the HP filter when applied to quarterly data. 10 We also considered using the average absolute differential in inflation rates, DINF , but this series was found to be highly correlated with DR.
11
financial integration is trickier to define. Among various measures of capital mobility, we choose absolute average uncovered interest differential (UID), defined as the nominal interest rate differential minus the growth of the nominal exchange rate. Exchange rate variability is measured by average absolute changes in the log of the nominal exchange rate. For the interest rate differential, we employ 3-month treasury interest rates (when possible) or similar short-term interest rates. Both the exchange rate and the foreign interest rate are chosen according to the foreign country. The quarterly data for the G-7 countries are obtained from International Financial
Statistics, published by the IMF, and Direction of Trade. Our model is estimated for the 1980:1 through 2003:4 time period11.
b. Estimation Results The model specified in (5) is estimated using a panel generalized least squares method.
Results are reported in Tables 3a and 3b. Frankel and Rose (1998) and
others find that their empirical results are sensitive to the detrending method used. Thus Table 3a reports results across the three detrending methods assuming that the rational partisan model holds, while Table 3b reports results for the traditional partisan model.
Columns 1 - 3 of Table 3a display regression outputs using the
linear detrended, HP filtered and Band-pass filtered BCCs as the respective dependent variable, all with country-specific fixed effects.
It can be immediately seen that
trade intensity between two nations causes business cycles to become more highly correlated.
On the other hand, greater integration of capital market only positively
influences BCCs using the linear detrending method, while it is not significant using
11
The question of potential reverse causality is not a large issue in our model, since by construction our variable of interest is the correlation of two countries from the given quarter in question to sixteen quarters in the future, while our explanatory variables are all for the current quarter. Thus our model captures how changes in various factors at time t affect BCCs over the next four years.
12
the two alternate filters12.
This result points to goods integration as being a much
stronger link to business cycles than financial flows.
Table 3b echoes these findings,
with the coefficient on capital integration becoming insignificant across all three filtering techniques. Also in accordance with the rational partisan theory, different political parties in the administrations across countries negatively influence synchronous business cycles at the 1% level.
Our result suggests that policymakers want to consider that the
political climate of other developed countries impact the domestic business cycle, though clearly not to the degree that the economic conditions in those countries do. Table 3b shows that both rational and traditional models display similar characteristics, perhaps indicating that the duration of the partisan influence is not nearly as important as modeling the fact that a given party has assumed political power. Exchange rates are also considered as an important channel of shock transmission, and we find that the estimated coefficients for exchange rate variability (EXE) are negative and significant at the 1% level across filters and models, implying that increased currency volatility lowers the co-movement of GDP across any two of the G-7 countries.
The flip side of this, of course, and pertinent from a policy
standpoint, is that a more stable exchange rate causes outputs between two countries to be more synchronized. Thus a consequence of, say, Great Britain joining the European Monetary Union, would be a greater synchronization of outputs across the two areas.
Our model also indicates that an increase in the interest rate differential
lowers BCCs, a finding that shows coordination of monetary policies across developed countries enhances output synchronization.
12
We do not discuss the magnitudes of these coefficients…
13
We also included two additional control variables in our analysis thought to potentially alter business cycle correlations.
First, a dummy variable is introduced
which takes on the value 1 if the two countries for the given pairwise correlation are geographically adjacent, and 0 otherwise. We find that adjacent countries’ GDPs are more highly correlated, ceteris parabis, an unsurprising result since cross-country flows in capital and labor are more likely to occur, thus jointly influencing output. Second, we include a linear trend designed to test if BCCs are more likely after controlling for our outlined specific shocks.
We find in fact that the unexplained
portion of business cycle correlations does not increase over time in G-7 countries, and is in fact negative and significant at the 1% level. Krugman (1993) argues that countries have become more specialized in the process of trade, making countries more subject to domestic shocks.
Our results thus support Krugman’s view, rather
than the findings in Frankel and Rose (1998). One important and rather obvious event that underscores the relevance of our study is the creation of the Euro zone in 1999. In the drive towards a single currency arrangement, France, Germany and Italy had to end all capital controls by January 1993 and have had the same monetary policy since 1999.
Therefore, a reasonable
ex-ante conjecture is that these countries have all moved towards greater business cycle synchronization as their trade and financial have become more integrated. The estimation results from all six model specifications support this conventional wisdom for all of the G-7 countries with respect to trade and interest rates, and to a lesser extent capital mobility.
14
V. Conclusion
Our study has attempted to isolate the economic and political forces that play a part in linking developed economies.
Focusing on the G-7 industrialized countries, we
find that similar monetary policies lead to higher output co-movements.
We also
discover that a greater degree of trade integration, and to a lesser extent capital integration, binds nations to each other’s business cycles. Finally, we show that the similarity of political parties between two countries has an impact on business cycles correlations, implying that the administration in each country could significantly influence the goals of policies in both countries.
Thus, partisan differences partially
dictate the fluctuations of business cycles across countries. An important additional point to note is that our results hold not only for the G-7 countries as a whole, but for subsets of these countries as well13.
Therefore, our
results are not being driven solely by country pairs that have trade treaties in place such as France and Germany, or Canada and the U.S., but rather translate across all of our industrialized countries.
An insightful extension would be to investigate how
other economic factors, including interest rates and inflation rates, have become more correlated over the past quarter century for these countries.
A further step would be
to extend our analysis to a more heterogeneous group of countries such as the OECD or even developing countries.
At the very least, our study has highlighted the
intertwining of economies that share similar trading, financial, monetary and political features.
13
Results available upon request.
15
Table1: Summary Statistics of GDP and Industrial Production, 1980:1 – 2003:1 SD (IP) SD (GDP) CORR(IP,GDP) Canada
1.895
0.897
0.537
France 1.052 Germany 1.572
0.812 5.400
0.201 0.328
Italy Japan UK US
1.608 1.058 1.102 0.721
0.107 0.411 0.268 0.569
1.397 1.641 1.078 1.143
Notes: SD(x) denotes the standard deviation of variable x for the country in question. CORR(IP,GDP) denotes the correlation between GDP and IP across the time span.
Table 2: Median, (GDP) Business Cycle Correlations, 1980:1 – 2003:1 CAN
FRA
GER
ITA
JPN
UK
US
CAN
---
---
---
---
---
---
---
FRA
0.200
---
---
---
---
---
---
GER
-.062
0.570
---
---
---
---
---
ITA
0.036
0.254
0.215
---
---
---
---
JPN
0.075
0.020
0.059
0.229
---
---
---
UK
0.217
0.136
-.163
0.172
0.162
---
---
US
0.508
0.181
-.069
0.033
0.264
0.197
---
Notes: Medians reported here are for linear-detrended business cycle correlations. Medians for BCCs generated using alternate detrending methods yielded similar results (available upon request).
16
Table 3a: Business Cycle Correlations, Full Sample—Rational Model (1)LR
(2)HP
(3)BP
Trade
0.0138 (0.0026)
0.0205 (0.0069)
0.0188*** (0.0066)
CM
0.0086*
-0.0058
-0.0043
(0.0054) -0.0637*** (0.0144) -0.0089***
(0.0048) -0.0452*** (0.0126)
(0.0046) -0.0487 (0.0150)
-0.0140***
-0.0254***
(0.0036)
(0.0031) -0.0204***
(0.0120) -0.0167***
(0.0056)
(0.0054)
Party EXE DR Trend
**
***
-0.0295 (0.0063) -0.0032
***
(0.0004) Adjacent
N
***
0.1128 (0.0320) 3832
***
***
-0.0035
-0.0031***
(0.0003) 0.0946***
(0.0003) -0.0495
(0.0292) 3832
(0.0293) 3832
Notes: * (** (***)) represent statistical significance at the 10% (5 % (1%)) levels, using student’s t distribution. All three columns report results for panel GLS regressions with country-specific fixed effects. Country fixed-effects coefficients not reported.
17
Table 3b: Business Cycle Correlations, Full Sample—Traditional Model (1)LR
(2)HP
(3)BP
0.0152*
0.0209***
0.0192***
(0.0078)
(0.0069)
(0.0066)
CM
0.0087
-0.0048 (0.0046)
Party
(0.0054) -0.0713***
-0.0063 (0.0048) -0.0387***
-0.0372***
(0.0144) -0.0087*** (0.0036) -0.0291***
(0.0125) -0.0137*** (0.0030)
(0.0119) -0.0176*** (0.0028)
-0.0201***
-0.0168***
(0.0063)
(0.0056) -0.0035***
(0.0054) -0.0031***
(0.0003)
(0.0003)
Trade
EXE DR Trend Adjacent
N
***
-0.0033 (0.0004) 0.1128
***
0.0946
***
-0.0495
(0.0320)
(0.0292)
(0.0293)
3832
3832
3832
Notes: * (** (***)) represent statistical significance at the 10% (5 % (1%)) levels, using student’s t distribution. All three columns report results for panel GLS regressions with country-specific fixed effects. Country fixed-effects coefficients not reported.
18
Figure 1: Business Cycle Correlations BCCs between the US and Canada G D P and IP
1.0 0.8 0.6 0.4 0.2 0.0 -0.2 -0.4 1980
1982
1984
1986
1988
1990
1992
1994
1996
1998
2000
2002
1998
2000
2002
BCCs between the US and Japan G D P and IP
1.0 0.8 0.6 0.4 0.2 -0.0 -0.2 -0.4 -0.6 -0.8 1980
1982
1984
1986
1988
1990
19
1992
1994
1996
References: Alesina, A. and N. Roubini. 1999. Political cycles and the Macroeconomy. The MIT Press. Alesina, A. 1987. Macroeconomic Policy in a Two-Party System as a Repeated Game,
Quarterly Journal of Economics 102: 651-78. Artis M. and W. Zhang. 1997. International Business Cycles and the ERM.: Is there a European Business Cycle? International Journal of Finance and Economics 2(1): 1 -16. Backus D. and P. Kehoe. 1992. International Evidence of Historical Properties of Business Cycles, American Economic Review 82(4): 864-888. Baxter M. and R. King. 1999. Measuring Business Cycles: Approximate Band Pass Filters for Economic Time Series. Review of Economics and Statistics 42(6): 1141-72. Baxter M. and A. Stockman. 1989. Business Cycles and the Exchange-Rate Regime: Some International Evidence. Journal of Monetary Economics 23(3): 377 – 400. Bordo, M. and T. Helbling. 2003. Have National Business Cycles Become More Synchronized? NBER Working Paper #10130. Calvo, G. and E. Mendoza. 2000. Rational Contagion and the Globalization of Securities Markets, Journal of International Economics 51(1): 79-113. Canova F. and J. Marrinan. 1998. Sources of Propagation of International Output Cycles: Common Shocks or Transmission, Journal of International Economics 46: 133-166. Canova, F. and H. Dellas. 1993. Trade Interdependence and the International Business Cycle, Journal of International Economics 34: 23-47. Costello, D. 1993. A Cross-Country, Cross-Industry Comparison of Productivity Growth, Journal of Political Economy 101: 207-222. Cukierman, A. and A. Meltzer. 1986. A Theory of Ambiguity, Credibility, and Inflation under Discretion and Asymmetric Information. Econometrica 54(5): 1099 – 20
1128. Doyle B. and J. Faust. 2003. Breaks in the Variability and Co-Movement of G-7 Economic Growth. Board of Governors of the Federal Reserve System, International
Finance Discussion Papers 786. Eichengreen, B. 1992. Should the Masstricht Treaty be Saved? Princeton Studies in
International Finance, No. 74. International Finance Section, Princeton University, December. Flood R. and R. Hodrick. 1986. Real Aspects of Exchange Rate Regime Choice with Collapsing Fixed Rates. Journal of International Economics 21: 215 – 32. Frankel, J. and A. Rose. 1998. The Endogeneity of the Optimum Currency Area Criteria, The Economic Journal 108: 1009-1025. Gerlach, S. 1988. World Business Cycles under Fixed and Flexible Exchange Rates,
Journal of Money, Credit, and Banking 20(4): 621-632. Gregory, A., A. Head, and J. Raynauld. 1997. Measuring World Business Cycles,
International Economic Review 38(3): 677-701. Heathcote J. and F. Perri. 2003. Why has the U.S. Economy Become Less Correlated With the Rest of the World? American Economic Review 93(2): 63-69. Heckelman, J. 2002. Electoral Uncertainty and the Macroeconomy: the Evidence From Canada, Public Choice 113: 179-189. Hibbs, D. 1977. Political Parties and Macroeconomic Policy, American Political Science Review 71: 1467-87. Imbs, J. 2004. Trade, Finance, Specialization, and Synchronization, Review of Economics and Statistics 86(3): 723-734. Krugman, P. 1993. Lessons of Massachusetts for EMU, in (F. Giavazzi and F. Torres, eds.) The Transition to Economic and Monetary Union in Europe, New York: Cambridge University Press, pp. 231-61. Lindbeck, A. 1976. Stabilization Policies in Open Economies with Endogenous 21
Politicians, American Economic Review Papers and Proceedings, 1-19. Mendoza, E. 2001. Credit, Prices and Crashes: Business cycles with a Sudden Stop,” in S. Edwards and J. Frankel (Eds.), Preventing Currency Crises in Emerging Markets. Nordhaus, W. 1975. The Political Business Cycle. Review of Economic Studies 42: 169-90. Otto, G., G. Voss and L. Willard. 2001. Understanding OECD output correlations, RBA Research Discussion Paper 2001 - 05, Reserve Bank of Australia. Persson T. and G. Tabellini. 1990. Macroeconomic Policy, Credibility, and Politics. Fundamentals of Pure and Applied Economics (Vol. 38). Harwood Academic: New York. Rogoff K and A. Sibert. 1988. Elections and Macroeconomic Policy Cycles. Review
of Economic Studies 55(1): 1 – 16. Stockman A. 1988. Sectoral and National Aggregate Disturbances to Industrial Output in Seven European Countries, Journal of Monetary Economics 21(2/3): 387-409.
22