Int j simul model 9 (2010) 4, 208-216 ISSN 1726-4529
Original scientific paper
ANALYSIS AND OPTIMIZATION OF A BAKERY PRODUCTION LINE USING ARENA Hecker, F.*; Hussein, W.** & Becker, T.** *
Department for Process Analysis and Cereal Technology (FG Prozessanalytik und Getreidetechnologie)
Universität Hohenheim, Garbenstr. 23, 70599 Stuttgart, Germany ** Department of Life Science Engineering (Ingenieurwissenschaften für Lebensmittel und biogene Rohstoffe, Arbeitsgruppe (Bio-)Prozesstechnik und Prozessanalyse)
Technische Universität München, Weihenstephaner Steig 20, 85354 Freising, Germany E-Mail:
[email protected],
[email protected],
[email protected]
Abstract Production planning in German bakeries is mainly based on the experience of the responsible production manager. As a result production planning happens more or less “chaotic”, which often results in “bottle-necks”, deficient dimensioning, ineffective staff allocation and operational problems. The aforementioned points cause a production environment in which factories are not able to achieve the best possible economical and ecological performance. As shown in several industry branches, it is highly advantageous to use virtual models in order to detect and improve suboptimal processes. Models behave like the real system and provide the possibility to predict the changes that may occur to the real production, if the specifications of the production change. For those reasons, virtual modelling supplies the user with a powerful tool for production planning. In this case study ARENA was used as the modelling and simulation tool to analyse a bakery production line. (Received in August 2010, accepted in October 2010. This paper was with the authors 1 month for 1 revision.)
Key Words: Simulation, ARENA, Production Planning, Bakery, Process Analysis
1. INTRODUCTION Applications of virtual modelling and simulation in bakery production processes are, if existing at all, very rare although there are many software programs which are built for the simulation of industrial processes and have been successfully implemented for contact centers, auto manufacturing plants, bank facilities, and airport operations, like AUTOMOD, WITNESS, FLEXSIM and ARENA. Kelton [1] presented the concepts and methods of simulation using ARENA as a carrier to help the modeller reach the ability to carry out effective simulation modelling. ARENA is based on SIMAN modelling language, and has an object-oriented design and the ability to be tailored to any application area. Banks [2] and Balci [3] focused on verification and validation of the model as the most important element. Their aim was to certify the model’s accuracy when used to predict the performance of the real-world system that it represents, or to predict the difference in performance between two scenarios or two model configurations. Shannon [4] cited the "40-20-40 Rule". This rule states that 40 percent of the effort and time in a project should be devoted to the understanding of the problem, goals, boundaries and collecting data. The next 20 percent is to the formulation of the model in an appropriate simulation language, and the remaining 40 percent to the verification, validation and implementation. Greasley [5] noted that simulation is best suited to systems that do reach equilibrium, meaning that the stability of the process needs to be considered before simulation is used. The author also mentioned the importance DOI:10.2507/IJSIMM09(4)4.175
208
Hecker, Hussein, Becker: Analysis and Optimization of a Bakery Production Line Using … of the visual animated display as a communication tool to facilitate discussion and development of new ideas. Furthermore, Goldsmann [6] presented a reasonable proposal to analyse the simulation results. This paper displays the current research on modelling and simulation of baking processes, with the solution of the processing problems and optimization of the production plans. A procedure combining elements of Banks and Shannon has been used in this case study. The work is carried out at the Department for Process Analysis and Cereal Technology, Institute of Food Science and Biotechnology, University of Hohenheim and represents the first step in an approach on adapting a commercial simulation software solution for its use in the baking industry. Although there are some recent approaches to analyse bakery associated processes, e. g. using Resource Flow Diagrams [7], this work presents to the best of our knowledge the first approach using the simulation software ARENA for this purpose. Furthermore there was no example found in recent literature reviews [8-9] that deals with the optimization of bakery production or production plans by means of using methods of scheduling theory. The goal of this development project will be a production planning tool that, for the first time, provides bakeries with the possibility of automatically generating an optimized production plan according to different topics, like for example device utilization or energy consumption. The provision and use of such a tool would offer a completely new approach for production planning in German bakeries. Up to now, the software based production planning in this industry branch only uses product recipes and amounts of finished products required to generate a “to do - list” for the production department. All further implications of production planning like starting times for each product or staff assignments are handled “manually” and often just based on the experience of a shift leader or production manager. The quality of production planning performed in this way is clearly depending on the decisions made by a small group of people, in cases of small companies even on one single person. This of course yields a high risk of causing severe problems in the production due to a system that is errorprone by wrong decisions made by the production planner or his possible loss due to unplanned events like sickness. Most commonly the production planning in bakeries is carried out “backwards”, having just a deadline on which the products have to be finished and ready for distribution. Therefore the use of a simulation based tool with the possibility to provide a numerically optimized production plan, calculated according to the production goal of the following shift, will remarkably increase the efficiency and performance of production planning in the German baking industry. Due to the fact that the German baking industry consists of about 15800 (state in 2007) baking companies with 135000 employees and an annual turnover of about 15 bn euros, there is a huge potential of savings in production costs and energy consumption by increasing the productivity of those companies. In this case study, we choose the production line of a small bakery that produces ten kinds of products as a working example, and its production processes are modelled using ARENA. The modelled processes are connected to figure out the proposed production line. There are also examples shown for how to model different bakery typical ways of product distribution to different paths within the production line. The virtual production line is being simulated to validate the process inputs/outputs with respect to the real bakery production line’s data. Once the model is validated, the analysis of the simulation data is performed, and the optimization suggestions are investigated.
209
Hecker, Hussein, Becker: Analysis and Optimization of a Bakery Production Line Using …
2. MATERIAL AND METHODS This case study was carried out using the software “ARENA 11.0, Professional Edition” of Rockwell Automation Technologies Inc. and a “Lenovo ThinkPad R500” as hardware. To model the production line and obtain efficient process simulation and consequently process optimization, the procedure initiates by collecting the bakery data. This data is collected for one shift period which starts at 1:00 and ends at 7:10. The next step is to formulate the model and simulate it, followed by validation of the simulation results with respect to the real data, after which these results are used for analysis and optimization purposes. 2.1 Production line data The production line data includes the bakery products, the utilized devices (Table I), and the workers responsibilities. Table I: The utilized devices in the bakery production line. Device Name Mixer Dough Divider Forming Machine (Depositor) Dough Retarder (Fermentation Interruption) Dough Proofer Rack Oven Tunnel Oven
No. of Items 2 1 1 1 1 1 1
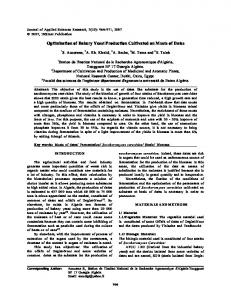
The number of workers on the workbench (to form the dough) is three, one of them is also charged to make the doughs in the different mixing systems. Thus, during the mixing period there will be only two bench workers. One worker is required to transport the products between baking processes and another worker for the final products’ packaging. As shown in Fig. 1, the production plan clarifies the processes that each product will go through on the production line during the shift, starting from the dough making process up to the product shipping process. Two products, indicated by the elevated index (Several seed Rolls1 and Poppy seed Rolls1), terminate their processing path at a “Dough Retarder”, to be baked in the following shift period. 2.2 Production line modelling and simulation ARENA is an advanced software program that provides an interactive environment for graphically animating, verifying and analyzing simulation models. Within ARENA’s building area, the bakery production line model is generated using predefined modules. Each module is programmed to represent a certain production line process or device. For example: the “Tunnel Oven” module (in Fig. 2) contains all required information about the baking process in the tunnel oven. In addition, some attributes are assigned in the beginning of the model as properties attached to the entities that represent the specified products. Such like “Rye Bread.Baking Period” which is an attribute that refers to the baking time necessary for the “Rye Bread” dough.
210
Hecker, Hussein, Becker: Analysis and Optimization of a Bakery Production Line Using … Shipping Starts
Packaging Starts
Cooling Starts
Baking Starts
Fermentation Starts
WorkBench 2
Rye Bread Poppy seed Rolls¹ Poppy seed Rolls Rolls Several seed Rolls¹ Rye Rolls Rye-Wheat Bread Baguette Several seed Rolls Wheat-Rye Bread Spelt Bread White Bread
Forming Starts
WorkBench 1
Delaying Starts
07:00
06:30
06:00
05:30
05:00
04:30
04:00
03:30
03:00
02:30
02:00
01:30
01:00
Mixer Entrance
Figure 1: The time plan for one shift period explains the stages that products will follow on the production line. Some decision modules (e.g. Ovens Distributer) are also used to spread out the products to their consequent processes (modules). In this special case the distribution of the entities is fixed to different paths (oven modules), according to the real products that are baked in the represented oven type. This means that the entities can be distributed according to attached information like e.g. their name.
Figure 2: Production line modelling (distribution of products to ovens).
211
Hecker, Hussein, Becker: Analysis and Optimization of a Bakery Production Line Using … In bakeries it is very common that there is more than one device of the same type, which are used for different products and utilized in a random way only according to which one of them is idle by that certain time. Such a “chaotic” distribution is modelled in ARENA by using an additional module (“Hold”) that scans the model for a certain condition, in this case an idle device, and releases a previously held entity as soon as the condition is detected. Fig. 3 shows an example for the aforementioned configuration.
Figure 3: Model for a distribution according to module (device) utilization. Fig. 4 is a screenshot of the production line simulation and illustrates the flowing of products among production devices.
Figure 4: Screenshot of a part of the production line during simulation.
3. RESULTS AND DISCUSSION Once the simulation results are validated with the real production line data, we can rely on them to analyse and optimize the production line processes. Fig. 5 shows some of the simulation results. The rack oven (Fig. 5 b) is idle for 55 minutes out of its 185 total working
212
Hecker, Hussein, Becker: Analysis and Optimization of a Bakery Production Line Using … minutes (it is shut down from 4:00 up to 4:50), totally this wastes about 30 % of its energy. “Tunnel Oven”, “Dough Retarder” and “Dough Proofer” can be occupied with more than one product at the same time. Nevertheless, the tunnel oven contains only one product for 170 minutes out of its 205 total working minutes (Fig. 5 c). Meanwhile, the dough proofer contains only one product for 125 minutes out of its 215 total working minutes. Moreover, workbench schedule (Fig. 5 d) places its workers free for 50 minutes in the middle of the shift period, which is a quite long composite break compared to their 174 total actual working minutes. Finally, the “Several seed Rolls” dough waits for 25 minutes before being processed in the “WorkBench 2”, after being formed in “WorkBench 1” and “Dividing Machine”. This is a relatively long waiting period for pre-formed dough.
Figure 5: Simulation results for some production line devices utilization. 3.1 Production line optimization The above observations imply that the real production line is attached with a suboptimal production plan, and it is preferable to design a more effective production plan that reduces the wasted time and energy. Using the production line model, it is simple to modify the
213
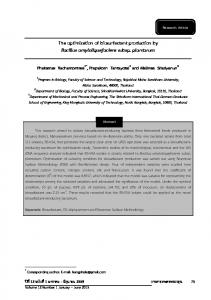
Hecker, Hussein, Becker: Analysis and Optimization of a Bakery Production Line Using … production plan, and instantaneously observe the responses on the simulation results. After some iterations, we reach a more qualified production plan as shown in Fig. 6. By rescheduling the production plan of some products, the idle utilization time gaps of “Rack Oven” are removed and it is fully occupied through its 130 working minutes. It is worth mentioning that the continuous operation of this device is not risky. As for the bench workers schedule, we can reorganize their break to start at 2:50 for 15 minutes, and continue working for 35 minutes. Then they are given another break for 5 minutes, and continue working for the last 40 minutes. Rescheduling of those products’ production plan will also decrease the working period of the “Tunnel Oven” and “Dough Proofer”. This is achieved by increasing the rate of their processing products per time, to be more than one when applicable. Additionally, the “Several seed rolls” dough will be no longer delayed before being processed in “WorkBench 2”. Shipping Starts
Packaging Starts
Cooling Starts
Baking Starts
Fermentation Starts
WorkBench 2
Rye Bread Poppy seed Rolls¹ Poppy seed Rolls Rolls Several seed Rolls¹ Rye Rolls Rye-Wheat Bread Baguette Several seed Rolls Wheat-Rye Bread Spelt Bread White Bread
Forming Starts
WorkBench 1
Delaying Starts
07:00
06:30
06:00
05:30
05:00
04:30
04:00
03:30
03:00
02:30
02:00
01:30
01:00
Mixer Entrance
Figure 6: The optimized time plan for one shift period explains the stages that products will follow on the optimized production line. Fig. 7 shows a comparison in devices utilization and workers allocation, between the real production line and the optimized one. The reduced working times (Fig. 7 a, b and c) and by that reduced energy consumptions of “Rack Oven”, “Tunnel Oven” and “Dough Proofer” are obvious. On the other hand, Figs. 7 d and 7 e show that the total working time of the bench and packaging workers is reduced by 30 and 55 minutes, respectively. The saved workers’ time can be fulfilled in other tasks or saving 13 % of the bench workers’ salary and 19 % of the packaging workers’ salary. Finally, the packaging process terminates at 6:50 rather than 7:10, reducing the total shift period by 20 minutes. 214
Hecker, Hussein, Becker: Analysis and Optimization of a Bakery Production Line Using …
Figure 7: Comparison in resources management before optimization (dotted line) and after optimization (solid line).
4. CONCLUSION Simulation of the bakery production line presents a good opportunity to optimize the processes and save energy consumed of the production devices. Furthermore decreasing the working period of the workers on the production line, saves extra salary, or at least will make the workers free for other bakery tasks. The work presented here is to be understood as a first step of applying modelling and simulation routines to analyse the production planning and performance in industrial bakeries. The upcoming step to this research is to create a generalized simulation and optimization tool for bakery production lines that will provide an automated optimization algorithm and a simple-to-use interface. This tool shall allow the user to define and save the production line data, simulate the generated production line model, analyse and optimize the simulation results according to different points of view. The production environment of medium-sized German bakeries provides a high diversity in products, 100 different items is a common range of products, and a very time-dependent process. Most bakery products contain yeast as a proofing agent and therefore the processes
215
Hecker, Hussein, Becker: Analysis and Optimization of a Bakery Production Line Using … between the kneading of dough and the baking have very little tolerance in delays because once the yeast and substrates are brought together, in the kneading process, the fermentation starts. On the other hand this fermentation needs a certain time until it reached a desired level, where enough CO2 was produced to provide a soft and porous crumb in the finished baked good. Those two points, the high diversity of products and processes and the very determined time frame in producing bakery goods, make the efficient production planning and optimization in the baking industry by applying modelling, simulation and numerical routines a challenging, yet highly interesting intention.
REFERENCES rd
[1] Kelton, W. D.; Sadowski, R. P.; Sturrock, D. T. (2004). Simulation with ARENA, 3
edition, McGraw-Hill, New York [2] Banks, J. (1999). Introduction to Simulation, Proceedings of the 1999 Winter Simulation
Conference, from: http://www.informs-cs.org/wscpapers.html, accessed in June 2010 [3] Balci, O. (1990). Guidelines for successful simulation studies, Proceeding of the 1990 [4]
[5] [6] [7]
[8]
[9]
Winter simulation Conference, 25-32 Shannon, R. E. (1998). Introduction to the Art and Science of Simulation, Proceedings of the 1998 Winter Simulation Conference, from: http://www.informs-cs.org/ wscpapers.html, accessed in June 2010 Greasley, A. (2003). Using Business-Process Simulation within a Business Process Reengineering Approach, Business Process Management Journal, Vol. 9, No. 4, 408-420 Goldsmann, D. (1992). Simulation Output Analysis, Proceedings of the 1992 Winter Simulation Conference, 97-103 Meyer, U. B.; Creux, S. E.; Weber Marin, A. K. (2007). Process Oriented Analysis – Design and Optimization of Industrial Production Systems, CRC Press Taylor & Francis Group, Boca Raton Ribas, I.; Leisten, R.; Framinan, J. M. (2010). Review and classification of hybrid flow shop scheduling problems from a production system and solution procedure perspective, Computers & Operations Research, Vol. 37, 1439-1454 Vignier, A.; Billaut, J. C.; Proust, C. (1999). Hybrid flowshop scheduling problems: State of the art, Rairo – Recherche Operationelle – Operations Research, Vol. 33, No. 2, 117183
216