Balancing Interactive Data Management of Massive Data with Situational Awareness through Smart Aggregation Daniel R. Tesone * and John R. Goodall † Secure Decisions, a division of Applied Visions Inc.
ABSTRACT Designing a visualization system capable of processing, managing, and presenting massive data sets while maximizing the user’s situational awareness (SA) is a challenging, but important, research question in visual analytics. Traditional data management and interactive retrieval approaches have often focused on solving the data overload problem at the expense of the user’s SA. This paper discusses various data management strategies and the strengths and limitations of each approach in providing the user with SA. A new data management strategy, coined Smart Aggregation, is presented as a powerful approach to overcome the challenges of both massive data sets and maintaining SA. By combining automatic data aggregation with user-defined controls on what, how, and when data should be aggregated, we present a visualization system that can handle massive amounts of data while affording the user with the best possible SA. This approach ensures that a system is always usable in terms of both system resources and human perceptual resources. We have implemented our Smart Aggregation approach in a visual analytics system called VIAssist (Visual Assistant for Information Assurance Analysis) to facilitate exploration, discovery, and SA in the domain of Information Assurance. CR Categories and Subject Descriptors: H.1.2 [Models and Principles]: User/Machine Systems — Human information processing; I.3.6 [Computer Graphics]: Methodology and Techniques — Interaction techniques Additional Keywords: Data management, visual analytics, data retrieval, information visualization, smart aggregation, situational awareness. 1
INTRODUCTION
As a result of exponential growth in the collection and storage of data, government and commercial organizations are finding it increasingly difficult to efficiently analyze and obtain useful intelligence about the data being collected. Many of these organizations are turning to visual analytics to help in the discovery of useful information that is typically buried within the data collection. However, Information Technology (IT) systems have finite amounts of resources, such as processor power, memory, and monitor real estate. In addition to the finite limitations of system resources, humans’ perceptual capabilities also have limitations. Information visualization can take advantage of human perceptual capabilities by displaying information in graphical, interactive computer systems. However, not all visualization techniques can scale to the massive data sets * e-mail:
[email protected] † e-mail:
[email protected]
IEEE Symposium on Visual Analytics Science and Technology 2007 October 30 - November 1, Sacramento, CA, USA 978-1-4244-1659-2/07/$25.00 ©2007 IEEE
now common, both in terms of what a system can process and display, and what a human can perceive. Thus, visual analytics technologies must employ a data management strategy to successfully process and retrieve data that is often in excess of the system’s or human’s resource capabilities. Some data management strategies focus on the reduction of data by enforcing specific criteria to be applied to every data request; others may truncate results after a certain maximum record count is exceeded. Some strategies make use of database cursors that help the user access only a portion of the result set at a time. Still others attempt to cluster results set data based upon uniqueness. In addition to each strategy having its own set of advantages and disadvantages in terms of data reduction capability, each strategy also has implications on the level of Situational Awareness (SA) that is afforded to the user. An effective visual analytics system should strive to maximize users’ SA by avoiding automatically hiding, truncating, or transforming data without the user’s knowledge. Systems should offer multiple simultaneous ways to represent the data and display data in an unambiguous manner. Systems should also provide mechanisms to allow users to drill into the data to facilitate further exploration. Users of visual analytics technologies are often required to be intimate with the underlying data sets in order to avoid overloading the system with data that is returned from an arbitrary request. However, this requirement is antithetical to one of the primary strengths and purposes of visual analytics systems – these tools enable exploration of the data that facilitate new insights into data, and enable users to answer questions they didn’t even know they had. Users should be exploring the data to generate new insights; they should not need to understand the data beyond their domain knowledge. Many systems today rely on users knowing what data requests are “safe” and what requests may cause the system to become unresponsive. Others provide the capability for users to make use of aggregation functions at the time of data request, but depend on users to recognize when such actions are required to keep the system responsive. Rather, effective visual analytics systems should be designed to automatically determine when a particular data request is going to exceed the system’s resources and automatically take the necessary actions to ensure the system remains functional. This automation should be combined with user-driven awareness of when and how these automated actions will occur. In this paper we present the Smart Aggregation data management approach that automatically determines when data reduction is required and aggregates the data as needed while preserving SA. The approach we propose has been implemented in a visual analytics system for Information Assurance, VIAssist (Visual Assistant for Information Assurance Analysis). The system always remains functional regardless of the users’ (potentially damaging) data requests. This is accomplished by intelligently selecting specific fields for aggregation from the data request followed by selection and application of a user ranked cardinality reducing function for each selected field in order to control the amount of data returned from the data request. This
67
approach ensures that users do not need to know the details of the data while still maintaining SA. 2
SITUATIONAL AWARENESS
Considerable research on Situational Awareness has been published in the psychology and human factors literature. Endsley describes SA as simply “knowing what is going on around you,” and within that knowledge of your surroundings knowing what is important [3]. One doesn’t need to know everything, only those things necessary to make accurate, timely decisions. In order to maintain SA, it is important to avoid “black box” approaches in visual analytics systems. Defined as the “Rational Gap” in information visualization [1], the disconnect between perception and explanation makes maintaining SA impossible. An effective visual analytics system should maximize users’ SA by avoiding approaches that make explanation problematic. Automatically transforming data without the user’s knowledge or transforming data in ways a user cannot understand impedes SA. The deluge of data in many domains – including Information Assurance, where analysts regularly examine multiple gigabytes worth of data at a time – often results in the need to reduce or aggregate data to provide an overview of the entire data set. Even with advanced information visualization techniques, this data reduction is often required to gain the big picture comprehension that is crucial to SA. The challenge discussed in this paper is to identify data management methods that balance this necessary data reduction with the need to maintain SA. 3
INTERACTIVE DATA MANAGEMENT STRATEGIES
When dealing with data volumes that are measured in gigabytes or more, how does a system designer prevent users from requesting more data than the system is capable of handling and what are the implications on the user’s SA? Choosing a data retrieval strategy that will safeguard users from overloading the available, finite system resources while simultaneously providing the best possible SA should be done with the clear understanding of what implications come with each strategy. The focus of this paper is on interactive data management approaches for processing interactive, user-driven queries and not on determining the most efficient data storage algorithm, indexing schemes, or querying techniques. However, these areas can have a profound impact on the timeliness of data retrieval. A great deal of research has been performed on determining efficient storage, indexing schemes, and querying techniques when working with extreme amounts of data (e.g., in the 100’s of gigabyte range). In the area of computer network traffic data, researchers at Lawrence Berkeley National Laboratory have conducted a great deal of research on query-driven visualization of large datasets [7][8][9]. Their approach to only visualize what is scientifically interesting coupled with powerful hardware and efficient bitmap indexing should certainly be considered when attempting to collect, store, and process the enormous amount of data flowing on a network. The concepts outlined in this paper can be implemented into any visual analytics application that is tied to a back-end repository that provides mechanisms for aggregating data. The process is aimed at automatically keeping requested data within client system tolerable limits and as such can provide added value to all prior research that has been performed on “increasing the signal from the noise” and on efficient data storage and indexing schemes. The remainder of this section will examine common data retrieval strategies for relational data. 3.1 Result Set Limits The most straightforward approaches to data management are those that limit the result sets of queries.
68
3.1.1 Row Fetch Limits Naïve data management systems may attempt to use repository row fetch limits to quickly and easily keep result sets within the target system’s tolerable limits. Most relational repositories allow for configuration of the maximum number of rows a result set from any arbitrary query will return. When a particular query result set reaches the defined maximum number, the query is stopped and the max number of records is returned to the user. Advantages. Most relational repositories offer the capability of limiting the rows returned from arbitrary queries making this strategy extremely easy to implement. The target system can be guaranteed to never receive more than the maximum defined rows of data thus enforcing the desire for the target system to always remain functional. Disadvantages. With row fetch limits the user has no chance of ever being able to analyze the data that is beyond the defined maximum row limit. Another drawback is the user is typically not given any indication of how many records would have returned if the row limit was not in place. Situational Awareness. Based upon the percentage of the data returned in reference to data requested, a user’s SA will quickly degrade as the percentage of actual data returned decreases. 3.1.2 Cursor Scrolling A data management strategy that employs database cursor scrolling performs an initial data fetch where the result set is limited to the first N rows. Unlike the database limit on rows returned as described above, the user of an application that has database cursor scrolling capabilities is able to request the next (or previous) N rows of data. In essence, database cursor scrolling allows for a specified data window size that can be moved around the entire result set. Advantages. Database cursor scrolling offers utility to users by allowing them to analyze the entire data set chunk by chunk. Disadvantages. Users must perform a great deal of cognitive work. The user will create mental models of each chunk of data that is analyzed and cognitively fuse those together in the attempt to form an accurate mental model of the entire data set. This kind of approach can lead a user to succumbing to the Requisite Memory Trap SA demon [4] where only a limited amount of information can be kept in short term memory and any new information has the potential to replace existing important information already in memory. Situational Awareness. Database cursor scrolling is a data management strategy that has the potential to allow the maintenance of SA by analyzing each data chunk and cognitively fusing each chunk to form the “big picture” mental model. Since the entire data set can not be displayed at one time, the level of SA that is obtained will vary based upon each user’s mental capacity to retain information over time. Relying on the user’s mental capacity is a drawback to obtaining and retaining good SA. Some users will perform much better than others when faced with exactly the same circumstances when this strategy is used. 3.2 Forced Criteria The forced criteria strategy automatically appends specific criteria to each and every data request to keep the result sets for all data requests within system tolerable limits. Two types of forced criteria approaches are described below. 3.2.1 System-Defined Forced Criteria The system-defined forced criteria strategy includes the data fields and values that the system designer has determined will keep the result sets within system tolerable limits. Fields that are often chosen for forced criteria often involve a date/timestamp field reflective of when a particular record was added to the
repository. System administrators of the system would have a good understanding of the magnitude of data that is typically inserted each hour, day, week, month or year. The administrators would leverage this knowledge along with their understanding of the target system’s tolerable limits and enforce every data request to include criteria of a certain time span that is believed to return a tolerable amount of data for the target system. Of course, other field types could be used in place of or in addition to the date/timestamp field to limit data retrieval. The fields that will make the most sense are highly dependent upon the nature of the data being collected. Advantages. System-defined forced criteria is very simple to implement and can be an effective way of reducing data load. Disadvantages. Users are only presented with what may be a small “slice” of the data. Due to the presence of the forced criteria, the user is never able to see the “big picture” of the data. Although the forced criteria may be fully disclosed to users, providing them with an understanding that the data has been artificially restricted, users can easily formulate an inaccurate mental model of what the entire data set is really conveying because they are only seeing a small slice. Another problematic characteristic of system-defined forced criteria deals with the uncertainty of future data throughput. Criteria based on studies of historical data throughput and content may not be an accurate indication of future data throughput and content, thus causing current forced criteria to be either too restrictive or not restrictive enough for future circumstances. Situational Awareness. This method tends to provide users with poor SA due to inability to grasp the “big picture” and the ease of forming an inaccurate mental model of the situation based upon analysis of only a section or slice of the data. Further, if the system administrator changes the criteria to keep up with changing usage, the users must also maintain awareness of the dynamically changing criteria. 3.2.2 User-Configurable Forced Criteria User-configurable forced criteria can be used to overcome some of the disadvantages of system-defined forced criteria section. This data management strategy forces a user to repeatedly select fields and criteria values to build a forced Structured Query Language (SQL) where clause that is used to restrict the requested result set. Each time a user adds a new piece of criteria to the data request, a count query can be generated to help determine if the requested result set will be within tolerable limits prior to making the full data request. While the request is outside the tolerable limits for the target system, users are forced to add more criteria. Once the count query is found to be within tolerable limits, the full query can be submitted and the result set displayed. Advantages. This easily implemented approach improves upon the system-defined forced criteria in that the user has full control over how the data is filtered rather than relying on the system to define the criteria. Disadvantages. Users are still only presented with what may be a small “slice” of the data, preventing the big picture view. Situational Awareness. Poor SA can still result with large data sets due to the user only retrieving a slice of data. Although the attempt to keep the user “in the loop” increases the chances of this strategy giving the user better SA over system-defined forced criteria, this approach still suffers from the inability for users to see the “big picture” which fosters inaccurate mental models of the situation resulting in this approach providing the user with overall poor SA. 3.3 Aggregation The term aggregation refers to the grouping of multiple items together to form a single item. It is essential in managing massive
data to determine methods in which the data can be aggregated to produce smaller data sets. In terms of SQL, aggregation is most commonly performed by making use of the Group By, Select Distinct, and available aggregation functions capabilities. Group By essentially allows for the “roll-up” or clustering of data based upon the field(s) defined in the Group By. For example, to determine the average salary paid in each department one could formulate the simple SQL statement: SELECT Dept, AVG(Salary) FROM Employee GROUP BY Dept; This statement will only return a row count that is equal to the number of distinct departments regardless of how many records actually exist in the Employee table. As the SQL statement shows, when Group By constructs are used all fields that are not included in the Group By clause must have aggregating functions, such as AVG, placed on them. Select Distinct allows a SQL request to only bring back a single row of data for each distinct combination of fields. Aggregation Functions are used to reduce the cardinality of a specific data column. Cardinality is defined as the number of unique elements found in a specified data column. Low cardinality data columns contain a high percentage of repeated data values. High cardinality columns contain a low percentage of repeated data values. The SQL aggregation functions of count, minimum, maximum, sum, and average all reduce a column’s data cardinality to a single value regardless of how many rows of data exist in the specified table of which the data column belongs. Typically, aggregation involves a combination of Select Distinct and/or Group By in concert with the various aggregation functions that have been outlined above. Depending on the actual nature of the data this kind of standard aggregation may be sufficient to produce manageable result sets from arbitrary SQL data requests. This is especially true if only a handful of low cardinality fields are being requested. If, however, a large number of fields from the database are typically requested, this simple approach to aggregation will very likely not be able to reduce the data – each additional field lowers the ability for Group By constructs to reduce the result set. This aggregation approach also breaks down when any number of fields (large or small) are requested where one or more of the fields are considered to be of high cardinality, those fields with a great deal of variation. High cardinality fields such as date/time fields in SQL requests are unable to have their result sets reduced by merely grouping data or asking for distinct values. The very nature of high cardinality fields is that there are many unique values thus defeating the attempt to cut down a result set by only requesting unique values. Many applications that do not “gracefully”1 handle large data use only the simple aggregation approach where the sole attempt was to group data and not change or transform the data in any way. However, to design a system that successfully handles large data and maximizes the user’s SA, system designers must venture into aggregation methods that not only attempt to group data but also transform it into higher levels of abstraction. Advantages. Aggregation can help visual analytics applications survive and perform well in massive data environments. SA can be obtained by users who understand when aggregation is required, what fields are best to aggregate, and how best to perform the aggregation. Disadvantages. If the visual analytics application merely provides the opportunity for users to aggregate fields as they desire, less experienced users will perform data requests that will overload the target system. SA will likely only be obtained from 1 The term “gracefully” in this context is used to denote the need to automatically detect and take appropriate aggregation action when large result set data requests are being made that would result in system degradation.
69
expert users who have a thorough understanding of what fields in his repository are of high cardinality and need to be aggregated in order to keep the system in a useable state. Thus, the user must have an excellent grasp of the data itself. Expert users may also recognize the simultaneous request of many low to medium cardinality fields may also require aggregation on certain fields in order to keep the system functional. The underlying problem is no safe guard exists for users of visual analytics systems that simply offer aggregation capabilities as a tool for users to embrace. Users who are not familiar with the collected data will very quickly find themselves in a situation of requesting more data than the system can handle. Situational Awareness. The aggregation methods outlined here have the ability to provide SA to those users who have an intimate understanding of the data and are savvy enough to know when to make use of the aggregation calculations. Without system logic that can automatically detect when such aggregation needs to take place, the system will quickly succumb to an unsuspecting data request that exceeds the target system’s capabilities. 4
SMART AGGREGATION
Two particular assumptions that many visual analytics applications make are: the end-user knows what they are looking for; and the end-user knows how and when to apply criteria to reduce the size of the result set from a given data request. Unfortunately, these very assumptions cause many of the applications to fail to gracefully handle massive data requests. Users of visual analytics systems often explore without really knowing what they are looking for within the data set. Indeed, this is one of the powers of information visualization – the ability to formulate and answer questions they did not anticipate [5]. This is especially true for analysts studying massive amounts of network traffic. For this reason, it is important for the data presentation system to provide the flexibility of arbitrary data requests. In order for a visual analytics system to provide the best SA and reduce the amount of data to display, aggregation algorithms need to focus on reducing the granularity of the data to present. That is, functionality needs to be developed that is capable of taking a request for detailed information, recognize when the result set of the request will be too much for the system (or user) to handle, and transform the request into a higher level summarized data request that is capable of still returning meaningful data to the user. Our term for this process is Smart Aggregation. Specifically, the Smart Aggregation approach we present here performs the following: (1) Determine if aggregation is required; (2) Select candidate fields to aggregate, based on the cardinality of the field data and the user-specified field ranking; (3) Choose an appropriate aggregation function to apply to each candidate field based upon the computed cardinality reduction factor and field calculation rankings; (4) Replace original candidate field requests with the new field request that includes the computed aggregation calculation; (5) Perform a cluster query that only retrieves distinct field combinations from the repository with an associated count of how many times that combination exists in the data set for the current set of criteria Before stepping through a data request, we will present some of the underlying concepts and functions used in Smart Aggregation. 4.1 Data Transformation Aggregation Functions One way to transform the data into higher levels of abstraction is by applying cardinality reducing functions to the requested fields. A sample of standard SQL data transformation functions and how they can be used are described below. General (Is Null). The Is Null function will reduce any single field’s set of results down to two rows – either 0 (false) if the
70
column value is present or 1 (true) if the column value is not present for any given row. Although this provides great reduction in data, the outcome of knowing whether data exists or not may prove to be of little use to the user. String Functions (Upper, Lower, Trim). Although the string functions may not appear to have cardinality reduction capabilities, they are able to reduce row counts if the underlying data was entered with various casing or with trailing spaces. These functions would be considered to be low cardinality reducing functions unless the underlying data was consistently added with various casing and no normalization has taken place. Integer Functions (Count, Min, Max, Sum, Avg, etc.). These calculations are all considered to be high cardinality reducing calculations since they all produce a single value regardless of how many rows of data they are applied to. Care should be taken on the use of these functions since they may aggregate data to a level that has little benefit to the user. (e.g., the field destination port of network traffic data that has any one of these functions placed on it provides the analyst with no useful analytical insight.) Date Functions (Name, Year, Quarter, Month [number], Month Name, Week of Year, Week of Month, Day of Year, Day of Month, Day of Week [number], etc.). Since “raw” date time fields are typically of high cardinality, functions to help summarize the data for these fields can be very beneficial. There are many functions that can be placed on date time fields ranging from high cardinality reducing functions such as Quarter or Day of Week (where data will be reduced to a maximum of 4 or 7 rows respectively regardless of row count) to lower cardinality reducing functions such as Day of Year Truncation (where data will be reduced to a maximum of 365 rows regardless of row count). 4.2 Regular Expression Field Binning In order to provide the best possible SA to a user, a system designed to deal with massive data should provide a way for the user to help configure how fields should be aggregated. Giving this control to the user allows him to have full control over how the underlying data is grouped when aggregation needs to take place. Providing an easy to use user interface that makes use of regular expressions (definition of a pattern that describes a set of values) is a very powerful way to offer the capability of users defining their own aggregation groupings. For example, there are 65,536 possible destination ports in TCP or UDP computer network traffic; a system could allow an analyst to define his own port groupings. Analysts may group the destination ports in just a few bins, such as ports 0–1023 (the “well known ports”), 1024– 49,151 (“registered ports”), and 49,152–65,535 (“dynamic ports”). This coarse binning could be augmented by also grouping common ports based upon what they are used for; such as grouping ports 80, 443, and 8080 (web traffic) together and ports 20 and 21 (FTP traffic) together. Obviously, the user of regular expressions enables much more complex binning options. 4.3 Targeting High Cardinality Fields One important concept designers of a visual analytics system dealing with massive data need to keep in mind is no matter how much aggregation is performed, if the highest cardinality fields are not properly aggregated, aggregating lower cardinality fields will be ineffective and waste system resources. For instance, if a data request is made for three fields: Date, Source, and Bytes, where Date is the date/time field of when the record was added to the database, Source is the source IP address, and Bytes is the number of bytes that were transferred from the Source IP. Table 1shows a sample of what the original data might look like.
Table 1. Original data with no aggregation
Date 2/12/07 14:05:21 2/12/07 14:05:22 2/12/07 14:05:23 2/12/07 14:05:24 2/12/07 14:05:25 2/12/07 14:05:26
Source 192.19.20.1 192.19.25.123 192.29.201.4 200.20.1.231 200.18.20.5 192.19.25.11
Bytes 512 331 200 679 64 128
If high cardinality reduction aggregation was placed only on Source and Bytes such that only the first octet of the Source IP is requested and the maximum value of the Bytes was requested (as shown in Table 2), the returned row count will likely be exactly what it was prior to the aggregation. The reason for this is the highest cardinality field of Date had no aggregation imposed on it. Table 2. Aggregation on source and bytes
Date 2/12/07 14:05:21 2/12/07 14:05:22 2/12/07 14:05:23 2/12/07 14:05:24 2/12/07 14:05:25 2/12/07 14:05:26
Source (Octet A) 192 192 192 200 200 192
Bytes (MAX) 512 331 200 679 64 128
Without imposing aggregation on the highest cardinality field, aggregation imposed on the other fields will provide little benefit to reducing the actual number of records returning from the request. However, aggregating on the Date field, such as by Day of Week, as shown in Table 3, does reduce the number of rows returned. Table 3. Aggregation on all fields
Date (Day of Week) Monday Monday
Source (Octet A) 192 200
Bytes (MAX) 512 679
4.4 Analysis of Data Request To understand how Smart Aggregation works, we will step through a data request that passes through the Smart Aggregator. The Smart Aggregator’s role is to determine how much data from the repository is being requested and then compare that value against a configurable maximum data threshold value. To achieve this, the Smart Aggregator performs a count query against the repository to obtain: (1) a total row count that will be returned, and (2) a count of the distinct values for every column that the original query would be selecting. The Smart Aggregator stores in an XML metadata file a Byte Cost value for each defined field. This is determined based on the data type of the field. For example, Boolean fields have a byte cost of 1 and Integer fields a cost of 4. String byte costs are based upon an estimation of the average length of data to be stored for that column. The Smart Aggregator determines a row Byte Cost value by summing up the byte costs for all fields involved in the Select portion of the query and then multiplies the row Byte Cost by the total row count to obtain the potential byte size of the data that would be returned if the “real” query was executed. If this potential byte size is greater than the configured maximum data threshold value, the Smart Aggregator performs the following steps: 1. Check the cardinality ratio for each column. The cardinality ratio is the number of distinct values divided by the actual row count. If the cardinality ratio is found to be
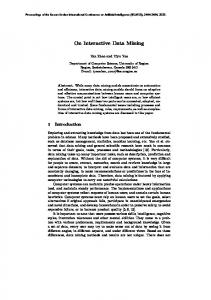
higher than the configured maximum cardinality ratio threshold, then the field is aggregated regardless of what aggregation policy is currently in place. Forcing the aggregation of the highest cardinality columns ensures the best possible chance of reducing the data load that is to be returned from the query. 2. Determine the appropriate level of aggregation. The Smart Aggregator compares the improvement ratio (Byte Cost divided by Maximum Byte Threshold) against various user configured improvement factors to determine if a LOW, MEDIUM, HIGH, TWO_ROW, or SINGLE_ROW cardinality reducing improvement is required. 3. Consult the aggregation policy. A policy is a collection of system-defined rules that use user configured parameters to drive the aggregation process. This policy is used to determine the aggregating reduction function that should be used for the specified field. For example, Source IP field with a HIGH cardinality reducing improvement request may be forced to use a function that truncates the Source IP at the first octet, whereas a LOW cardinality reducing improvement may force a truncation at the third octet. 4. Calculate new Byte Cost. Upon completion of aggregating the high cardinality columns, a byte improvement value is calculated and subtracted off of the original computed total byte cost. If the new byte cost is below the configured maximum data threshold, no more aggregation is required on this pass. If, however, more aggregation is still required, new fields are found to attempt aggregation from the user’s field ranking list and steps 2 and 3 are repeated until the estimated total byte cost falls below the configured maximum data threshold. 5. Repeat steps 1-4. Each of the previous steps are repeated with the new aggregated fields until the actual byte count is found to fall below the configured maximum data threshold. It is possible that on subsequent passes, fields that had cardinality reducing functions on them that were lower than SINGLE_ROW strength, will be re-evaluated and forced to have higher cardinality reducing functions placed on them. The intelligent aggregation significantly reduces the returned data to a manageable level. All visualization views that were configured with fields tagged to use the Smart Aggregator have their configurations replaced with the aggregated form of the field. This provides the user with what may be a higher-level view of the data than initially intended, but with the benefit of ensuring that that the limited system resources are not used up. The user can then interactively filter the data, zoom into (drill-into) the data as needed, or revise their original query. 4.5 Implementation The Smart Aggregation concept described in this paper was implemented in a visual analytics system for the information assurance (IA) domain, VIAssist, shown in Figure 1. IA analysts deal with a vast amount of multidimensional data. VIAssist was designed to enhance the SA of IA analysts, specifically to: • Show the same data simultaneously in multiple ways to reveal patterns that would otherwise not have been detected to enhance the user’s SA; • Provide context for the area of focus by building a framework of views that can interactively be replaced or resized to keep views visible that are relevant to the analyst to help in maintaining SA; • Promote fast data manipulation through intuitive visual interaction mechanisms – while also providing access to
71
Figure 1. VIAssist visual analytic system showing linked visualization views and interaction mechanisms
Figure 2. Smart Aggregator user interface for defining the policy to use (left), and ranking preferred fields and calculations (right)
textual queries for advanced users – to allow a “glass box” understanding of the system necessary for SA. The concentration of system development was on the interface and data management frameworks and not on developing new visualization components. Rather, we currently utilize multiple proven, existing visualization components. Based upon the framework design, integration of new visualization components at a future date is a straightforward activity.
selects have a better chance of matching the user’s preferred functions, but if the user’s most preferred function rankings for each field tend to be of a high cardinality reducing strength, then it is possible that the Smart Aggregator will aggregate at a higher level than necessary.
4.5.1 Setting the Smart Aggregator Policy VIAssist gives the user control over how the Smart Aggregator chooses fields and functions for aggregation. The user interface for setting the Smart Aggregation policy, shown in Figure 2, allows the user to rank all of the available fields from most important to least important. The fields defined as most important will be aggregated last, unless the column cardinality for the given query is considered to be above the highest threshold. The user also has the opportunity to individually configure and rank the aggregation functions for each of the fields. This allows the user to determine the most preferred functions for a given field if smart aggregation needs to take place. All field calculations have a “cardinality reducing strength” associated with them stored in the metadata file that describes what tables, fields, joins, vendors, etc. are available to the system. Currently, the system has two implemented aggregation policies: Maximum Data Retrieval: the maximum data retrieval policy will use the user’s field rankings when determining which fields to aggregate and use the user’s rankings as a guide when determining what cardinality reducing function should be applied to the field. The policy is such that it will traverse the list of ranked functions for the current field being aggregated and use the first calculation that has a cardinality reducing function that matches the required field improvement computed by the system. Functions that were already attempted for this field will be skipped. If no functions are found that match the required field improvement, the required field improvement is increased to the next highest level and the process is repeated. User Function Rankings: the user function ranking policy operates in a similar fashion to the Max Data Retrieval policy. However, when determining what cardinality reducing function to use, this policy traverses the User Function Ranking list and will use the first cardinality reducing function that is equal to or higher than the required field improvement that was computed by the system. Using this policy, the functions that the Smart Aggregator
72
4.6 Enhancing Situational Awareness The Smart Aggregation data management strategy is capable of automatically detecting when a user data request is going to result in a result set that exceeds the target system’s capability. After detection, the Smart Aggregator consults an aggregation policy that makes use of user-configured preferences to determine which fields should be aggregated and how those fields should be aggregated. This approach prevents the user from potentially requesting too much data that the target system is unable to handle. It reduces the data presented to the user, making the overview of the data more understandable, while enabling users to zoom into their data. This approach enhances SA by allowing the user to readily see the big picture. Large data result sets without any aggregation can saturate the visualization display, making SA impossible. Take, for example, the screen shot displayed in Figure 3, which visualizes a data result set with no aggregation, as compared to Figure 4, which visualizes the same result set after having passed through the Smart Aggregator. In the former, it is impossible to glean a meaningful overview of the data; in the latter it is much clearer to determine an overview of the characteristics of the data. Further, the Smart Aggregation approach described in this paper permits users to follow Shneiderman’s Visual Information Seeking Mantra: Overview first, zoom and filter, then details-ondemand [6]. After gaining an overview, the user can interactively decrease the level of aggregation to zoom in and filter the data. This interactive drill in is shown in Figure 5, in which one of the branches of the tree have been de-aggregated to show the details of each individual data element. 4.7 Smart Aggregator in the Field As many computer network traffic analysts would attest, even attempting to analyze what is considered to be interesting is still too much data to process and visualize. As a result, many analysts still rely on scripting tools to look for specific “known” data, but have no way to effectively explore the data. Our recommendation is to take advantage of the scripting tools that analysts are familiar
Figure 3. Tree with no aggregation showing an IP address at the root with time, byte size bins, and destination port bins
Figure 4. The tree shown in Figure 3 after Smart Aggregation, reducing occlusion while enabling the user to see the big picture
with to do any preprocessing or data reduction, and insert that data into a data warehouse. This is the approach we took in a field trial of VIAssist at a government facility. The users were network analysts who regularly examine massive amounts of NetFlow data. (NetFlows are aggregated records of network traffic between two computers [2].) The NetFlow data was input into a data warehouse optimized for data querying. The analysts who had used VIAssist with operational data appreciated the ability to detect and take action when requests were going to produce result sets that were too large for the system to handle. Analysts were also appreciative of the ability to produce result sets of higher data resolution when criteria is automatically appended to the data request upon the analyst drilling-in to data items of interest. The capability of allowing users to define their own aggregation bins in addition to the capability to affect the Smart Aggregation process through field and aggregation function ranking proved to be important factors in analysts gaining SA of the data being analyzed.
value and because a high improvement is needed, an IP truncation at octet A is required. Before performing another count query, the Smart Aggregator determines if additional fields need to be aggregated on this pass by subtracting off the total number of bytes that would be saved if the field that was just flagged for aggregation was reduced down to a single row. This estimation allows the system to quickly determine that more aggregation needs to take place before approaching system-tolerable limits. The aggregation policy determines the next field selected for aggregation is the Start Time field. Based upon the determination that a high system improvement is still required, the highest ranked high cardinality reducing function Day-of-week is selected. The Smart Aggregator once again determines that more aggregation needs to be performed during this pass and consults the aggregation policy for the next lowest ranked field to be aggregated. Using the same process as above, the system selects the Bytes field for aggregation, chooses a user-defined binning function, and repeats the process once more, selecting Destination Port also with a userdefined binning function. At this point, the system determines it might have done enough aggregation and allows another set of count queries to take place. A new count query is generated where it is determined more aggregation is still required (see Table 5 for aggregation pass results).
4.8
Smart Aggregation Example
A novice IA analyst decides to use VIAssist to analyze a small set (two million rows) of NetFlow data collected over a single hour. After loading the data into VIAssist’s visualization repository, the analyst decides to configure a workspace of views to show Source IP, Destination IP, Destination Port, Start Time, Duration, and number of Bytes transferred. The analyst can see there are 2 million records in the main table of the database since it is displayed at the top-left corner of the application window. The novice analyst pays no attention to the record count and decides to perform a full data fetch from the repository without supplying any criteria. However, the Smart Aggregator is able to detect data overload situations by performing a pre-count query for the desired fields (see Table 4). Table 4. Distinct field counts of 2 million row table
Src IP
Dst IP
119,440
728,491
Dst Port 57,189
Start Time 3,169
Duration 1,220
Bytes 24,759
Total Rows 2 Mil
A distinct row count involving the requested fields returns 1,942,791 and an estimated byte cost of 68 bytes/row. The system determines aggregation that will result in a high system improvement is required. Field distinct value counts are checked to see if any field’s cardinality exceeds the high cardinality threshold ratio. The Destination IP field was found to exceed this
Table 5. Distinct field counts for each aggregation pass
Src IP 1 2
119,440 131
Dst IP 30 30
Dst Port 3 3
Start Time 1 1
Duration 1220 6
Byt es 3 3
Total Rows 459,461 32,970
The Smart Aggregator determines that a high improvement is still required and finds two new fields for aggregation (Source IP and Duration). The function of truncation at octet A is applied to Source IP and a user-defined binning is applied to duration. The system estimates it has made enough improvements and performs another count query taking into account the new aggregation functions, which returns a result within tolerable limits. The full query to extract the data from the repository is submitted and the results are displayed upon query completion. 4.9
Costs of Performing Smart Aggregation
As is the case with all data reduction schemes, there are costs associated with methods used to perform data reduction and the
73
system to find the optimal level of aggregation. Repositories that are optimized for data insertion and not querying may experience degradation in performance. Smart Aggregation balances the need for data reduction and situational awareness. Users do not need to know the details of the data, but have the ability to tweak the policy that sets how the aggregation takes place. The system is prevented from overloading available resources, and users are prevented from overloading their perceptual capabilities and are able to better understand the big picture required for SA. ACKNOWLEDGEMENTS
Figure 5. Tree with Smart Aggregation after drilling in to one of the branches of interest
Smart Aggregation technique is no exception. The main cost of using the Smart Aggregation approach is the time required to iteratively run count queries against the target repository. Other factors that affect the performance of the Smart Aggregation count queries include: • Number of fields involved in the database request – more fields typically equates to more time required. • Aggregation calculations that are placed on fields selected for aggregation – some functions may cause the data repository to perform an expensive operation for every record or cause a situation where an index can not be used to quickly retrieve the desired set of records. This situation can result in negatively impacting the query completion time. • Order of aggregation function rankings for each field can negatively impact performance by forcing more passes under conditions when functions that have less actual cardinality reducing capabilities are ranked higher than functions that are considered to have the same theoretical cardinality reducing strength. • Likewise, order of field ranking could also cause additional passes to be taken by the Smart Aggregator when high cardinality (but lower than the max configured threshold) fields are ranked higher than lower cardinality fields. We believe that this is a cost that most users would be willing to bear (if given the choice) since the system is attempting to provide the user with the highest fidelity of data for those fields that are most important to the user.
The development of VIAssist was sponsored by the US Department of Defense (DoD) under Contract No. F30602-03-C0260, with the Air Force Research Laboratory (AFRL) as the contracting agency. The authors would like to acknowledge the continuous beneficial guidance during VIAssist development offered by Dr. Kirsten Whitley of the US DoD and Mr. Walt Tirenin of the AFRL in Rome, NY. The views and conclusions contained in the document are those of the authors, and should not be interpreted as representing the official policies, either expressed or implied of AFRL, DoD, or the US Government. VIAssist contains Star Tree® and Table Lens™ from Inxight Software, Inc. (Copyright © 1996-2005. All rights reserved. www.inxight.com), and views from ADVIZOR Solutions (© 2006. All rights reserved. www.advizorsolutions.com). REFERENCE [1]
[2] [3]
[4]
[5]
[6]
[7]
5
CONCLUSION
In the face of massive data sets now common in many domains, the Smart Aggregator ensures a visual analytics system always remains functional. Users have the ability to rank fields in order of importance and configure and rank aggregation functions in order of preference. By providing these user configurable options, users are involved in the interactive data management process and as such gain a firm understanding of how the system functions. However, this user control is not necessary; the user does not need to know details of the underlying data they wish to explore. The configurable policies for individual fields ensure that the aggregation is not only done intelligently, but also according to the user’s needs. With a firm understanding of how the system functions comes increased confidence in the visual analytics system that equates to improved SA for the user. One potential drawback of Smart Aggregation is that multiple count queries attempts will likely take place in order for the
74
[8]
[9]
Robert Amar and John Stasko, “A Knowledge Task-Based Framework for Design and Evaluation of Information Visualizations”, Proc. of the IEEE Symposium on Information Visualization, pp. 143-149, 2004. Cisco Systems NetFlow Services Export Version 9, http://www.ietf.org/rfc/rfc3954.txt, 2004. Mica R. Endsley, “Theoretical Underpinnings of Situational Awareness: A Critical Review”, Situation Awareness Analysis and Measurement: Analysis and Measurement, Mica R. Endsley and Daniel J. Garland, Lawrence Erlbaum Associates, Mawah, NJ, 2000. Mica R. Endsley, Betty Bolte, and Debra Jones, “Designing For Situation Awareness: An Approach to User-Centered Design”, Taylor and Francis New York, NY, pp. 33-34, 2003 Catherine Plaisant, “The Challenge of Information Visualization Evaluation”, Proc. of the IEEE Conference on Advanced Visual Interfaces, pp. 109-116, 2004. Ben Shneiderman, “The Eyes have It: A Task by Data Type Taxonomy for Information Visualizations”, Proc. of the IEEE Symposium on Visual Languages, pp. 336-343, 1996. E. Wes Bethel, et al., “Accelerating Network Traffic Analytics Using Query-Driven Visualization”, Proc. of the IEEE Symposium on Visual Analytics Science and Technology, pp. 115-122, 2006 Kurt Stockinger, et al., “Network Traffic Analysis With Query Driven Visualization SC 2005 HPC Analytics Results”, SC05 Conference Proceedings, 2005. Kurt Stockinger, John Shalf, Kesheng Wu, and E. Wes Bethel, “Query-Driven Visualization of Large Data Sets”, Proc. of the IEEE Visualization 2005, pp. 157-174, 2005