JOURNAL OF APPLIED PHYSICS 97, 093707 共2005兲
Band diagram of the AlF3 / SiO2 / Si system D. König,a兲 R. Scholz, and D. R. T. Zahn Institut für Physik, Technische Universität Chemnitz, D-09107 Chemnitz, Germany
G. Ebest Professur Elektronische Bauelemente, Fakultät Elektrotechnik, Technische Universität Chemnitz, D-09107 Chemnitz, Germany
共Received 22 November 2004; accepted 17 February 2005; published online 19 April 2005兲 The material system aluminum fluoride-silicon oxide-silicon 共AlF3 / SiO2 / Si兲 can localize a high density of fixed negative charges in fluorine 共F兲 vacancies within AlF3, serving as a source for a strong drift field. This assignment is corroborated by a determination of the stoichiometry with Rutherford backscattering techniques and the transient response of the negatively charged defects with deep level transient spectroscopy. From the density-functional calculations of stoichiometric and understoichiometric AlF3, we deduce a microscopic picture where the energetic eigenstates of the the singly and doubly occupied F vacancies surround the Fermi energy. The lineup of the band edges of the system AlF3 / SiO2 / Si is determined by self-consistent electrostatic calculations including local charges, resulting in excellent agreement with the energetics deduced from the transient response of the charged defects. © 2005 American Institute of Physics. 关DOI: 10.1063/1.1886909兴 I. INTRODUCTION
For field-effect applications at Si-based solar cells, insulating surface layers with a fixed positive charge are widely used, employing silicon oxynitride 共SiOxN兲 layers and silicon nitride 共Si3N4兲–SiO2 layer compounds.1 A negative fixed charge can be created by depositing alumina 共Al2O3兲 onto oxidized Si.2 This material system has been used as a drift field source on p-Si solar cells for rear surface passivation.3 Moreover, general concepts of insulating layer compounds with a fixed negative charge on semiconducting substrates have been introduced.4 The material system AlF3 / SiO2 / Si is able to localize a fixed negative charge exceeding the one in Al2O3, but its electronic properties have not been investigated in great detail. Figure 1 shows both the layer arrangement and the charge distribution between Si and the surface layers under investigation. Recently, the feasibility of a fixed negative charge with AlF3 coatings was demonstrated on p-inversion layer solar cells.5 A substantial anion 共fluorine - F兲 deficiency within AlF3 close to the interface AlF3 / SiO2 results in F vacancies occupied by a single intrinsic electron. A small portion of the F vacancies is able to localize an additional 共extrinsic兲 electron originating from Si. The thermal equilibrium between Si and AlF3 is established by an electron-tunneling current through the SiO2 barrier. The negatively charged vacancies result in a high density of fixed negative charges per unit area 䊐QAlF3. In the present work we analyze the band diagram of the material system AlF3 / SiO2 / Si. Details of the preparation technique and measurement results are discussed in Sec. II. This section is concluded by a summary of the experimental evidence for doubly occupied F vacancies presenting the a兲
Electronic mail:
[email protected]
0021-8979/2005/97共9兲/093707/9/$22.50
fixed negative charge. In Sec. III we investigate the electronic band gap of AlF3 as a function of F deficiency 共AlFx兲 within the framework of density-functional 共DF兲 calculations of aperiodic approximants. In Sec. IV we derive the selfconsistent band profile from the solution of the Poisson equation by assuming thermodynamic equilibrium between the different layers. The paper is concluded in Sec. V. II. EXPERIMENT A. Sample preparation
AlF3 / SiO2 surface coatings were prepared on n- and p-type crystalline Si substrates with 共001兲 surface orientation. For the calculation of the band diagram presented in the following, we consider p-Si substrates. After cleaning the Si wafers by the Radio Corporation of America 共RCA兲 process,6,7 the remaining native SiO2 layer was removed by an additional HF dip, immediately followed by rapid thermal oxidation 共RTO兲. The RTO was carried out in a Heatpulse 80 system resulting in SiO2 thicknesses between dSiO2 = 1.3 and 3.6 nm. Other samples were treated by a conventional furnace oxidation after the RCA cleaning, yielding a thermal SiO2 with thicknesses of dSiO2 = 9 nm and dSiO2 = 18 nm. A number of samples were passivated in hydrogen 共H2兲 at T = 550 ° C for t = 10 min with a slow cool down in nitrogen 共N2兲. On the front surface of the oxidized
FIG. 1. Physical structure and distribution of fixed charges in the material system AlF3 / SiO2 / Si. 97, 093707-1
© 2005 American Institute of Physics
Downloaded 21 Apr 2005 to 134.109.68.83. Redistribution subject to AIP license or copyright, see http://jap.aip.org/jap/copyright.jsp
093707-2
J. Appl. Phys. 97, 093707 共2005兲
König et al.
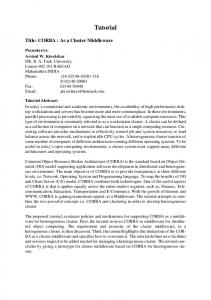
FIG. 2. 共Color online兲 Typical average values of 䊐Qeff from 49-point HgCV wafer maps of different oxide thicknesses 共dSiO2 = 1.5-nm RTO, dSiO2 = 3.6-nm RTO, and dSiO2 = 9-nm furnace oxide兲 and an AlF3 layer thickness of dAlF3 = 10 nm. The error bars indicate the standard deviation. The lines are a guide to the eye.
samples an AlF3 layer was deposited by a physical vapor deposition 共PVD兲 process in a Balzers BAK 640 system at a base pressure of p = 2–7 Ã 10−6 mbar and a substrate temperature of T = 250 ° C. The target material was ultraclean AlF3 共Merck, 99.9999%兲 as used for the preparation of VUV range optics. A preevaporation of the target was carried out with the shutter closed prior to the actual deposition process in order to remove any possible residual impurities. AlF3 layers with thicknesses of dAlF3 = 10, 20, 50, 60, 120, and 355 nm were deposited. For further details of the preparation we refer to Refs. 5,8,9. B. Electric and electronic characterizations
The density of fixed negative charges was measured by mercury probe capacitance–voltage 共Hg-CV兲 49-point wafer maps using an SSM 495 setup. For samples without AlF3 layer the positive fixed charge per unit area of the RTO SiO2 layer was determined as 䊐QSiO2 = 7–8 Ã 1011 cm−2. Passivation in hydrogen 共H2兲 reduced it to 䊐QSiO2 = 3 Ã 1011 cm−2. The unpassivated thermal SiO2 has a fixed positive charge per unit area of 䊐QSiO2 = 6 Ã 1011 cm−2 which decreased to 䊐QSiO2 = 2 Ã 1011 cm−2 by H2 passivation. For samples with AlF3 layer the effective charge density per unit area of the insulation layer compound referring to the SiO2 / Si interface is 䊐Qeff = 䊐QSiO2 + 䊐QAlF3 .
共1兲
The average values of mentioned wafer maps are in the range of 䊐Qeff = −2– − 4 Ã 1012 cm−2, with peak values reaching 䊐Qeff = −6.9Ã 1012 cm−2.8,10–12 Higher values are achieved for thinner SiO2 layers. The corresponding value for the fixed negative charge density per unit area was determined to be 䊐QAlF3 = −2.5– − 5 Ã 1012 cm−2 with peak values reaching 䊐QAlF3 = −7.5Ã 1012 cm−2. Figure 2 shows typical values of 䊐Qeff as a function of time for several layer thicknesses dSiO2 and dAlF3. In order to assess the potential for an application of the structure in solar cells the long-term stability has been investigated as follows. Exposing the structure to solar irradiation increases the effective fixed charge from 䊐Qeff = −3.5Ã 1012 cm−2 by roughly 40% to 䊐Qeff = −4.8Ã 1012 cm−2 due to an increased electron-tunneling current from Si through the SiO2 barrier.8 Tempering in complete darkness under ambient atmosphere at a temperature of
FIG. 3. Isothermal DLTS scans at T = 300 K as a function of the pulse voltage V p and characteristic time constant with Vbias = 2.5 V and t p = 1 ms. Negatively charged F vacancies being located at lower energies are ionized with increasing negative V p. The respective energetic shift ⌬E at the interface AlF3 / SiO2 due to Vbias and V p is given at the right-hand side, referring to zero bias during the pulse 共i.e., Vbias − V p = 0兲.
T = 200 ° C for 24 h leads to similar results.10 The stability of the fixed negative charge density 䊐QAlF3 against electric fields was tested by corona charging with a surface charge per unit area of 䊐Qs = −1.8Ã 1012 cm−2 共field strength equivalent F = −1 Ã 106 V cm−1兲 for t = 2 h in air and turned out to be excellent since there was no detectable change in 䊐Qeff.10 In all cases the density of trap states at the interface Si/ SiO2 was not altered. Regarding the electronic states in the vicinity of the Fermi energy we have investigated the charge-transfer dynamics by deep level transient spectroscopy 共DLTS兲 measurements 13–15 on a sample with dSiO2 = 3.2 nm and dAlF3 = 20 nm. The top electrodes consist of gold evaporated onto the AlF3 layer. With the application of Vbias = 2.5 V, the Si substrate is driven into n inversion, leading to an energetic shift of the respective states within AlF3 at the interface AlF3 / SiO2 of ⌬E = 1.07 eV downwards. As a result, some singly occupied F vacancies are doubly occupied by electrons tunneling from Si through the SiO2 layer into the AlF3 layer. For this process the energetic positions of the AlF3 band edges are irrelevant due to the large AlF3 band gap. By applying a negative bias pulse of V p = −0.5– − 4.5 V with a duration of t p = 1 ms, the states at the interface AlF3 / SiO2 experience a smaller shift of ⌬E = 0.77– − 0.34 eV with respect to EF during the bias pulse, resulting in a discharge of the states lifted above the Fermi level during the bias pulse. The clock cycle of the pulse pattern was tclk = 64 ms, allowing for a 63-ms sample window following every bias pulse. Figure 3 shows isothermal DLTS scans at T = 300 K for different pulse voltages V p. For the slow trapping dynamics of the F vacancies, ⬎ 3 ms, it is clearly seen that for pulse voltages of V p 艋 −2 V there is no increase in charge transfer. For V p 艌 −0.5 V hardly any transferred charge ⌬Q occurs. With the corresponding energetic shifts of ⌬E = + 0.05 eV and ⌬E = + 0.43 eV, respectively, we obtain the lower and upper energetic limits of the defect subband at the interface AlF3 / SiO2. This transient negative charge is assigned to F vacancies being occupied with one intrinsic and one extrinsic electrons. At V p = −1.0 V or ⌬E = 0.43 eV we see that ⌬Q
Downloaded 21 Apr 2005 to 134.109.68.83. Redistribution subject to AIP license or copyright, see http://jap.aip.org/jap/copyright.jsp
093707-3
König et al.
J. Appl. Phys. 97, 093707 共2005兲
FIG. 4. UPS spectrum of a sample with dSiO2 = 1.5 nm and dAlF3 = 10 nm, yielding the valence-band DOS of AlF3 together with the valence-band DOS ¯ c bulk phase of AlF . at the ⌫ point calculated with DF methods for the R3 3 Subtraction of the secondary electron background was carried out by a polynomial fit 关Shirley model 共Ref. 16兲兴.
reaches a significant amount; at V p = −1.5 V or ⌬E = 0.18 eV the transferred charge density ⌬Q has reached around 90% of its maximum value. These results define a range of EF + 0.18 eV to EF + 0.43 eV for the energetic position of the doubly occupied F vacancies agreeing reasonably well with EF + 0.19 eV to EF + 0.22 eV determined Hg-CV and Rutherford backscattering spectroscopy 共RBS兲 data 共see below兲. There are two maxima in the charge transferred back to the F vacancies with characteristic time constants 1 = 5.3Ã 10−2 s and 2 ⬇ 1.7± 0.5 s. The larger time constant exceeds the time scale of the measurement; therefore, we based its estimate on the curvature of ⌬Q共兲, resulting in an uncertainty of 2 of ⌬t ⬇ 0.5 s. As there are two zones with a high density of F vacancies 共see Fig. 6兲 1 is attributed to the charge transfer into F vacancies being located immediately at the interface AlF3 / SiO2, while 2 is assigned to the combination of the charge-transfer process and the hopping conduction of electrons through AlF3 for occupying F vacancies in the AlFx zone at the surface. This assumption is supported by the fact that the amount of transferred charge at 2 is significantly higher, despite a lower density of F vacancies at the AlF3 surface. Applying a positive bias to the top electrode induces a negative tilt of the band structure, resulting in a strongly increased occupation probability of the F vacancies at the AlF3 surface. The density of states 共DOS兲 of the AlF3 valence band was measured by ultraviolet photoemission spectroscopy8 共UPS兲 on a sample with an AlF3 layer of dAlF3 = 10 nm. For the excitation the He I line 共21.2 eV兲 was employed; the escape depth of excited electrons is of the order of 6 Å 共i.e., only the DOS at the AlF3 surface can be measured兲. A F deficiency does exist not only at the interface AlF3 / SiO2 but also at the AlF3 surface. Therefore, the surface sensitive UPS results can be used to evaluate the valence-band DOS at the interface AlF3 / SiO2. Figure 4 shows the measured valenceband DOS of a sample with dSiO2 = 1.5 nm and dAlF3 = 10 nm together with the calculated valence-band DOS at ¯ c phase of the stoichiometric AlF . As the ⌫ point of the R3 3 the 2p states originate from F atoms they are a good indicator for a change of the valence-band DOS as a function of F deficiency.
FIG. 5. Low electron dose high-resolution TEM image of a sample with RTO, dSiO2 = 1.5 nm and AlF3 , dAlF3 = 355 nm.
In Fig. 4 we can see that the measured valence-band DOS is shifted to higher binding energies, indicating a significant F deficiency. Evaluation of the UPS data determines the position of the valence-band edge with respect to the vacuum energy to be EV共AlFx兲 = Evac − 11.5 eV.
C. Structural characterization
AlF3 deposited onto SiO2 consists of nanocrystallites embedded into an amorphous matrix.9,17 The crystallites con¯ c phase containing interlinked sist of a rhombohedral R3 18,19 AlF6 octahedra. High-energy electron-diffraction 共HEED兲 measurements confirmed the hexagonal orientation of the AlF6 unit cells.8,9 The length of the bond Al–F is aAl-F = 1.8 Å,18 in agreement with extended x-ray-absorption fine structure 共EXAFS兲 measurements.8,20 The packing density of the AlF3 layers was determined by x-ray reflection 共XRR兲 measurements to be 98%. Furthermore, the morphology of the material system AlF3 / SiO2 / Si was investigated by transmission electron microscopy 共TEM兲. Exposing AlF3 to high-energy electron beams can induce a recrystallization of the AlF3 layer, falsifying its original partly amorphous structure.21 By careful testing, the dose of the electron beam was kept below the recrystallization limit, resulting in a decreased image quality. However, the original morphology of the AlF3 layer was thus preserved. The TEM characterization of a cross-section probe revealed AlF3 nanocrystallites with an extension of 4–9 nm. Figure 5 shows a high-resolution cross-section image of a sample with RTO of dSiO2 = 1.5 nm and dAlF3 = 355 nm recorded using a Philips CM-20 transmission electron microscope. The thickness of the interface SiO2 / Si was
Downloaded 21 Apr 2005 to 134.109.68.83. Redistribution subject to AIP license or copyright, see http://jap.aip.org/jap/copyright.jsp
093707-4
J. Appl. Phys. 97, 093707 共2005兲
König et al.
D. Experimental evidence for F vacancies presenting the negative charge
FIG. 6. Average atomic fraction of Al and F for a sample with a thickness of dAlF3 = 52 nm measured by inclined angle RBS at three different locations. The error bars indicate the standard deviation and the lines indicate the stoichiometric ratio of Al: F = 1 : 3.
4 Å, slightly larger than determined elsewhere.22 For the interface AlF3 / SiO2 we determined a thickness of about 3 Å corresponding to two bond lengths aAl-F. The atomic ratio Al:F was measured by inclined angle RBS,23 cf. Fig. 6. This characterization technique revealed a substantial F deficiency within dAlFx = 8 nm at the interface AlF3 / SiO2 with an average composition of AlFx , x ⬇ 2.3. At the AlF3 surface there exists another substoichiometric zone, but the F deficiency is not as pronounced as at the interface AlF3 / SiO2. Since the presence of F vacancies is a prerequisite for the negative fixed charge a split up of 䊐QAlF3 into a major fraction at the interface AlF3 / SiO2 and a minor fraction at the AlF3 surface occurs. For thin AlF3 layers with dAlF3 艋 20 nm there is an overlap of both substoichiometric zones, i.e., the entire AlF3 layer becomes substoichiometric. From the average substoichiometric phase AlFx with x ⬇ 2.3, the molar mass M AlF3 = 84 g mol−1 共Ref. 24兲 and the mass density %共AlF3兲 = 3 g cm−3 共Ref. 8兲 we can calculate the density of vacancies, yielding NF-vac = 1.5Ã 1022 cm−3. Integration over dAlFx = 8 nm results in a density of F vacancies per unit area of 䊐NF-vac = 1 Ã 1016 cm−2. The average probability of a F vacancy being negatively charged is given by
− = PF-vac
冏
䊐QAlF3 䊐NF-vac
冏
.
共2兲
As the density of F vacancies per unit area is much larger than the density of negative charges per unit area 䊐QAlF3, Fermi–Dirac statistics allows us to estimate the energy of the − F vacancy occupied with two electrons EF-vac . Using numer− ous samples we find an occupation probability of PF-vac − −4 = 2–6 Ã 10 , resulting in EF-vac − EF = 0.19–0.22 eV. These − determined by values are in reasonable agreement with EF-vac DLTS measurements discussed above and by the selfconsistent band profile derived in Sec. IV from the DF calculations in Sec. III. Further results of the sample characterization can be found in Refs. 5, 8–12, and 14.
A conventional AlF3 deposition delivers an almost balanced stoichiometry over the entire AlF3 layer. By modifying the deposition we are able to maximize the F deficiency especially at the interface AlF3 / SiO2. Trying to deposit magnesium fluoride 共MgF2兲 with a possibly large F deficiency on Si covered with 9-nm thermal SiO2 resulted in a MgF2 layer consisting of columnar nanocrystallites. This crystalline structure can only exist if there is a balanced ratio of Mg: F = 1 : 2. The observed stoichiometry of MgF2 corresponds well to the investigations of Saboya et al.25 The structure MgF2 / SiO2 / Si was characterized by Hg-CV and had an effective charge density 共average of 49-point wafer map兲 of 䊐Qeff = −3 Ã 1010 cm−2 which is two orders of magnitude below the value of the AlF3 samples evaluated in this work.8 From this observation we conclude that the presence of F vacancies is a mandatory prerequisite for a high density of fixed negative charges. AlF3 layers evaporated onto substrates with a temperature of T = 300 K possess a rather low packing density26,27 and are known to physisorb water 共H2O兲 molecules especially at the AlF3 surface.25 Compact AlF3 layers as presented in this work physisorb a much smaller amount of H2O molecules. Nevertheless no impact of H2O on the fixed negative charge was observed for the layers deposited at a base pressure of p = 2–7 Ã 10−6 mbar.8 Some samples were coated with AlF3 at an elevated deposition pressure of p = 1 Ã 10−3 mbar. In contrast with the samples presented in this work the packing density of AlF3 decreased to 84%.8 When measuring the effective fixed charge density a large hysteresis in the Hg-CV curves was detected, accounting for a high density of dipoles practically replacing the negative charge density observed at the samples presented in this work. This is very likely caused by a massive incorporation of H2O-related species presenting dipoles in these layers, thereby preventing the F vacancies from localizing an extrinsic electron originating from Si.8 In order to check for other species which might present a negative charge eight wafers with AlF3 layers were stored together with a reference sample 共Si with 9-nm thermal SiO2兲 in a wafer box for six months at room temperature. Hg-CV wafer maps carried out on the control wafer after six months did not show any deviation from the charge and trap state densities measured prior to this long-term test.8 Thus we can conclude that there is no chemical reaction within the AlF3 layer which would set free gaseous reaction products 共such as SiF4 or HF兲, thereby contaminating the control wafer. For thicker SiO2 layers there is a slower increase of the fixed negative charge density as a function of time compared to samples of the same batch with thinner SiO2 layers, cf. Fig. 2. This dependence demonstrates that there is a connection between the charge-up time of F vacancies and the thickness of the SiO2 layer. As mentioned earlier this gives strong evidence that electrons from Si tunnel through the SiO2 layer into F vacancies.
Downloaded 21 Apr 2005 to 134.109.68.83. Redistribution subject to AIP license or copyright, see http://jap.aip.org/jap/copyright.jsp
093707-5
König et al.
FIG. 7. 共Color online兲 HOMO of the Al12F34 cluster with F vacancy at the center of the cluster, calculated with the B3LYP functional in the 3-21G variational basis set using GAUSSIAN98. The large spheres present Al atoms and the small spheres present F atoms.
In summary, we found convincing evidence that the fixed negative charge is due to F vacancies which are negatively charged by electrons originating from Si. This assumption is also heavily supported by the theoretical investigations presented in Sec. III. III. DENSITY-FUNCTIONAL CALCULATIONS OF ALF3
The AlFx phase at the interface AlF3 / SiO2 consists of nanocrystallites embedded in an amorphous matrix 关see Fig. 2 and 共Refs. 8,9兲兴. Due to the polymorphism at room temperature already for the stoichiometric compound AlF3, we cannot cover substoichiometric variants of all the crystal phases. Instead, we concentrate on the high-temperature cubic phase 关transition temperature Tc ⬇ 452 ° C, 共Ref. 18兲兴 as the most simple microscopic model containing interlinked AlF6 octahedra where two adjacent aluminum atoms share a common fluorine atom. These model systems were investigated earlier with the DF software ABINIT.28 Despite delivering important results on the local charge distribution11 local-density approximation 共LDA兲 algorithms are known to underestimate the energetic position of the conduction-band edge EC and thus the band gap Egap of the supercell. In order to gain further insight into the energetics of electrons trapped in the anion vacancies, we have investigated finite approximants for a stoichiometric and a substoichiometric cubic aluminum fluoride bulk phase by the Becke 3 Lee–Yang–Parr 共B3LYP兲-mixed Hartree– Fock 共HF兲-DF approach.29,30 This method eliminates most of the errors of the band gap energy inherent in pure DF or pure HF calculations. A. Nonperiodic cubic Al12F34 and Al12F35 clusters
A nonperiodic cubic octahedral Al12F34 cluster was used for B3LYP calculations carried out with the GAUSSIAN98 software package.31 By comparing the variational basis sets 3-21G and 6-31G 共d兲, we conclude that the admixture of d-symmetric orbitals to the doubly occupied highest occupied molecular orbital 共HOMO兲 localized in the vacancy is quite small, and therefore the change of the variational basis does not have a significant influence on its energetic position. Figure 7 shows the HOMO at the anion vacancy of the Al12F34 cluster. The triangular bond geometry chosen for the two aluminum atoms on the C2 symmetry axis through the vacancy forces these atoms to build sp2 hybrids, avoiding therefore the formation of dangling bonds along the symme-
J. Appl. Phys. 97, 093707 共2005兲
FIG. 8. 共Color online兲 DOS of the Al30F88 cluster as a function of energy relative to Evac. The DOS belonging to atoms with a distance from the F vacancy of r ⬎ 2冑2d0 are called peripheral and the DOS belonging to atoms with a distance from the F vacancy of r 艋 2冑2d0 are assigned to the center of the cluster surrounding the F vacancy. The doubly occupied HOMO is localized in the F vacancy, cf. Fig. 7 for the same orbital in the smaller approximant.
try axis. For a T-shaped bond configuration of these aluminum atoms, the visualized HOMO state localized inside the vacancy would hybridize with dangling bonds consisting of Al sp hybrids along the axis. Even though this has no significant influence on the energetic position of the orbital shown, the interpretation of the trapped electron state as a bonding superposition of two aluminum sp hybrids pointing into the vacancy would be somewhat obscured. By comparing the Al12F34 cluster 共see Fig. 7兲 with an Al12F35 cluster where one of the two threefold coordinated Al atoms on the symmetry axis is replaced by a planar geometry with four neighboring F atoms forming 90° angles between the Al–F bonds, we obtain two similar clusters where the HOMO state for Al12F34 is occupied twice whereas in the Al12F35 cluster it contains only a single electron. As the B3LYP approach eliminates most of the energetic errors inherent in the local-density approximation or gradient-corrected density functionals, this comparison gives a reliable estimate for the electron-electron interaction if the HOMO is doubly occupied. With respect to the vacuum level, the HOMO of the Al12F34 cluster occurs at −4.55 eV below the vacuum level compared to −5.55 eV for the Al12F35 cluster. In slightly substoichiometric cubic aluminum fluoride, charge neutrality at zero temperature requires that the lower of these two energetic positions should be occupied with a single electron, whereas the high energetic cost of about 1 eV for double occupancy would be prohibitive. At finite temperature, the Fermi–Dirac distribution over these energetic levels deviates from these idealized occupation probabilities, as discussed in Sec. IV B for the self-consistent band bending due to the presence of additional external electrons close to the AlF3 / SiO2 interface. B. Nonperiodic cubic Al30F88 and Al30F89 clusters
For similarly constructed larger approximants of substoichiometric aluminum fluoride such as Al30F88 and Al30F89, the central region resembling the bulk phase becomes larger. Therefore, bulklike states in the central part of the finite cluster can easily be distinguished from surface states localized on F or Al atoms in the periphery. Figure 8 shows the density of states for an Al30F88 cluster. The electronic orbitals localized mainly on atoms within a sphere of radius r 艋 2冑2d0 produce a large gap between
Downloaded 21 Apr 2005 to 134.109.68.83. Redistribution subject to AIP license or copyright, see http://jap.aip.org/jap/copyright.jsp
093707-6
J. Appl. Phys. 97, 093707 共2005兲
König et al.
−10.19 and 5.47 eV with respect to the vacuum level, and three states inside the gap composed of electronic orbitals involving mainly the two Al atoms surrounding the vacancy. The lowest of these vacancy states at −4.57 eV corresponds to the HOMO, resembling the orbital visualized in Fig. 7 for the Al12F34 cluster. For the Al30F89 cluster, the energy of the singly occupied lowest vacancy state occurs at −5.67 eV. The slightly larger energetic cost of 1.1 eV for the double occupancy of this orbital is related to a better localization of the electron densities inside the vacancy with respect to the smaller approximants, resulting in a larger repulsive Coulomb energy. In summary, the DOS of stoichiometric and substoichiometric cubic octahedral AlF3 was computed by the B3LYP method for nonperiodic approximants and by the DF-LDA approach for a periodic supercell.11 Both methods lead to a similar electronic charge density and to an energetic position of the orbital localized in the F vacancy with respect to the valence-band edge depending on the electron occupation number in the F vacancy. IV. CALCULATION OF SELF-CONSISTENT BAND DIAGRAM A. Band lineups at interfaces
The band gap of SiO2 and its band offsets to Si have been determined with several techniques.32–38 On Si 共001兲 the experimentally determined valence-band offset and conduction-band offset are ⌬EV共SiO2 / Si兲 = 4.3 eV 共Refs. 32,37兲 and ⌬EC共SiO2 / Si兲 = 3.2 eV Refs. 33,34,36,38, respectively. Adding both band offsets to the band gap of Si Egap共Si, T = 300 K兲 = 1.12 eV 共Ref. 39兲 we obtain a band gap of Egap共SiO2兲 = 8.6 eV,8 in good agreement with experimental data for ultrathin SiO2.36,39 The band gap of the AlF3 on our samples is Egap = 10.8 eV.12,40 There are no published data available for the band offsets at the interface AlF3 / SiO2. With the UPS data discussed in Sec. II B we are able to determine the energetic position of the valence-band edge for the substoichiometric part of the AlF3 layer with respect to the vacuum level as EV = Evac − 11.5 eV. The concept of the charge neutrality level ECNL introduced by Tersoff41 and further evaluated by Mönch42 can be used for determining band offsets. However, the position of ECNL as a function of F substoichiometry cannot be determined exactly. For that reason the evaluation of the band offset with the charge neutrality level 共CNL兲 is used only as a test of plausibility. Robertson43 has calculated band offsets for oxides and semiconductors, determining ECNL for ionic solids by the energetic position of EC and EV weighted by the valence- and conduction-band DOS NC and NV, respectively. For ionic solids the band DOS is proportional to the ratio cation/anion.43 At the interface AlF3 / SiO2 we obtain NV / 共NC + NV兲 = 1.9/ 2.9 for the stoichiometry AlF1.9. Thus, the position of the CNL is ECNL共AlFx , x = 1.9兲 = EV + 0.66Egap = EV + 7.1 eV. For Si we use the value ECNL共Si兲 = EV + 0.2 eV determined by Robertson.43 As the band offsets from Si to SiO2 are already known we can calculate the band offsets at the interface AlF3 / SiO2, yielding
⌬EC共AlF3 / SiO2兲 = −0.4 eV and ⌬EV共AlF3 / SiO2兲 = 2.6 eV. The mismatch to the band-edge positions derived from UPS data is 0.6 eV, amounting to 5.6% of the band gap of AlF3. In summary, there is a reasonable agreement of the estimation of the band edges by the charge neutrality level with the experimental data obtained by UPS. Below we derive the self-consistent band bending within the AlF3 layer from an analytical calculation.
B. Self-consistent band bending at the AlFx / SiO2 interface
Close to the AlFx / SiO2 interface, the fluorine concentration is strongly reduced, resulting in a high concentration of vacancies. Based on the simplifying assumption that the stoichiometry is homogenously x ⬇ 2.3 in the region of interest, we demonstrate in the following that the major part of the negative charges related to the doubly occupied vacancies occurs within a few nanometers from the interface. In a bulk crystal with x ⬇ 2.3, the concentration of vacancies is given by NF-vac = 0.7/ 共3.6 Å兲3 = 1.5Ã 1022 cm−3. The Fermi energy is defined by the charge neutrality between the same amount of unoccupied and doubly occupied vacancies. For the corresponding energies, we use the values discussed in Sec. III B: E1 = −5.67 eV below Evac for the single occupied vacancy with a degeneracy of g1 = 2 related to the electron spin and E2 = −4.57 eV below Evac for the doubly occupied vacancy with degeneracy g2 = 1. Based on the Fermi–Dirac distribution p共E兲 =
1 , E − EF 1 + exp k BT
冉
冊
共3兲
the charge neutrality condition becomes g1关1 − p共E1兲兴 = g2 p共E2兲.
共4兲
Due to the large energy difference between the two levels involved, E2 − E1 Ⰷ kBT, this defines the Fermi energy slightly above the average energy, EF =
E1 + E2 ln 2 + kBT. 2 2
共5兲
The concentration of positively or negatively charged vacancies within the 共neutral兲 bulk phase becomes 关cf. Appendix A 共Ref. 44兲兴
冉
+ − = NF-vac = NF-vac冑2 exp N0 = NF-vac
= 1.2 Ã 1013 cm−3 .
E1 − E2 2kBT
冊 共6兲
Deviations from these bulk concentrations of oppositely charged vacancies can be treated in the Boltzmann limit
冋 册
− 共z兲 = N0 exp NF-vac
− V共z兲 k BT
Downloaded 21 Apr 2005 to 134.109.68.83. Redistribution subject to AIP license or copyright, see http://jap.aip.org/jap/copyright.jsp
093707-7
J. Appl. Phys. 97, 093707 共2005兲
König et al.
TABLE I. Measured values 共top group兲 and calculated quantities 共bottom group兲 for the band diagram depicted in Fig. 10.
FIG. 9. 共Color online兲 Numerical solution of the self-consistent potential V for a p-type Si wafer with RTO 共3.2 nm兲 and AlF3 共20 nm兲 layers, cf. Table I. The analytic solution of the Poisson equation is shown in gray 共see text兲. In AlF3, the energies of the singly and doubly occupied vacancies are indicated. In Si, the band edges are shown. The depth coordinate is aligned to the position of the interface AlF3 / SiO2 and the potential to the Fermi-level position at the Si bulk 共z → ⬁兲.
冋 册
+ NF-vac 共z兲 = N0 exp
+ V共z兲 k BT
共7兲
unless the self-consistent electron potential V共z兲 resulting from negatively charged doubly occupied vacancies approaches EF. For the simplifying boundary condition that the charge neutrality will be fulfilled for infinite distance from the region with the negative excess charge density, the Poisson equation
2 e2 − + 关N V共z兲 = − 共z兲 − NF-vac 共z兲兴 x2 0 F-vac
共8兲
can be solved analytically, cf. Appendix A and Fig. 9. The numerical solution for the correct boundary condition of vanishing electric field at the AlF3 surface deviates from this analytical solution by less than 1 meV at the AlF3 / SiO2 interface and by about 23 meV at the AlF3 surface, cf. Fig. 9. In both cases more than 80% of the accumulated negative charges are localized within 2 nm from the interface. The energetic position of the doubly charged vacancies at the interface AlF3 / SiO2 derived from the self-consistent calculation is E = EF + 0.15 eV. The difference of this value to the energetical position of the doubly charged vacancies determined by DLTS, cf. Sec. II B, is 0.03 eV. This difference is due to our assumption of a constant F substoichiometry over the entire AlF3 layer.
dSiO2 共nm兲
3.2
dAlF3 共nm兲 iso Vfb 共V兲 NA共cm−3兲 䊐QSiO2共cm−2兲 T 共K兲
20 3.2 1.42 2.3Ã 1016 8 Ã 1011 298
䊐Qeff共cm−2兲 AlF3 䊐QAlF3共cm−2兲 AlF3共dAlF3 = 20 nm兲 共eV兲 AlF3共dAlF3 → ⬁兲 共eV兲 SiO2共䊐QSiO2兲 共eV兲 0 sc 共eV兲 EF − EV at SiO2 / Si
−1.1Ã 1012 3.11 −1.9Ã 1012 −0.17 −0.39 +0.06 +0.131 2.47kBT
in the same batch with identical process parameters without depositing AlF3. Figure 10 shows the resulting band structure. A comparison of the sum of the energetic position of doubly occupied F vacancies derived from DLTS measurements and the calculated AlF3 with the computed value E2 in the substoichiometric Al30F88 bulk approximant shows an excellent agreement. The principle of negative charge builtup becomes clear from Fig. 10. Electrons from Si tunnel through SiO2 into the AlFx phase of the AlF3 layer. There they are localized in F vacancies. The large initial potential difference between the Fermi level EF共Si兲 at the interface SiO2 / Si and the Fermi level EF共AlFx兲 at the interface AlF3 / SiO2 provides the driving force for electron tunneling from Si into AlFx. Besides the presence of F vacancies the large potential difference is the second prerequisite necessary for creating a fixed negative charge. There are no electrons in negatively charged F vacancies tunneling back to unoccupied Si valence-band
C. Resulting band diagram
For having consistent input data the calculation of the band diagram was carried out on the sample characterized by DLTS. Due to the rather low negative effective charge density per unit area the band bending within Si could be calculated within the framework of Boltzmann statistics.45 Table I shows respective measured and calculated values. iso is the dielectric constant of the effective insulating layer 共consisting of AlF3 and SiO2兲, Vfb is the bias voltage necessary for flatband conditions in Si, AlF3 is the band bending of the AlF3 layer induced by 䊐QAlF3 , SiO2 is the 0 is the band bending within SiO2 induced by 䊐QSiO2, and sc band bending in Si at the interface SiO2 / Si for zero bias. For SiO2 we assume a dielectric constant of SiO2 = 3.9.45 䊐QSiO2 = 8 Ã 1011 cm−2 was measured at samples processed
FIG. 10. Right: band diagram of a sample with dSiO2 = 3.2 nm and dAlF3 = 20 nm showing the energetic position of negatively charged F vacancies 共䊐QAlF3兲 measured by DLTS. For an AlF3 bulk phase being several Debye lengths away from the interface AlF3 / SiO2 the position of the respective energy levels is depicted. Left: calculated energetic position of F vacancies in the AlF3 bulk phase clusters, see Sec. III B.
Downloaded 21 Apr 2005 to 134.109.68.83. Redistribution subject to AIP license or copyright, see http://jap.aip.org/jap/copyright.jsp
093707-8
J. Appl. Phys. 97, 093707 共2005兲
König et al.
states as this would introduce a gradient to the Fermi level over the SiO2 layer, resulting in a deviation from thermal equilibrium. With an increasing electron occupation number the energetic position of the F vacancy increases, leading to a relatively low occupation probability of doubly occupied sites. The resulting equilibrium density of F vacancies with two electrons therefore depends critically on the potential difference over the SiO2 layer as this induces an energetic shift referring to the Fermi level. For an increasing dSiO2 the potential over the SiO2 layer increases, leading to a decreasing occupation probability of doubly occupied F vacancies. This results in a decreasing negative charge 䊐QAlF3 and a less negative effective insulator charge 䊐Qeff for increasing dSiO2, cf. Fig. 2.
nitz for sample preparations, T. U. Kampen, Fritz-HaberInstitut of the Max-Planck-Gesellschaft 共MPG兲, Berlin, for EXAFS and UPS measurements, I. Thurzo, Institut für Physik, TU Chemnitz, for DLTS measurements, S. Schulze, Institut für Physik, TU Chemnitz, for TEM and HEED characterization, J. Heber, FHI IOF Jena, for fruitful discussions, S. Gemming for ABINIT calculations, and the Deutsche Forschungsgemeinschaft 共DFG兲 as well as the Stiftung zur Förderung der Deutschen Wissenschaft for financial support. APPENDIX A: SELF-CONSISTENT BAND BENDING
With the abbreviations qD =
V. CONCLUSION
We have calculated the band diagram of the material system aluminum fluoride-silicon oxide-silicon 共AlF3 / SiO2 / Si兲. The energetic position of the valence-band edge in substoichiometric AlF3 was derived from UPS measurements, serving as an estimate for the band offset to SiO2 together with the band gap determined earlier.40 DLTS measurements revealed the energetic position of F vacancies, each being occupied with one intrinsic and one extrinsic electron, the latter originating from Si. These doubly occupied F vacancies present a fixed negative charge density. Investigating the substoichiometic aluminum fluoride 共AlFx兲 phase we presented DF calculations of defect levels in nonperiodic approximants. The calculated electronic charge density at the F vacancy revealed a double-well potential. The energetic position of the doubly occupied F vacancy is significantly above the Fermi level, resulting in a small occupation probability. Nevertheless the very high density of F vacancies results in a large negative charge density per unit area. The calculated energetic positions of the doubly occupied F vacancies at the interface AlF3 / SiO2 are in good agreement with the results of the DLTS measurements. The negative fixed charge is built up by electrons which tunnel from Si through the SiO2 barrier into the AlF3 layer where they occupy F vacancies. For establishing a fixed negative charge the presence of F vacancies, the presence of movable extrinsic electrons in the vicinity of the AlFx phase, and a large energetic difference between free electrons in Si and the defect level within the AlFx phase are necessary. As a consequence of the latter, the density of fixed negative charges depends critically on the potential difference over the SiO2 layer. Our results deliver clear evidence that the fixed negative charge density is intimately related to the electronic states localized in the F vacancies. The energetic position of the AlF3 band edges has no influence on the fixed negative charge density due to their large energetic distance to the Fermi level. ACKNOWLEDGMENTS
The authors would like to thank R. Reich, K. Gottfried, and M. Plänitz, Zentrum für Mikrotechnologien, TU Chem-
冉
1 2N0e2 = D 0AlF3kBT
冊
1/2
共A1兲
,
for the inverse of the Debye screening length, s0 as determined by the electric-field strength F共0兲 within AlF3 at the interface AlF3 / SiO2, s0 = 2
冋 再 冋 册冎 册
1 eF共0兲 kBTqD 1− 1+ 4 kBTqD eF共0兲
2 1/2
,
共A2兲
and s = s0 exp共− qDz兲. − Nvac + Nvac
The densities vacancies and cies are given by
共A3兲
of negatively charged doubly occupied of positively charged unoccupied vacan-
− = N0 Nvac
共1 − s兲2 , 共1 + s兲2
共A4兲
+ = N0 Nvac
共1 + s兲2 , 共1 − s兲2
共A5兲
resulting in the following self-consistent electric-field strength F and electron potential V, F=−
4kBTqD s , e 共1 + s兲共1 − s兲
共A6兲
1+s . 1−s
共A7兲
冋 册
V = 2kBT ln
As the difference between the energetic position of the doubly occupied vacancies and the Fermi energy remains everywhere higher than 3kBT, the assumed Boltzmann limit in Eq. 共7兲 remains a reasonable approximation. 1
M. Grauvogl, A. G. Aberle, and R. Hezel, Appl. Phys. Lett. 69, 1462 共1996兲. 2 J. A. Aboaf, D. R. Kerr, and E. Bassous, J. Electrochem. Soc. 120, 1103 共1973兲. 3 R. Hezel and K. Jaeger, J. Electrochem. Soc. 136, 518 共1989兲. 4 D. König and G. Ebest, Solid-State Electron. 44, 111 共2000兲. 5 D. König, D. R. T. Zahn, R. Reich, K. Gottfried, and G. Ebest, Third WCPEC, Osaka Japan, 11–18 May 2003 共unpublished兲, paper 1P-D3-21. 6 W. Kern, RCA Rev. 31, 207 共1970兲. 7 W. Kern, RCA Rev. 31, 234 共1970兲. 8 D. König, Ph.D. thesis, Institute of Physics, Technical University of Chemnitz, Germany, 2004. 9 D. König, M. Rennau, M. Henker, and G. Ebest, Thin Solid Films 385,
Downloaded 21 Apr 2005 to 134.109.68.83. Redistribution subject to AIP license or copyright, see http://jap.aip.org/jap/copyright.jsp
093707-9
126 共2001兲. D. König, D. R. T. Zahn, and G. Ebest, Appl. Surf. Sci. 234, 222 共2004兲. 11 D. König, R. Scholz, S. Gemming, I. Thurzo, T. U. Kampen, D. R. T. Zahn, and G. Ebest, Physica E 共Amsterdam兲 14, 259 共2002兲. 12 D. König, and G. Ebest, Sol. Energy Mater. Sol. Cells 75, 335 共2003兲. 13 G. L. Miller, D. V. Lang, and L. C. Kimerling, Annu. Rev. Mater. Sci. 7, 377 共1977兲. 14 I. Thurzo, T. U. Kampen, D. R. T. Zahn, and D. König, Appl. Surf. Sci. 212–213, 753 共2003兲. 15 I. Thurzo and K. Gmucová, Rev. Sci. Instrum. 65, 2244 共1994兲. 16 A. Proctor and P. M. A. Sherwood, Anal. Chem. 54, 13 共1982兲. 17 W. Heitmann, Thin Solid Films 5, 61 共1970兲. 18 P. Daniel, A. Bulou, M. Rousseau, J. Nouet, J. L. Fourquet, M. Leblanc, and R. Burriel, J. Phys.: Condens. Matter 2, 5663 共1990兲. 19 B. K. Vainshtein, Fundamentals of Crystals, 2nd enlarged ed. 共Springer, Berlin, 1994兲, Vol. 1. 20 S. R. Elliot, The Physics and Chemistry of Solids 共Wiley, Chichester, 1998兲. 21 G. S. Chen, J. Vac. Sci. Technol. A 17, 403 共1999兲. 22 M. T. Tang, K. W. Evans-Lutterodt, M. L. Green, D. Brasen, K. Kirsch, L. Manchanda, G. S. Higashi, and T. Boone, Appl. Phys. Lett. 64, 748 共1994兲. 23 Measurements carried out by F. Schrempel, Institut für Festkörperphysik, Friedrich-Schiller-Universität Jena/Germany. 24 Table of Periodic Properties of the Elements 共Sargent-Welch, Skokie, 1980兲. 25 B. Saboya, J. F. Chemin, A. S. Barriére, Y. Danto, and J. Salardenne, J. Phys. D 8, 1008 共1975兲. 26 J. Kolbe, H. Kessler, T. Hofmann, F. Meyer, H. Schink, and D. Ristau, Proc. SPIE 1624, 221 共1991兲. 10
J. Appl. Phys. 97, 093707 共2005兲
König et al.
J. Kolbe and H. Schink, Proc. SPIE 1782, 435 共1992兲. X. Gonze et al., Comput. Mater. Sci. 25, 478 共2002兲; see also http:// www.abinit.org/ABINIT/infos/acknowledgements.htm 29 D. Becke, Phys. Rev. A 38, 3098 共1988兲. 30 C. Lee, W. Yang, and R. G. Parr, Phys. Rev. B 37, 785 共1988兲. 31 M. J. Frisch et al., GAUSSIAN98 共Revision A 5.2兲 共Gaussian Inc., Pittsburgh, PA, 1998兲. 32 A. A. Demkov and O. F. Sankey, Phys. Rev. Lett. 83, 2038 共1999兲. 33 V. V. Afanas’ev, M. Houssa, and A. Stesmans, Appl. Phys. Lett. 78, 3073 共2001兲. 34 R. Williams, Phys. Rev. 140, A569 共1965兲. 35 F. J. Himpsel, F. R. McFeely, A. Taleb-Ibrahimi, and J. A. Jarmoff, Phys. Rev. B 38, 6084 共1988兲. 36 J. L. Alay and M. Hirose, J. Appl. Phys. 81, 1606 共1997兲. 37 J. W. Keister, J. E. Rowe, J. J. Kolodziej, T. E. Madey, and G. Lucowsky, J. Vac. Sci. Technol. B 17, 1831 共1999兲. 38 M. Schulz, Surf. Sci. 132, 422 共1983兲. 39 K. W. Böer, Electrons and Other Particles in Bulk Semiconductors, Survey of Semiconductor Physics Vol. 1 共Van Nostrand Reinhold, New York, 1990兲. 40 J. Heber 共private communication兲. 41 J. Tersoff, Phys. Rev. B 30, 4874 共1984兲. 42 W. Mönch, Semiconductor Surfaces and Interfaces, 2nd ed. 共Springer, Berlin, 1995兲. 43 J. Robertson, J. Vac. Sci. Technol. B 18, 1785 共2000兲. 44 W. Shockley, Electrons and Holes in Semiconductors 共Van Nostrand, Toronto, 1950兲. 45 E. H. Nicollian and J. R. Brews, MOS (Metal Oxide Semiconductor) Physics and Technology 共Wiley-Interscience, New York, 1982兲. 27 28
Downloaded 21 Apr 2005 to 134.109.68.83. Redistribution subject to AIP license or copyright, see http://jap.aip.org/jap/copyright.jsp