Aug 9, 1985 - Given a specified DNA sequence and starting with an idealized conformation for the double helix (A-DNA or B-DNA), the dependence of ...
THEJOURNAL OF BIOLOGICAL CHEMISTRY 0 1986 by The American Society of Biological Chemists, Inc.
Vol. 261, No. 8,Issue of March 15, pp. 3700-3709 1986 Printed in ii.S.A.
Base Sequence, LocalHelix Structure, and Macroscopic Curvature of A-DNA andB-DNA* (Received for publication, August 9, 1985)
Chang-Shung Tung$and Stephen C. Harvey5 From the Departmentof Biochemistry, University of Alabama in Birmingham, Birmingham, Alabama 35294
Given a specified DNA sequence and starting with an idealized conformation for thedouble helix (A-DNA or B-DNA), the dependence of conformational energy on variations in the local geometryof the double helix can be examined by computermodeling. By averaging over all thermally accessible states, it is possible to determine 1) how the optimum local structure differs from the initial idealized conformation and 2) the energetic costs of small structural deformations. This paper describes sucha study. Tables are presented for the prediction of helix twist angles and base pair roll angles for both A-DNA and B-DNA when thesequence has been specified. Local deviations of helix parameters from their averagevalues can accumulateto produce a net curvatureof the molecule, a curvature that can be sharp enough to be experimentally detectable. As an independent check on the method, the calculationsprovidepredictionsforthelongitudinal compressibility (Young’s modulus) and the average torsional stiffness, both of which are in good agreement with experimental values. In examining the role of sequence-dependent variations in helix structure for the recognition of specific sequences by proteins, we have calculated the energy needed to deform the selfcomplementary hexanucleotide d(CAATTG) to match the local geometry of d(GAATTC), which is the sequence recognized by the EcoRI restrictionendonuclease. That energy would be sufficient to reduce the binding of the incorrect sequence to the protein by over 2 orders of magnitude relative to the correctsequence.
Among the features of DNA structure which proteins may use to recognize specific sequences are sequence-dependent variations in the local structure of the double helix. Fiber xray diffraction studies revealed differences in average helix parameters for DNAs of different compositions, but only in the last few years have single-crystal x-ray diffraction analyses revealed sequence-dependent helix parameters that differed from one base pair to thenext. These effects have been observed in both A-DNA (Shakked et al., 1981, 1983; Wang et al., 1982; Conner et al., 1982) and B-DNA (Wing et al., 1980; Dickerson and Drew, 1981; Fratini et aZ., 1982). During the same period, the helix twist angle of the double helix in solution has been shown to be sequence dependent, both by
* This research was supported by Grant PCM-81-18827 from the National Science Foundation. The costs of publication of this article were defrayed in part by the payment of page charges. This article must therefore be hereby marked “advertisement” in accordance with 18 U.S.C. Section 1734 solelyt o indicate this fact. $ Present address: T-DO, MSK710, Los Alamos National Laboratory, Los Alamos, NM 87545. To whom correspondence should be addressed.
the band shift method, which monitors the change in helix twist when short segments of known sequence are inserted into closed circular DNA (Peck and Wang, 1981; Strauss et al., 1981) and by the nuclease digestion patterns of DNA adsorbed on surfaces (Behe et al., 1981; Rhodes and Klug, 1981). Because these local variations in helix geometry may serve as signals for protein recognition, it is important to understand their origin and to develop models for the prediction of helix parameters for DNAs of specified sequence; ideally, these models should also provide information on the energetics and dynamics of helix deformations. Several quantitative models for predicting some of these parameters have been proposed (Dickerson and Drew,1981; Kabsch et al., 1982; Fratini et al., 1982;Dickerson, 1983a;Tung andHarvey, 1984). This paper presents method a for predicting helix parameters, treating helix twist angle and base pair roll angle in A-DNA, B-DNA, and an A/B hybrid, covering both crystallographic and solution structures. This paper also discusses how the step-by-step accumulation of small deviations from the average helix parameters can produce macroscopic static curvature in the molecule. The model goes beyond those of earlier workers in that it allows the examination of the energetic costs of small structural deformations, and it gives some information on dynamic properties of the double helix. Before presenting our model, it willbe useful to briefly review the work of Calladine (1982) and Dickerson (1983a), because it explains why different DNA sequences produce different local geometries, and because we will compare the results of our calculations with theirs. The sequence dependence of the local geometry of DNA double helices arises from a basic assymmetry within WatsonCrick base pairs; since purine bases are about twice as large as pyrimidines and, therefore, cover about two-thirds of the diameter of the double helix, steric conflicts can occur between neighboring purines on opposite strands of the molecule. This would not happen if all base pairs were flat andperpendicular to the helix axis, but the stacking of successive bases on the same strand canbe optimized by rolling the bases, introducing a substantial propeller twist in each base pair (Levitt, 1978), and producing the purine-purine clashes described above. These steric conflicts are shown schematically in Fig. 1. The purine-purine clashes can be relieved by adjustments in the helix twist angle, the base pair roll angle, the propeller twist, or by the lateral sliding of the base pairs. These strategies were explored by Calladine (1982), who also postulated that a purine-purine conflict in the minor groove would be twice as severe as a purine-purine clash in the major groove, thus leading to a quantitative scheme for predicting variations in helix twist angle in B-DNA. The ideas of Calladine (1982) have been further developed by Dickerson and his co-workers, who proposed a simple sum
3700
Sequence and Helix Structure of DNA function for calculating the helix twist angle for any given sequence in B-DNA (Fratini et aL, 1982) and then extended the method to the prediction of base-pair rollangle and propeller twist (Dickerson, 1983a).The method has also been successfully applied to the explanation of the sequence dependence of helix twist angle and base pair roll angle in ADNA (Dickerson, 1983a). The recent Scientific American article by. Dickerson (1983b) givesa very clear summary of the Calladine-Dickersonmodel. There are, however, some sho~comings to that prediction method, and theprocedure described in thispaper represents a substantial improvement over the earlier method. First, the Calladine-Dickerson method does not quantitatively predict the exact values of the various helix parameters for a specified DNA sequence; only the relative magnitudes of deviations from average valuesare given. The resulting predictions contain two parameters that must be adjusted for each set of experimental data: the average valueand a scaling factor that converts relative deviations to absolute deviations. Our method contains no parameters that must be determined, so it makes quantitative predictions for solution data; if desired, one can add an offset to these predictions to adjust for systematic curvature (in the case of roll angle) or overtwisting/undertwist~g(in the case of helix twist). This offset amounts to one free parameter that can be introduced if data is available. Second,although purines are distinguished from pyrimidines, the Calladine-Dickersonrules do not distinguish between adenine and guanine nor between thymine and cytosine. Our method eliminates this second problem. Third, since it is based on conformational energy calculations for an all-atom structure, our modeldescribes the energetic and dynamic aspects of some modesof motion of the DNA double helix.
3701
3 ‘ t -”--2l
5‘
A”
-
3’
3’”
,
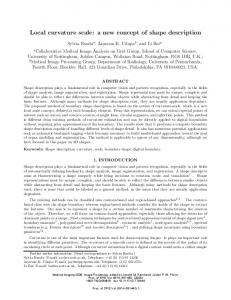
FIG. 1. Steric clashes generated by rolling of base pairs. Steric clashes between purines on opposite strands occur in themajor groove for purine-pyr~idinesteps (upper) or in theminor groove for pyrimidine-purine steps (Lower). After Dickerson (1983a), with permission.
in the substantial reduction in the number of degrees of freedom of the model. One of our objectives was to reduce the number of degrees of freedom in the trimer to the point where we would not have to use energy minimization methods but could survey a large region of conformational space and calculate the energy a t many points inthat space. There areseveral advantages to such a survey. To begin with, a comprehensive grid search guarantees that the absolute minimum energy conformation will be found, whereas ordinary energy minimization produces conformations that depend largely on the choice of a starting structure (Haran et al., 1984). In addition, by averaging over all degrees of freedom except one, the dependence of the energy on the coordinate corresponding to that degree of freedom can be determined. In cases where that dependence is approximately quadratic, the force constant (stiffness) of the molecule for motions along that MATERIALS ANDMETHODS coordinate is easily obtained. Examples of this are the Young’s General Procedure-Our approach to this problem is based on modulus and torsional stiffness for B-DNA that we have recently three observations. First, since the sequence dependence of helix reported (Tung and Harvey, 1984). Finally, because of thermal moparameters arises from steric effects, it should he possible to predict tions in macromolecules, all experimentally observed structures and optimum helix geometries by examining the variations in conforma- parameters are dynamic averages over a region of conformational tional energy as helix parameters are varied. Second, since motions space, so the calculated values from these studies should be more of the polynucleotide backbone are only weakly coupled to those of accurate than those from energy minimization, since they represent the bases (Olson, 1981; Keepers and James, 1982; Kollman et al., dynamic averages. 1982) and since it is base pair interactions we are interested in, an Definition of DNA Structural Parameters-To be able to place the enormous reduction in the number of degrees of freedom can he model base pairs inconformational space, we need to be able to relate obtained by using models with rigid bases and without explicit atoms the Cartesian coordinatesof the all-atom base pair to theparameters for the deoxyribose-phosphate backbone, As will he shown, backbone that describe the geometry of the double helix. We take the axis of effects can be implicitly included in the model for the prediction of the double helix to be perpendicular to theXY plane. For a particular roll angles, and torsional springscan serve to model backbone effects base pair (atomic coordinates for A-T and G-C base pairs are given on helix twist angles. Third, with only a few degrees of freedom, we in the “Appendix”), it is convenient to define a long base pair axis, are not confined to the traditional energy minimization methods and we have chosen the line connecting the pyrimidine C6 atom with (Levitt, 1978; Harvey and McCammon, 1981; Kollman et al., 1982; the purine C8. The tiltangle of a base pair, BT, is defined as theangle Tung etat, 1984), so we can survey conformational space and calcu- between the long axis of the base pair and itsprojection on the XY late values by averaging over all conformations, using the appropriate plane. Roll angle, BE, measures rotations of the best fit plane for a Boltzmann factors for weighting. The promise of this method was base pair about the long axis, with OR = 0 when the base pair short demonstrated in our preliminary calculations on helix twist angles in axis (a line perpendicular to the long axis and lying in the best fit base pair plane) is parallel to the XY plane. As we move along the B-DNA (Tung andHarvey, 1984). To implement the approach described in the previous paragraph double helix from one base pair to the next, we can define the roll we have explored the conformational space of idealized “trimers,” angle change for a base pair step, A&, to be the difference between where each trimer consists of a stack of three isolated base pairs the roll angles of the two base pairs that form the step. We follow the (without the deoxyribose phosphate backbone) set up so that theaxis convention that a positive change of roll angle represents a base pair of the double helix is parallel to theZ axis of the coordinate system. step open toward the minor groove, while a negative change of roll All d3/2 = 32 unique trimers were studied. The upper and lower base angle means the base pair step is open toward the major groove. pairs were held fixed in positions appropriateto A-DNA geometry or Propeller twist ( B p ) measures the counter-rotation of two bases in a B-DNA geometry, according to the case being studied, and the total base pair. Since base pair roll angle and propeller twist represent the conformational energy (van der Waals plus electrostatic) was calcu- average and thedifference, respectively, of the roll angles of individual lated as a function of the position of the mobile central base pair. bases in a base pair, it is a straightforward procedure to calculate any The fixed geometries for the endbase pairs provide boundary con&- two of these four angles when the other two are given. For two . tions that are intended to represent the average positions occupied consecutive base pairs, the helix twist angle, tg, is defined to be the by these base pairs. In that sense, backbone effects are implicitly angle between the projections of the two long axes on theXY plane. treated, but theimportance of the fixed end base pairs lies primarily The base pair separation for a given base pair step is simply the
distance between the successive base pairs, measured along the helix axis. All of the above definitions are identical with those of Fratini et al. (1982),with the exception of base pair tilt angle. If we denote their tilt angle by &*, then therelationship between the two tilt angles is
deoxyribose Cl' atom is further from the axis of the helix than it isfrom the long axis of the base pair. Consequently, a 1" change in helix twist angle displaces that atom further than does a 1" change in roll angle or propeller twist. The ratio of displace men^ is about 4:l in A-DNA and 31 in Bsin(&*) = cos(&) .sin(&). DNA. Consequently, helix-twisting motions through a given angle perturb thebackbone more than do base-rolling motions For our A-DNA model,where BT = 17", the difference between BT and &* is lessthan 0.6",because roll angle is never greater than 15".For of the same amplitude. Second, as will be seen in the tables our B-DNA calculations, there is no difference, since we have held in the following sections, the equilibrium base pair rollangles tilt angles fixed at 0". in A-DNA cover a range of less than 18" (the range is less ConformationalEnergy Calculations-Each trimer was constructed than 12" in B-DNA), and thepropeller twist angles also span one base pair at a time. Each base pair was placed in the XY plane a range of less than 18", whereas the range of equilibrium with its center of rotation at the origin. If necessary, the base pair helix twist angles calculated in the absence of backbone effects was flipped over to guarantee that its a: surface was facing in the 5 ' 4 3 ' direction of the DNA strand with which the purine was covers 24" in A-DNA and 36" in B-DNA. Thus, helix twist associated (Rose et a t , 1980; Harvey, 1983). It wasetranslated along attempts to distort the backbone much more seriously than the ,Z axis, with a base pairseparation of3.0 A for A-DNA or base rolling. 3.4 A for B-DNA. Base pair tilt was taken to be 17" for A-DNA and In order to begin with the simplest prediction scheme, we 0" for B-DNA. For the end base pairs, propeller twist was fixed at 17" in both cases, and the total helix twist of the trimer was set at will present the results for base pair roil angles first, even received more attention 64" for A-DNA and 72" for B-DNA. The final parameter that has to though helix twist histo~ca~ly has be set for the end base pairs is the base pair roll angle. For a given (Behe et al., 1981; Peck and Wang, 1981; Rhodes and Mug, trimer the difference in roll angles between the endbase pairs depends 1981; Strauss e t al., 1981; Calladine, 1982; Kabsch et al., 1982; on the sequence of the trimer. Designating the sequence on one strand Fratini et at., 1982; Tung andHarvey, 1984). Our predictions XYZ, the difference in base pair roll angles will be near 0" is X and will be compared to those of Dickerson (1983a). Helix twist Z are bothpurines (or both pyrimidines), near +5" if X is a pyrimidine and Z a purine, and near -5" if X is a purine and Z a pyrimidine will then be discussed, with results compared to the models (Calladine, 1982; Dickerson, 1983a; Tung and Harvey, 1984). Conse- of Kabsch et ai. (1982) and of Dickerson (1983a). Prediction of Base Pair Roll Angles-The important paramquently, we have set theroll angles of the end base pairs to be 0" in the first case, and we have set them to 22.5" otherwise, open to the eter to be predicted, both for the comparison with experiment minor groove in thesecond case and open to themajor groove in the and for the determination of macroscopic bending of the third case. The endbase pairs were held fixed tbroughout the calcu- double helix, is A$, the difference in the roll angles of the lations, and only the central base pair was allowed to move. Because it is to be expected that the deoxyribose-phosphate back- successive base pairs. The 32 trimer calculations provide the bone, which is absent in thesecalculations, would have a very impor- statistically averaged roll angle differences when the end base tant role in determining the energetics of the lateral sliding of the pairs are held in the fixed geometries described above (see central base pair, we eliminated the sliding degrees of freedom by "Materials and Methods"). Unfortunately, there are too many always keeping the center of rotation of the central base pair on the degrees of freedom to fully treat all possible tetramers, which 2 axis. Verticat motions of the central base pair were also eliminated, would be necessary for precise predictions to be made for since we have found base pair separationto be insensitive to sequence (Tung and Harvey, 1984).We have found in comparative calculations A&(XY) for any base pair step, XY, within the sequence that eliminating this degree of freedom does not seriously affect the . . .WXYZ., . . As will now be shown, a reasonable prediction expectation values of the otherhelical parameters or of the energies. can be obtained by averaging two values, A&(XY) within the This is a consequence of the low longitudinal compressibility of the trimer WXY and A&(XY) within thetrimer XYZ. In a DNA double helix (Tung andHarvey, 1984). crystal, where an average curvature of the double helix may There remain only three degrees of freedom for the central base be observed, the fit to the data canbe improved by adding a pair. Conformational space was scanned in a grid search by varying constant to all predicted roli angles, so that the average for the helix twist angle of the central base pair relative to the bottom base pair from 0" to 72" in increments of 2",base pair roll angle from the predicted angles agrees with that observed experimentally. Table I gives the calculated change in base pair roll angle -15 to 15" in increments of 3",and propeller twist angle from -5 to for the two steps in all 32 unique trimers, for both A-DNA 25" in increments of 3". We have verified that at the extremes of these ranges the energy was always greater than 5 kcal/mol above and B-DNA. Fig. 2 shows the application of the prediction that at the minimum energy configuration, so that all reasonably scheme to two self-complimentary double helical oligomers. thermally accessible conformations have been included in the calcuTo demonsrate the prediction procedure, let us consider the lations. B-DNA dodecamer CGCGAATZGCG, where The parameters for calculating the van der Waals and electrostatic TC step in the energies are given in the "Appendix." All atoms, including hydrogens, the step of interest has been underlined. In Table I, the E G are included, except that we have used a single extended atom for the trimer shows ABR = -1.55" for the TCstep, while A@R= 0.26" thymine methyl group to avoid having to consider the subtle steric for the same site inthe trimer T E . Our unbiased prediction effects of methyl rotations. The partial atomic charges are those of would be the average of those two values, -0.65". The root Miller (1979), and a standard distance-dependent dielectric constant (McCammon et al., 1979; Tung and Harvey, 1984) has been used to mean square (rmsl) deviation between the predicted values and the data for the central nine base pair steps would be mimic dielectric screening by the solvent. 3.6", which compares favorably with the rms deviation of 2.5" using the prediction method of Dickerson (1983a). Note that RESULTS our prediction is based on a model with no free parameters. Our conformational energy calculations provide an ex- As mentioned above, we can improve the fitby adding a tremely simple method for predicting base pair roll angle, constant offset (-1.32" in the case of this molecule) to all since backbone effects are treated implicitly. Our prediction predicted values. Doing that gives a predicted roll angle of scheme for predicting helix twist angle, on the other hand, -1.97" for the TC step, as shown in Fig. 2b, and the rms does require the inclusion of explicit backbone effects, so that difference between the predicted values and the data is rethe method for predicting helix twist angles is more complex. duced to 3.3" for what is now a one-parameter model. The reasons why the backbone affects helix twist more than The abbreviation used is: rms, root mean square. the angles involving base rolling is quite simple. First, the
Helix and Sequence
Structure of DNA
3703
TABLE I Changes of base pair roll angles (degrees) Sequences are listed alphabetically, with the 5'-+3' sequence of only one strand given. For instance, the TT step in the sequence TTC is identical to the AA step in GAA, since the duplex has the structure TTC.GAA. For the trimer XYZ, the first step is the XY step, while the second step is the YZ step. B-DNA
A-DNA
Sequence First step
AAA -0.22 0.22 -1.37 1.37 AAC -4.44 -0.56-1.92-3.08 AAG1.89 -1.89 0.22 -0.22 AAT -4.07 -0.93-3.79-1.21 ACA3.85 -3.85 5.26 -5.26 ACC -0.54 -4.46-0.22-4.78 ACG5.34 -5.34 6.73 -6.73 ACT -0.15 -4.85-0.78-4.22 AGA -0.22 0.22 0.68 -0.68 AGC -3.08 -1.92-4.02-0.98 -1.04 1.04 AGG1.55 -1.55 ATA3.75 -3.75 6.88 -6.88 ATC -0.71 -4.29 1.15 -6.15 ATG4.07 -4.07 5.55 -5.55 CAA 4.68 CAC 3.01 CAG 3.30 CCA 2.51 ccc 0.84 CCG 1.24 CGA 6.55 CGC 5.06 CTA 2.88 CTC 1.60 GAA 0.26 GAC -1.40 GCA -3.47 GCC -4.58 GGA 1.19 GTA -2.43 TAA 3.54 TCA 0.31
Second step
First step
Second step
0 -2
0.32 -3.01 1.70 2.49 -0.84 3.76 -1.55 -5.06 2.12 -1.60 -0.26 -3.60 3.47 -0.42 -1.19 2.43 1.46 4.69
7.82 6.59 6.57 -1.71 -0.16 -2.66 6.18 3.53 -2.66 -1.92 3.91 1.66 -3.15 -3.49 -0.59 -7.53 10.01 -0.11
-2.82 -6.59 -1.57 6.71 0.16 7.66 -1.18 -3.53 7.66 1.92 -3.91 -6.66 3.15 -1.51 0.59 7.53 -5.01 5.11
In theA-DNA prediction, for the octamer GGTATACC, let us examine, for instance, the step between T3 and A4. The trimer TAT has ABE = 6.88" (Table I), and theTA stepin the trimer G B has ABE = 7.53". The average value of these two angles, 7.21",would normally be the predicted roll angle change for that step. The experimental value is much higher (Fig. 2a), reflecting the octamer curvature (Shakked et al., 1983). If we compensate for this curvature and add an offset of 7.39" to the unbiased prediction, we obtain 14.6" for A& for the T A step in GGBTACC. With this systematic deviation added to the values of ABR from Table I for all seven steps in the octamer, we obtain an excellent fit to the experimentaldata,as is seen in Fig.2a. The predictions thus obtained may be considered to contain one floating parameter, the average value of ABR,which is 7.4", derived by fitting to the data. The rms deviation between our predicted roll angles and theobserved values is 1.3" for this one-parameter model; this compares very favorably with the rms difference of 1.5" for the two-parameter model of Dickerson (1983a). There is one other molecule to which we have applied the method, the octamer GGCCGGCC, which has a "modified AD N A structure, where alternate sugars in the central four base-pairs have conformations more like B-DNA than ADNA (Wang et al., 1982). We have predicted base pair roll angles for this molecule in two ways. First, we have simply used the A& values from Table I for A-DNA. Second, to see the effects of a B-like structure on our predictions, we have used the A-DNA values for all except the three central base
C
G
I
C
I
G
I
A
I
A
I
T
I
T
I
C
G
C
G
FIG. 2. Prediction of base pair roll angles in A-DNA (a)and in B-DNA (b). The solid line connects the end-for-end average values, while the error bars show the ranges of observed values. For example, for the A-DNA octamer, the end steps have roll angles that range from 6.1"to 8.6",with an average of 7.2"(Shakked et al., 1983). Open circles indicate predictions from our model, while squares indicate those from the model of Dickerson (1983a).Data for B-DNA are from Fratini et al. (1982).
pair steps, where we have used the values for B-DNA. The difference between the two procedures is small, and Fig. 3 shows the results for the first method, with an offset of 7.22" for each base pair step, to minimize the rms difference between the data and thepredictions. That difference, 3.49", is somewhat higher than the value of2.04" obtained by the method of Dickerson (1983a), but thedifference is not statistically significant. Prediction of Helix Twist Angles-In contrast with the rolling motions of the bases, the twisting motion of the helix as awhole causes substantial deformations of the deoxyribosephosphate backbone, so those deformations must be included in modeling helix twist. We have previously developed a model which separated effects of base pair interactions from backbone effects (Tung and Harvey, 1984). That study examined only eight trimers, all of which were strict homopolymers, such as d(AAA)-d(TTT),or alternating copolymers, such as d(ATA) .d(TAT). Having now extended the calculations to all 32 possible trimers, we have been able to make two substantial improvements. First, the previous model produced separate setsof prediction parameters for B-DNA in solution and B-DNA in crystals; in this paper we provide a single set
Sequence and Helix Structure of DNA
3704
i " . 7
l6 14
c
"I
1
I
G
G
C
C
G
G
C
C
FIG. 3. Predictions of base pair roll angle in the octamer d(GGCCGGCC).Symbols are used as in Fig. 2, and the datais from Wang et al. (1982).
of parameters for B-DNA under all conditions. Second, the prediction algorithm has been extended to A-DNA. The model has two parts. To begin with, DNA twisting is modeled as the deformation of a series of torsional springs, whose characteristics aredetermined from the conformational energy calculations (for interactions between base pairs) or by parameter optimization (for the backbone effects). In the second part of developing the model, the information about those torsional springsis collated and simplified by determining - the average helix twist angle of all possible base pair steps, t ; the intrinsic deviation from the average for a given step; At; anda propagation factor that indicates how much a particular base pair step is affected by deviations in neighboring steps, a. To predict the helix twist angles in aspecified DNA sequence, that information is used in the following equation,
FIG. 4. Torsional spring model for helix twist angles of a trimer. Note that distances in this figure correspond to angles, not to lengths. The sequence of the trimer is ABC, with step 1 corresponding to the AB step and step 2 to the step BC. t, and ty are the equilibrium helix twist angles under the influence of the five springs. The steric interactions of base pairs A and B produce a force field that is modeled bya single torsional spring with an equilibrium twist angle Tx and a torsional constantkx, and a similar situation between base pairs B and C gives T y and ku. Backbone deformations for a single step aremodeled by a springcharacterized by equilibrium twist angle and torsional spring constant TBIand kBl, respectively. Propagation effects from one step into the other are modeled by a spring with equilibrium twist angle and torsional spring constant TBZand kBz, respectively. As in our previous work (Tung and Harvey, 1984), we assume TB2 = 2TB1 simply to reduce the number of free parameters.
earlier study (Tung and Harvey, 1984) are a good first approximation for modeling backbone effects and then calculated the angles tx and t y (Fig. 4) for all steps in all trimers. We sought a set of prediction parameters (including A t for each of the unique base pair stepsand a value of a ) that gives predictions in agreement with the results from the torsional spring model for all 32 trimer sequences. The quantity to be minimized is the sum of the squares of the differences between the predicted helix twist angles of Table I1 (for A-DNA) or Table I11 (for B-DNA) and those calculated from the corret(n)= F + At(n) - aAt(n - 1) - aAt(n + 1)(1) sponding torsional springmodel. In this approach, a is essenwhere the index n is used for numbering the successive base tially a parameter that optimizes the internal consistency of the model, and it is not obtained by fitting the model to pair steps. The torsionalspring model is shown in Fig.4. It was experimental data. Only after a was determined ( a = 0.46 for adopted because we have found that the conformational en- A-DNA, a = 0.33 for B-DNA) were the remaining backbone ergy showsa nearly quadratic dependence on helix twist angle spring parameters refined by an optimization that compared (see Fig. 3 of Tung and Harvey, 1984) and because we have the model to experiment. We were gratified to find that a single set of parameters assumed that the energy of backbone deformations will also vary quadratically with the twist angle. In a given trimer the suffices to model both the solution data and the crystallovalues for the spring parameters Tx,h , TY,and h can be graphic data for B-DNA, in contrast with our previous work determined from the conformational energy calculations. (Tungand Harvey, 1984), where rather different sets of These parameters for A- and B-DNA are given in Tables I1 parameters were found for the two cases. We believethat this is a result of having carried out the calculations for all 32 and 111. In those tables, it will be observed that thereare differences trimers, whereas our earlier work only covered eight trimers. in thespring parametersfor a given base pair step in different Another set of parameters has been determined in a similar trimers. Given those differences, it would not be possible to manner for A-DNA. Table IV contains the backbone spring determine the intrinsic helix twist angle for a given base pair parameters, while the parameters for predicting helix twist step, XY, without some sort of an averaging procedure that angles will be found in Table V. To predict the helix twist angles in a DNA of given seconsidered the behavior of that step inthe eight trimers where it appears (AXY, CXY, GXY, TXY, XYA, XYC, XYG, and quence, appropriate values from Table V are used in Equation XYT). The strategy we have followed is to ask the following 1. Fig. 5 shows the application of the method to both A-DNA questions. Using the spring parameters of Tables I1 and I11 and B-DNA, along with a comparison of our predictions with and an appropriate set of backbone spring parameters, is those of Dickerson (1983a) and, in the case of B-DNA, with there a single value for the propagation factor a and the Kabsch et al. (1982). The rms deviation between the predicted intrinsic change of helix twist angle Atxv that can reasonably and experimental values is 3.1" for the central nine base pair represent the behavior of the dimer XY in all eight trimers? steps of the B-DNA dodecamer. This deviation is about 50% greater than in our previous model (Tung andHarvey, 1984), And, ifwe repeat that process for all unique dimers, can a single value of a satisfactorily unify all of the data? To refine as is thedeviation between predicted and observed values for a we assumed that thebackbone spring parameters from our the solution data (0.7" for this work uersus 0.5" for the
Sequence and Helix Structure of DNA TABLEI1 Spring parameters forA-DNA The torsional constants kx and ky have dimensions kcal .mol". deg-' while the equilibrium twist angles T x and Ty are given in are degrees. Nomenclature is identical to that of Fig.Tv5. Sequences kv listed alphabetically, with the sequence of only one strand given. For example, the TT step in thesequence TTC is identical to theAA step in GAA, since the duplex has the structure TTC. GAA. Sequence
AAA AAC AAG AAT ACA ACC ACG ACT AGA AGC AGG ATA ATC ATG CAA CAC CAG CCA
ccc
CCG CGA CGC CTA CTC GAA GAC GCA GCC GGA GTA TAA TCA
kx
0.0123 0.0123 0.0129 0.0129 0.0093 0.0092 0.0097 0.0092 0.0140 0.0138 0.0141 0.0105 0.0102 0.0105 0.0079 0.0067 0.0068 0.0109 0.0111 0.0109 0.0080 0.0075 0.0103 0.0150 0.0135 0.0134 0.0069 0.0066 0.0132 0.0104 0.0080 0.0109
Tx
ku
TY
24.63 26.67 26.78 26.78 18.33 21.12 20.57 21.12 21.75 22.18 21.73 20.38 20.35 20.38 7.29 7.97 6.81 17.17 24.93 17.17 7.91 11.43 12.53 24.70 27.51 27.37 19.25 19.00 21.61 20.20 11.76 29.56
0.0137 0.0101 0.0115 0.0105 0.0075 0.0132 0.0081 0.0138 0.0115 0.0068 0.0110 0.0084 0.0131 0.0073 0.0126 0.0104 0.0103 0.0072 0.0132 0.0080 0.0109 0.0066 0.0080 0.0135 0.0137 0.0106 0.0075 0.0136 0.0115 0.0084 0.0131 0.0072
25.86 19.93 18.29 20.38 7.51 21.69 8.00 22.18 29.67 21.07 16.88 13.79 29.54 5.24 23.94 20.20 12.53 5.58 21.61 7.91 29.56 19.34 11.76 27.51 25.86 21.92 7.51 23.88 29.67 13.43 25.84 5.58
previous model). Since the magnitudes of these errors are so small, we believe they are acceptable, considering the advantage obtained by having a single set of predicted helix twist angles for B-DNA bothincrystalsandin solution. The difference between our rms error (3.1") andthat of 2.1" obtained'by the method of Dickerson (1983a) is not statistically significant. For the A-DNA octamer GGTATACC, our result isslightly better thanDickerson's, but both predictions are very good, and again the difference is not statistically significant. When the method is applied to the modified A-DNA octamer GGCCGGCC using the A-DNA prediction parameters of Table V, the fit to the data is very poor, with an rms difference of 8.2" between the predicted and experimental values. For this same sequence, the Dickerson algorithm gives an rms difference of only 1 2 ,and here his rms error is statistically significantly smaller than ours (F = 43, p < 0.001). This is the one case where the method of Dickerson (1983a) is clearly far better than ours. DISCUSSION
The results described in the previous section have shown the utility of conformational energy calculations that examine only the interactions between successive base pairs for treating the sequence dependence of the local structure of doublestranded DNA. Simple methods have been developed that allow the prediction of the geometry of each base pair for any specified sequence in either the A-DNA or B-DNA confor-
3705
TABLE I11 Spring parametersfor B-DNA See Table I1 for nomenclature, units, and instructions on how to find unlisted sequences. Sequence Tx -
AAA AAC AAG AAT ACA ACC ACG ACT AGA AGC AGG ATA ATC ATG CAA CAC CAG CCA
ccc
CCG CGA CGC CTA CTC GAA GAC GCA GCC GGA GTA TAA TCA
kx
0.0167 0.0161 0.0165 0.0151 0.0138 0.0151 0.0136 0.0150 0.0351 0.0348 0.0301 0.0119 0.0134 0.0112 0.0210 0.0185 0.0176 0.0136 0.0236 0.0111 0.0251 0.0230 0.0191 0.0271 0.0134 0.0119 0.0141 0.0151 0.0373 0.0143 0.0257 0.0068
42.0 42.8 44.0 43.0 41.5 43.5 40.5 43.5 29.7 31.3 32.8 44.5 43.5 47.0 16.5 12.5 19.5 42.5 35.0 42.5 20.2 17.5 39.0 31.8 39.0 38.5 41.5 41.5 31.3 46.2 15.8 38.5
0.0174 0.0157 0.0273 0.0133 0.0251 0.0329 0.0236 0.0349 0.0117 0.0143 0.0221 0.0250 0.0115 0.0197 0.0117 0.0128 0.0179 0.0192 0.0313 0.0207 0.0057 0.0150 0.0214 0.0128 0.0169 0.0150 0.0245 0.0320 0.0133 0.0252 0.0130 0.0227
42.0 43.5 31.5 43.0 16.5 31.8 18.2 30.8 39.5 41.5 36.2 16.5 38.5 14.2 45.5 48.5 40.5 18.5 34.2 20.5 39.5 40.5 18.2 41.5 42.0 43.5 16.0 32.5 39.5 15.0 43.5 17.0
TABLE IV Backbone spring parameters (seeFig. 4 for nomenclature) deg
0.027 A-DNA B-DNA
34.5 36.0
kcal. mol". deg"
0.032
kcal. mol". deg"
0.015 0.016
mation. No adjustable parameters were required to generate Table I for base pair roll angle, while Table V (for use in conjunction with Equation 1for predicting helix twist angles) was developed with three parameters that were obtained by fitting the model to a large body of experimental data. Table VI gives a summary of how well each of the three methods for predicting helix parameters fits the existing crystallographic data. A simple F test shows that our method is of comparable accuracy to thatof Dickerson (1983a), for in only one case is a statistically significant difference observed. We believe that our method has three advantages over Dickerson's. First, there are no remaining parameters which must be fitted to data, so the predictions apply directly to both solution and crystallographic conditions; one parameter may be introduced. Dickerson's is a two-parameter model. Second, by using an all-atom model of the bases, our method distinguishes between adenines and thymines (and between guanines and cystosines) and not justbetween purines andpyrimidines. The all-atom calculations will also make it possible to extend the calculations to chemically modified sequences, such as those containingmethylated bases. A third advantage of our approach lies in theenergetic and dynamic information contained inthe model; these issues will be discussed in detail later in this section.
of DNA
Structure Helix and Sequence
3706
TABLE V Parameters for use with Equation 1 for predicting helix twist angles The average twist angle tand the deviationsAt are given in degrees. 01 is dimensionless. ~
Atm AtAT
A-DNA B-DNA
1.85 3.31
AtTA
-1.55 -6.09
AtcT AtTc AtTc
0.17 3.15
3.65 1.90
Atcc
AtcT
-1.26 0.22
-3.11 -5.50
Atoc
0.65 3.19
01
t
0.46 0.33
32.30 33.94
Atcc
-3.21 -4.92
2.67 2.44
-0.10 0.91
TABLE VI Comparison of models for predicting parameters local of geometry of the double helix (The predictions of Kabsch et al. (1982) have been shown here for A-DNA for comparative purposes only, as their medictions amlv onlv to B-DNA). ~~
Parameter
Root mean square deviation, model uersus data
Molecule
Kabsch et al. (1982)
Dickerson (1983a)
Present work
F”
0.84 8.16
0.64 43*
deg
Helix twist
pair
Base
E:
CGCGAATTCGCG 2.16 GGTATACC GGCCGGCC
2.53 3.07 (3.59) (10.3)
2.09 1.05 1.24
roll
CGCGAATTCGCG NA“ 2.49 3.32 1.78 GGTATACC NA 1.53 1.29 0.71 GGCCGGCC NA 3.49 2.04 2.93 F = ratio of variances (this work: Dickerson (1983a)). Values less than 1.0 indicate that the present method gives superior predictions,while values greater than 1.0 indicate that Dickerson’s method gives better predictions. *This is the only value of F that is statisticallysignificant for a two-tailed test a t the level p < 0.1. e NA. not available.
steric interactionsbetween neighboringbase pairs are of much greater importance for determining the local helix geometry than arebackbone effects (Calladine, 1982; Dickerson, 1983a; Calladine and Drew, 1984), forthe backbone has been implic30 itly includedin ourprediction scheme for base pair roll angles, and backbone effectsfor helix twisting motions are reasonably modeled by simple torsional springs in parallel with those used for basepair twistingmotions. This lends support to the view that motions of the bases are only weakly coupled to those of the deoxyribose-phosphate backbone (Olson, 1981; Keepers and James, 1982; Kollman et al., 1982) and that the lowest energy configuration is determined by the adjustment of severalhelix parameterssimultaneously, leading to an equipartition of steric stressesbetween basepair steps (Haran et al., 1984). Calladine and Drew (1984) argue that the backbone is a relativelypassive elastic element that serves to communicate information on base-stacking interactions from one base pair step to another and that pyrimidine-purine steps are “bistable,” with the choice between two configurations mediated by water binding. In their view, it isbase-base interactions and water binding that determine whether DNA adopts the A or B configuration. There is, then, substantial agreement on the predominantrole of base-stacking interacC G C G A A T T C G C G tions in determininig helix conformation, with thebackbone FIG. 5. Prediction of helix twist anglein A-DNA (a)and in exerting modulatingeffects as arelativelypassive elastic B-DNA ( b ) .Symbols are used as described in the legend to Fig. 2, element. with the addition of triangles to represent the predictionsfor B-DNA Because we have scanned what we believe to be the most helix twist angles from the model of Kabsch et al. (1982). important dimensions of conformational space and calculated the variation of energy along those dimensions (rather than We have generated tables for the prediction of propeller searching for minimum energy configurations), our method given here because, like predicts some macroscopic properties of DNA that can be twist angles as well, but those are not Dickerson (1983a), we find that these predictions are gener- compared to experiment. These comparisons serve as indeally unsatisfactory. It should be noted that in calculations pendent checks on our methods. For B-DNA, aftersurveying similar to ours, Haran et al. (1984) did not find minimum all 32 trimers, we find a revised torsional elastic modulus of conformational energies for structures with thepositive pro- 5.9 X lo-’’ erg.cm, a value about 3.5% higher than the value peller twists observed experimentally. They suggest, and we we reported after calculations on only eight trimers and in agree, that base pair vertical separation is probably strongly very good agreement with values determined by a variety of coupled to propeller twist. Prediction of propeller twist angles experimental methods, as discussed earlier (Tung and Harvey, 1984). For longitudinalcompressibility, calculations inwhich is evidently a difficultproblem that will requiredetailed base pair separation is also varied predict a Young’s modulus analyses of sophisticated models. The success of this method reconfirms the belief that the of 1.3 X 10’l dyne.cm-’ for B-DNA, a factor of 4-200 times L
-1
Structure Helix and Sequence higher than experimental values (Tung and Harvey, 1984). The overestimation of longitudinal stiffness is almost certainly a consequence of the constraints we have placed on longitudinal motions of the end base pairs in the trimer calculations and of our restrictions on tilting, buckling, and longitudinal sliding of the central base pair. If those extra degrees of freedom were included, a lower Young's modulus would beexpected. Clearly, however, the longitudinal stiffness of B-DNA arises primarily from the core of the molecule, as pointed out by Prohofsky, Van Zandt, and their co-workers (Mei, et al., 1981; Putnam, etaL, 1982); in our previous report (Tung and Harvey, 1984) we unfortunately misrepresented their position on longitudinal compressibility. For A-DNA, the average torsional stiffness arising from interactions between the base pairs is somewhat lower than that for B-DNA (Tables I1 and 111), while the torsional stiffness of the A-DNA backbone is found to be greater than that for B-DNA (Table IV). When these differences are combined, the overall torsional modulus of A-DNA is predicted to be 5.1 X 1O-l' erg.cm, about 14%lower than that of B-DNA. We believe that the greater stiffness of the ribosephosphate backbone in A-DNA reflects both the greater electrostatic repulsions arising from the smaller distance betyeen adjacent phosphorus atoms, 5.7 A in A-DNA versus 6.5 A in B-DNA (Arnottet al., 1976), and the difference in sugar pucker. Regarding the latter point, changes in pucker angle for C3'-endo riboses, which arecharacteristic ofA-DNA, produce smaller changes in the backbone torsion angle 6 than do comparable changes in C2"endo riboses, like those of BDNA, so that the ribose-phosphate backbone of A-DNA is relatively stiffer than that of B-DNA (Westhof and Sundaralingam, 1983). The simple trimer spring model of Fig. 4 can be easily extended to longer oligomers, providing a very simple model for examining the dynamics of twisting motions in double helical DNA (Tung, 1984). To compare this approach with a full normal mode analysis on an all-atom model, we have examined the self-complementary hexamer d(CGCGCG) that has been modeled both by molecular dynamics and by normal mode analysis (Tidor et al., 1983). Our very simple model has only 6 degrees of freedom, compared with 816 degrees of freedom in the all heavy atom model, and we obtain very similar results for the twisting motions. At 300 K the rms amplitude of helix twist angles within a base pair step is calculated to be 3.0", in comparison with a value of 2.0" from the full normal mode analysis and "slightly less than 2"" from the molecular dynamics simulation (Tidor et al., 1983);experTKLDNR imental values are in the range of 3.3-5.7" (Barkley and Zimm, 1979; Millar et al., 1981). In examining correlations in twist angles along the helix, Tidor et al. (1983) reported that twisting is anticorrelated along the helix, a result also produced in our model (Tung, 1984).Finally, the normal mode frequencies that our model predicts for helix twisting range from 18 to 46 cm-l in this hexamer, and we note that the lowest frequency compares very well with the value of 16.1 cm-I for the lowest twisting frequency for this same molecule determined by the treatment of the all heavy atom model (Tidor et al., 1983). The ability to make reasonable dynamic predictions with our very simple model is, we believe, one of its most interesting features. While local variations in helix geometry are now a well established fact, it is important to ask whether such small variations can accumulate as we move along a piece of DNA, reinforcing one another in patterns of constructive interference to produce macroscopic deviations in the path of the
of DNA
3707
axis of the double helix, deviations that would show up as systematic DNA bending. One example of a piece of DNA that is believed to be bent on a macroscopic scale is a 414base pair fragment from the kinetoplast of the trypanosome Leishmania tarentolae. This fragment behaves in gel electrophoresis, gel filtration, and electric dichroism as if it were unusually compact (Marini et aL, 1982; Wu and Crothers, 1984), but this behavior is not due to denaturation, aggregation, in vivo modification, or unusual secondary structure (Marini et al., 1984). There is general agreement that the molecule is systematically bent (Marini et aL, 1982; Hagerman, 1984; Wu and Crothers, 1984). We have examined the conformation of this fragment as predicted by the step-bystep changes in the direction of the helix axis due to helix twist and base pair roll angles, feeding the sequence into a computer program (Tung and Harvey, 1986) containing the information of Equation 1 and Tables I and V (for B-DNA). Fig. 6 shows the lowest energy conformation predicted for the kinetoplast fragment, and systematic bending is clearly evident. This is a property of this specific sequence, because the program predicts that fragments of random sequence will have helix axes that deviate occasionally,but not this sharply, from nearly straight lines. We note that thecurvature of the fragment in Fig. 6 is considerably greater than that which would be expected from random thermal motions for B-DN4, considering the normal persistence length to be about 500 A (Hagerman, 1981). Consequently, the bend should be detectable experimentally, as it is(Marini et al., 1982). We have considered a testof the biological relevance of the sequence-dependent variations in helix twist, asking how much energy would berequired to deform a DNA of the wrong sequence so that itshelix angles would match those of another, d(GAATTC), which is the recognition sequence of the EcoRI restriction endonuclease. This addresses the question of whether or not a required match of DNA helix parameters to features on the protein surface might play a role in sequence recognition. Using the revised parameters of Tables 111-V, we find that if the wrong sequence d(CAATTG) is deformed so that thehelix angles of each step matchthose of d(GAATTC), an energy of 6.0 kcal. mol" is required. Even if this number is cut in half, to allow for the fact that thebinding site is not rigid, the resulting energy would still be sufficient to reduce the binding of the wrong sequence by a factor of 150 relative to the correct sequence, indicating that recognition of subtle variations in helix structure may indeed play an important TKLDNR U
U
FIG. 6. Stereoscopic views of the predicted three-dimensional structure for the kinetoplast fragment from the trypanosome Leishmania tarentohi, from the corrected sequence of Marini et al. (1983). The two views are at right angles to oneanother, illustrating how the DNA frgment is essentially bent ina plane. Scale bars are 100 A long.
Sequence and HelixStructure of DNA
3708
TABLEAI role in the recognition of specific sequences by proteins. A Atom types and associated van der Waals parameters relatively low resolution crystal structureis now available for the complex of the EcoRI endonuclease anditssubstrate Interaction energy energy Symbol Description separation (Frederick et al., 1984). Although the DNA structure in that 6 r crystal does differ from the standard B-DNA geometry, the kcallmol A foregoing energy considerations may be relevant to the sugC Ring carbon 4.06 0.20 gestion that specificity is controlled by physical contact be4.60 group 0.09 G Methyl tween the protein and the DNA, whereas sequence selectivity H Hydrogen 2.85 0.04 may be indirectly modulated by sequence-dependent DNA M Amino 3.82 nitrogen 0.22 conformational forces (Frederick et aL, 1984). The magnitude N Ring 4.06 nitrogen 0.20 of the energy associated with those forces is substantial, as 0 Oxygen 3.50 0.10 indicated by the calculations described in this paragraph. There are shortcomings to this model at its present state of development. In particular, because of the limited number of degrees of freedom that are treated and because of the TABLE AI1 oversimplified treatment of the backbone, the model is only The G-C base pair suitable for examining relatively small fluctuations about a Coordinates ( x , y ) and partial charge (9) of each atom. Atom preassumed average conformation. We plan to examine ad- ymbols are the same as those of Table AI. Coordinates arein ditional degrees of freedom (base pair sliding, base pair tilt, Angstroms and charges are in units of I e I, where e is the charge on motions of the end base pairs in the trimer)and to introduce the electron. a more realistic treatment of the backbone in futureresearch. Atom X Y 4 It is to be hoped that these improvements will allow us to Cytosine address the question of which conformation out of a large set N1 0.00 0.00 -0.19 of possible right-handed DNA conformations will bepreferred c2 1.33 0.00 0.68 by a particular sequence under a particular set of conditions. N3 -1.15 1.99 -0.45 An interesting approach to this problem has been proposed c4 0.39 1.33 -2.30 by Calladine and Drew (1984), who suggested that the A/B c5 0.00 -2.30 -0.30 -0.67 -1.15 C6 0.22 bistability of DNA doesnot arisefrom the backbone but from 0 1.07 2 1.95 -0.63 base pair sliding between two alternative low energy configM4 1.99 -3.46 -0.09 urations in pyrimidine-purine steps. It would be very interH4 -3.46 3.09 0.07 esting to examine this idea with a more sophisticated version H4‘ 0.07 1.44 -4.41 of our model. H5 -0.55 0.03 -3.26 In summary, conformational energy calculations on allH6 -1.77 0.03 -1.15 atom models of stacked base pairs, with suitable assumptions Guanine about the effects of the deoxyribose phosphate backbone, can H1 0.08 3.79 -1.15 provide information on the variations in the local geometry-0.25 N1 -1.15 4.89 of the DNA double helix; the sequence dependence of mac5.56 0.00 0.39 c2 roscopic bending; the energetic costs of deforming the mole-0.45 N3 6.89 0.00 7.55 c 4 -1.15 cule; and the amplitudes, frequencies, and correlations of the 0.22 -0.24 -2.30 c5 6.89 helix motions. The results of these calculations correlate well 0.65 -2.30 C6 with a substantial body of experimental data, and5.56 this is a -0.12 N7 -3.29 7.78 promising avenue for research into how specific sequences of 0.12 8.99 C8 -2.75 DNA are recognized byproteins. N9 8.86 -1.43 -0.07 Acknowledgment-We thank Richard E. Dickerson for stimulating discussions during the early stages of this work and for permission to use Fig. 1. 0.05 -0.61
M2 1.15 H2 H2‘ H8 -3.40 0 -3.26 6
4.89 3.79 0.09 5.44 9.88 5.01
1.15
-0.34 0.09
2.10
APPENDIX
Parameters for Conformational Energy Calculations The nonbonded interaction energy between atoms i and j has two components. The van der Walls energy is of the standardform,
Evow= A/r12 - B/r6 where A = trA2 and B = 2&, with the interaction energy givenby t = (titj)” and the interatomic separation at the energy minimum given by r, = (rjrj)”.We use six distinct atom types, identified in Table AI, which also lists the values of tiand ri for each atom type. All atoms are treatedexplicitly except for the thymine methyl group, which is represented by the single extended atom type G. The electrostatic energy is also of the standardform,
EES= 332 qiqj/(DrC)
where the partial atomic charges qi and q, are given in units of electronic change, D is the effective dielectric constant, rii is the interatomic separation in A, and thefactor of 332 causes the resulting energy to be expressed in kcal/mol. As is commonly done in this kind of calculation (McCammon et al., 1979; Tung and Harvey, 1984), dielectric screening has been mimicked by assuming that thedielectric coptant is numerically equal to theinteratomic separationin A, D ( r ) = r. This gives physically plausible values for the dieltctric constant over the distances of interest, about 2-10 A, andit also provides a differentiable expression for the energy, a necessity for calculating forces. The partial atomic charges are listed in Tables AI1 and AIII, along with the starting coordinates for all atoms in A-T and G-C base pairs, when the base pair is placed in thexy plane.
Sequence Structure and Helix TABLE AI11 The A - T base pair Coordinates ( x , y ) and partial charges ( 9 ) of each atom. Atom symbols arethe same asthose of Table AI. Coordinatesare in Angstroms and charges are in units of 1 e 1, where e is the charge on the electron. Atom
X
Y
4
0.00 0.00 -1.15 -2.30 -2.30 -1.15 1.07 -1.15 -3.38 -3.60 -1.15
-0.19 0.67 -0.28 0.64 -0.25 0.19 -0.59 0.12 -0.60 0.07 0.04
-1.15 0.00 0.00 -1.15 -2.30 -2.30 -3.29 -2.75 -1.43 0.95 -3.40 -3.46 -4.41 -3.46
-0.37 0.30 -0.29 0.23 -0.14 0.34 -0.20 0.17 -0.10 -0.03 0.04 -0.18 0.07 0.09
Thymine
N1
c2
N3 c4
c5 C6 02 H3 04 G5 H6
0.00 1.33 1.99 1.33 0.00 -0.67 1.95 3.10 1.95 -0.75 -1.77
~
Adenine
N1
c2 N3 c4
c5 C6 N7
C8 N9 H2
H8 M6 H6 H6’
4.90 5.57 6.90 7.56 6.90 5.57 7.79 9.01 8.87 5.02 9.90 4.90 5.45 3.80
REFERENCES Arnott, S., Smith, P. J. C., and Chandrasekaran, R. (1976) in CRC Handbook of Biochemistry and Molecular Biology (Fasman, G. D., ed) 3rd Ed., Vol. 2, pp. 411-422, Chemical Rubber Co., Cleveland, OH Barkley, M. D., and Zimm, B. H. (1979) J. Chem. Phys. 70, 29913007 Behe, M., Zimmerman, S., and Felsenfeld, G. (1981) Nature 293, 233-235 Calladine, C. R. (1982) J . Mol. Biol. 161, 343-352 Calladine, C. R., and Drew, H. R. (1984) J. Mol. Biol. 178, 773-782 Conner, B. N., Takano T., Tanaka, S., Itakura, K. andDickerson, R. E. (1982) Nature 295, 294-299 Dickerson, R. E. (1983a) J. Mol. Biol. 166, 419-441 Dickerson, R. E. (198313) Sci. Am. 294 (6), 94-111 Dickerson, R. E., and Drew, H. R. (1981) J. Mol. Biol. 149,761-786 Fratini, A. V., Kopka, M. L., Drew, H. R., and Dickerson, R. E. (1982) J. Biol. Chem. 257, 14686-14707 Frederick, C. A.{ Grable, J., Melia, M., Samudzi, C., Jen-Jacobson, L., Wang, B-C., Greene, P., Boyer, H. W., and Rosenberg, J. M.
of
DNA
3709
(1984) Nature 309, 327-331 Hagerman, P. J.(1981) Biopolymers 20, 1503-1535 Hagerman, P. J. (1984) Proc. Natl. Acad. Sci. U. S. A. 81,4632-4636 Haran, T. E., Berkovich-Yellin, Z., and Shakked, Z. (1984) J. Biomol. Struct. Dyn. 2, 397-412 Harvey, S.C. (1983) Nucleic Acids Res. 11,4867-4878 Harvey, S. C., and McCammon, J. A. (1981) Nature 294, 286-287 Kabsch, W., Sander, C., and Trifonov, E. N. (1982) Nucleic Acids Res. 10,1097-1104 Keepers, J. W., and James,T. L. (1982) J. Am. Chem. SOC.104,929939 Kollman, P., Keepers, J. W., and Weiner, P. (1982) Biopolymers 21, 2345-2376 Levitt, M. (1978) Proc. Natl. Acad. Sci. U. S. A. 75, 640-644 Marini, J. C., Levene, S. D., Crothers, D. M., and Englund, P. T. (1982) Proc. Natl. Acad. Sci. U. S. A. 79, 7664-7668 Marini, J. C., Levene, S. D., Crothers, D.M., and Englund, P. T. (1983) Proc. Natl. Acad. Sci. U. S. A. 80, 7678 Marini, J. C., Effron, P. N., Goodman, T. C., Singleton, C. K., Wells, R. D., Wartell, R. M., and Englund, P. T.(1984) J . Biol. Chem. 259,8974-8979 McCammon, J. A,, Wolynes, P. G., and Karplus, M. (1979) Biochemistry 18, 927-942 Mei, W. N., Kohli, M., Prohofsky, E. W., and Van Zandt, L. L. (1981) Biopolymers 20,833-852 Millar, D. P., Robbins, R. J., and Zewail, A. H. (1981) J. Chem. Phys. 74,4200-4201 Miller, K. J. (1979) Biopolymers 18, 959-980 Olson, W. K. (1981) in Biomolecular Stereodynamics (Sarma, R. H., ed) Vol. I, pp. 327-343, Adenine Press, New York Peck, L. J., and Wang, J. C. (1981) Nature 292, 375-378 Putnam, B.F., Prohofsky, E. W., and Van Zandt, L. L. (1982) Biopolymers 2 1,885-894 Rhodes, D., and Klug, A. (1981) Nature 292,378-380 Rose, I. A., Hanson, K. R., Wilkinson, K. D., and Wimmer, M. J. (1980) Proc. Natl. Acad. Sci. U. S. A. 77, 2439-2441 Shakked, Z., Rabinovich, D., Cruse, W. B. T., Egert, E., Kennard, O., Sala, G., Salisbury, S. A., and Viswamitra, M. A. (1981) Proc. R. SOC. Lond. B Biol. Sci. 213, 479-487 Shakked, Z., Rabinovich, D., Kennard, O., Cruse, W. B. T., Salisbury, S. A., and Viswamitra, M. A. (1983) J . Mol. Biol. 166,183-201 Strauss, F., Gaillard, C., and Prunell, A. (1981) Eur. J. Biochem. 118,215-222 Tidor, B., Irikura, K. K., Brooks, B. R., and Karplus, M. (1983) J. Biomol. Struct. Dyn. 1, 231-252 Tung, C. S.(1984) Ph.D. thesis, University of Alabama in Birmingham Tung, C. S., and Harvey, S. C. (1984) Nucleic Acids Res. 12, 33433356 Tung, C. S., and Harvey, S. C. (1986) Nucleic Acids Res. 14, 381-387 Tung, C. S., McCammon, J. A., and Harvey, S. C. (1984) Biopolymers 23,2173-2193 Wang, A. H. J., Fujii, S., van Boom, J. H., and Rich, A. (1982) Proc. Natl. Acad. Sci. U. S. A. 79, 3968-3972 Westhof, E., and Sundaralingam, M. (1983) J.Am. Chem. SOC.105, 970-976 Wing, R. M., Drew, H. R., Takano, T., Broka, C., Tanaka, S., Itakura, K., and Dickerson, R. E. (1980) Nature 287, 755-758 Wu, H. M., and Crothers, D. M. (1984) Nature 308,509-513