EuroWasser: Baseline-A: A reference scenario of global change
4
4-1
BASELINE-A: A REFERENCE SCENARIO OF GLOBAL CHANGE
Thomas Henrichs*, Frank Kaspar Center for Environmental Systems Research, University of Kassel, Germany *
[email protected]
4.1
Introduction
Scenario analysis provides a useful tool in environmental assessments for evaluating dynamic changes in society and environment. One of the first definitions cites scenarios to be “hypothetical sequences of events constructed for the purpose of focusing attention on causal processes and decision points” (Kahn and Wiener, 1967). By this, scenarios can lead to possible images of the future, but these should not be interpreted as predictions or forecasts. Rather, scenarios unfold their full potential when seen to enhance learning of complex systems, to highlight inter-connectedness of driving forces, to raise questions, and to identify critical issues. To guarantee meaningfulness, scenarios should be based on a coherent, internally consistent, reproducible and plausible set of assumptions and/or theories of the key relationships and driving forces of change (IPCC, 2000). For the EuroWasser project we analyze a long-term reference scenario of global change, the Baseline-A scenario. In this chapter we outline the driving forces of this BaselineA scenario and the scenario context (Section 4.2). Further, we describe how consistent climate (Section 4.3) and socio-economic (Section 4.4) scenarios are applied and down-scaled as input to the WaterGAP analysis. By this, the Baseline-A assumptions presented here provide a basis for projections of changes in water availability, water withdrawals, water stress, floods, droughts, and hydropower potential – which are discussed in the subsequent chapters of this report.
4.2
The Baseline-A scenario
To embed our analysis into a wider frame of global change assumptions, we apply the same driving forces as used in a published scenario generated with the integrated IMAGE 2.1 model from the Dutch National Institute of Public Health and Environment (RIVM) (Alcamo et al. 1998). Their scenarios are considered to be integrated scenarios, as they give “an integrated picture of global developments spanning a wide range of global change indicators, each of which are explicitly coupled”. In effect, with the EuroWasser study presented here, we extend their analysis by highlighting implications for the water sector under their intermediate scenario Baseline-A. This Baseline-A scenario is largely consistent with the no-climate-policy IPCC-IS92a scenario estimates of the Intergovernmental Panel on Climate Change (IPCC, 1992), which
EuroWasser: Baseline-A: A reference scenario of global change
4-2
imply an average annual increase of global carbon dioxide emissions by about one per cent per year until 2100. This global emissions pathway is also within the range of marker scenarios of the updated IPCC-SRES scenarios, and slightly above that of an intermediate scenario IPCC-SRES-A1B (IPCC, 2000). Climate projections for our reference scenario were therefore based on the IPCC-IS92a emissions pathway, and realized using two different General Circulation Models (Section 4.3). As far as possible, we rely on socio-economic driving forces and background as specified by the Baseline-A scenario. Where the WaterGAP approach requires additional input information, we borrow from the Business-as-Usual scenario developed during the recent World Water Vision process (Rjisberman, 2000). Most scenario assumptions from the original Baseline-A scenario are provided at a rather coarse level of aggregation only, i.e. for thirteen separate world-regions (four of which contain European countries: Western Europe, Eastern Europe, Commonwealth of Independent States (CIS), Middle East). Consequently, these need to be down-scaled appropriately for the WaterGAP approach. Below we describe the main socio-economic driving forces and how these have been derived in more detail (Section 4.4).
4.3
Climate change
Climate driving forces impact irrigation water use and all aspects of water availability in the WaterGAP approach. With respect to climate we focus our analysis on three time slices: Today’s climate, future climate representative for the 2020s, and future climate representative for the 2070s. A 30-year time series (1961 to 1990) of observed monthly precipitation and temperature values on a 0.5° degree global grid from New et al. (2000) depicts today’s climate condition. To derive appropriate future scenarios, today’s climate is scaled by applying changes projected by General Circulation Models (GCMs). Current GCMs remain highly uncertain in their modeling of clouds, atmospheric vapor and land surface processes, and thus precipitation estimates vary considerably between GCMs – not only in magnitude but sometimes even in the direction of changes (IPCC, 2001). Therefore, we use several future climate projections as input to our model, based on calculations from two different state-of-the-art GCMs: a) The ECHAM4/OPYC3 model from the Max-Planck Institute for Meteorology (Hamburg, Germany) with transient greenhouse gas and sulphate aerosol integration and greenhouse gas forcing according to the IPCC-IS92a scenario (Röckner et al., 1996, 1999). b) The HadCM3 model from the Hadley Centre for Climate Prediction and Research (Bracknell, U.K.) with transient all-anthropogenic forcing integration (HC3AA) and greenhouse gas forcing similar to the IPCC-IS92a scenario (Gordon et al., 1999). First, by applying a simple interpolation procedure, the GCM results are transposed from their original resolutions to a 0.5° degree grid. Then, for both GCMs, the decadal averages of mean
EuroWasser: Baseline-A: A reference scenario of global change
4-3
monthly values of precipitation and temperature of the years 2020 to 2029 (for the 2020s) and 2070 to 2079 (for the 2070s) are determined. Also, to reflect the GCM calculations of present climate conditions, the averages of 1950 to 1979 (of the ECHAM4 model) and 1960 to 1989 (HadCM3) are computed. These GCM-based averages of future and present climate conditions are then used to scale the present-day 30-year time series (New et al., 2000). It should be noted that possible effects of climate change on the year-to-year variability are not taken into account.
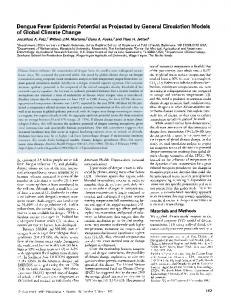
Figure 4.1: Percentage change in long-term average annual precipitation for Europe as calculated by two General Circulation Models (ECHAM4 and HadCM3) following the IPCC-IS92a emission pathway between the climate normal period 1961 to 1990 and climate normal periods representative for the 2020s and 2070s; aggregated for river basins and subbasins.
For temperature, the observed time series are scaled by adding the respective difference between the future and present-day temperature as calculated by the GCM (Equation 4.1). For precipitation, observed precipitation time series are scaled by multiplication with the
EuroWasser: Baseline-A: A reference scenario of global change
4-4
respective ratio between future and present-day precipitation as calculated by the GCM (Equation 4.2) – an exception to this rule occurs when present-day precipitation is close to zero (< 1mm), in which case the respective precipitation rise is added. T scaled future
=
T CRU, present-day + ( T mean GCM future – T mean GCM present-day)
(4.1)
P scaled future
=
P CRU, present-day ⋅ ( P mean GCM future / P mean GCM present-day)
(4.2)
with
T P scaled future CRU, present day mean GCM future mean GCM present-day
- average monthly temperature [°C] - average monthly precipitation [mm] - monthly value in 30-year time series representing future decade - monthly value in observed 30-year time series (1961 to 1990) - monthly average of future decade as computed by GCM - monthly average of present-day climate as computed by GCM
Following this method, monthly values for 30-year climate time series are constructed for the 2020s (i.e. 1961-90 monthly values scaled to represent the 2020s) and the 2070s for both GCMs. Figure 4.1 depicts changes in long-term average annual precipitation for Europe as calculated by the two GCMs and as transposed to the 0.5° degree grid required as input for WaterGAP computations. Between the recent climate normal period (1961-1990) and climate normal conditions representative for the 2020s changes in precipitation amount to less than ten per cent for most of Europe under both GCMs. Changes are indicated to be more pronounced until the 2070s, with notable decreases in precipitation calculated by both GCMs for most of Southern Europe. Conversely, both GCMs agree in an increase in average annual rainfall for the northern parts of Russia and Scandinavia.
4.4
Socio-economic driving forces
The socio-economic driving forces affect the calculations of WaterGAP’s Global Water Use Model. A detailed description of this model is provided in Chapter 2 of this report. Here, only the aspects relevant for the Baseline-A scenario are considered. The sectoral water use submodels of WaterGAP rely on several socio-economic driving forces. Water use by sector is calculated as a product of water use intensities and the respective sectors’ main driving forces, i.e. population (for the domestic sector), electricity production (industry), and irrigated areas (irrigation). Additional driving forces determine how water use intensities change due to structural and technological changes. In the households and industry sectors structural changes are represented as a function of income. Also, assumptions as to the type of mathematical function that describe structural change in water use intensity with income, need to be specified to match scenario assumptions. In the irrigation sector water use intensities depend on the types of crops grown, and on climatic conditions. Further driving forces that need to be detailed are the assumed future rates of technological change in the individual sectors, which represent improvements in the efficiency of water use.
EuroWasser: Baseline-A: A reference scenario of global change
4.4.1
4-5
Population
The assumed trends in population for the Baseline-A scenario have been derived from the United Nations “medium” scenario, for which a time series of population by world-region with five-year steps between today (i.e. 1995) and 2100 is given (United Nations, 1992; Alcamo et al., 1998). To derive updated country-level population numbers consistent with these regional numbers, the country projections from the United Nations 1998 revision (United Nations, 1998) were scaled to match the Baseline-A scenario’s regional total population. The main reason for scaling the newer United Nations estimates to match the older regional values rather than implementing the newer projections, is to be consistent with the other driving forces derived from the Baseline-A scenario based on the older estimates. Also, the United Nations country projections only extend up to the year 2050. Thereafter, each country’s share within its respective world-region is held constant, such that population by country develops relative to the regional growth rates of the original Baseline-A scenario after the year 2050. Population distribution within countries is based on Gridded Population of the World (Version 1) data provided by the Center for International Earth Sciences Information Network (CIESIN). Under this scenario, population in Europe increases from 745 million in 1995 to 882 million in 2075; Table 4.1 summarizes the regional population figures of the applied scenario. Table 4.1: Total population [millions] in Europe following the Baseline-A scenario. World-region (*)
1995
2025
2050
2075
2100
Western Europe Eastern Europe European CIS
384 121 180
406 143 193
394 149 186
391 149 185
388 148 184
(*) World-regions are here defined as follows: Western Europe: Belgium, Denmark, France, Finland, Germany, Greece, Iceland, Ireland, Italy, Malta, Luxembourg, Netherlands, Norway, Portugal, Spain, Sweden, Switzerland, United Kingdom. Eastern Europe: Albania, Bosnia and Herzegovina, Bulgaria, Croatia, Czech Republic, Hungary, Poland, Romania, Slovakia, Slovenia, Yugoslavia. European CIS: Belarus, Estonia, Latvia, Lithuania, Moldova, Ukraine, European part of Russian Federation. Note that Turkey is not included in this table; this is due to lack of consistent historical and scenario driving force data making the estimates for Turkey less meaningful.
4.4.2
Income
For each of the thirteen world regions of IMAGE 2.1 assumptions on growth of income (gross domestic product GDP per capita) are based on IPCC-IS92a estimates until 2100. For most regions these estimates are lower than the historical trends. Nevertheless, they lead to substantial increases in GDP per capita world-wide. Despite assumed higher annual growth rates in today’s poorer regions, and thus a decrease in the relative gap between economies, the current large gap in absolute terms between Western and Eastern European countries will remain throughout the 21st century under the Baseline-A scenario.
EuroWasser: Baseline-A: A reference scenario of global change
4-6
In a preliminary step, the regional totals for GDP per capita given by IMAGE 2.1 are scaled such that they match present-day country income data (United Nations, 1997). For WaterGAP computations, the development of regional income then needs to be disaggregated to the country level. This disaggregation-procedure follows two criteria: a) We assume the incomes of individual countries within a specific world-region converges in the long-term, i.e. by the year 2100. By this, two countries within the same worldregion which have different income in 1995 (e.g. Spain, with 13 279 US$/cap, and Norway, with 31 550 US$/cap) would have the same income by 2100 (i.e. that of the respective world-region, in this case Western Europe with 96 177 US$/cap). The main reason for this criterion is to avoid an unreasonable widening of absolute income gaps within world-regions. b) A time series is derived to bridge today’s income and income assumptions for 2100. Therefore the income difference between individual countries and their corresponding world-region's average is assumed to reduce linearly with time. To complement the example given above: Spain’s income today (i.e. in 1995) is 6469 US$/cap lower than in the Western European average. Following this criterion, the gap would only be about half as wide by 2050 (i.e. 3185 US$/cap), and closed by 2100. By applying this procedure, GDP/cap in Western European countries increases between 1.1% (in today's richer economies) to 3% (Greece and Portugal) per year. Table 4.2 summarizes the regional figures for income of the Baseline-A scenario. Table 4.2: Average income [US$/cap] in Europe following the Baseline-A scenario. World-region (*)
1995
2025
2050
2075
2100
Western Europe Eastern Europe European CIS
19748 2037 3526
36271 7263 11430
54687 9977 15480
75392 13713 21045
96177 17500 26687
(*) Definition of World-regions as given in Table 4.1 above.
4.4.3
Electricity Production
Country projections of electricity production are derived following an approach similar to the income projections. The IMAGE 2.1 model computes electricity production [MWh] for each of thirteen world-regions. Similar assumptions are made for the change in future electricity intensity of economies [MWh/GDP] as are made for income above. Scenarios for countryscale electricity production are derived by combining the assumptions on future electricity intensity with scenarios of income. For Western Europe this first leads to an increase, peaking in the 2020s at about twothirds above today’s level of electricity production. Thereafter, electricity production slowly decreases in the Baseline-A scenario, falling even slightly below today’s total by the end of the 21st century. Conversely, in Eastern Europe and the CIS countries electricity continues to
EuroWasser: Baseline-A: A reference scenario of global change
4-7
increase, reaching more than six times today’s levels. Table 4.3 summarizes the regional figures for electricity production of the Baseline-A scenario. Table 4.3: Total Electricity production [GWh] in Europe following the Baseline-A scenario. World-region (*)
1995
2025
2050
2075
2100
Western Europe Eastern Europe European CIS
2378 405 902
3945 2048 2977
3588 2551 3575
2728 2718 4477
2036 2545 5164
(*) Definition of World-regions as given in Table 4.1 above.
4.4.4
Irrigated Areas
As irrigation water use makes up a large fraction of total water use, the rate of expansion of irrigated area is one of the main driving forces of water use scenarios. Unfortunately, the IMAGE 2.1 model does not explicitly deal with changes in the extent of irrigated land. For this reason, and because the future development of irrigation is unclear, we have here assumed no changes in irrigated area in Europe. Thus we base both the current and future extent of irrigated areas on the digital map provided by Siebert and Döll (2001).
4.4.5
Structural Change
The Global Water Use Model of WaterGAP assumes structural changes in the intensity of future water use. For the scenario analyzed here, we follow the approach applied in the World Water Vision’s Business-as-Usual scenario (Alcamo et al., 2000; Rjisberman, 2000). Future structural changes are thus assumed to follow curves consistent with historical trends (see Chapter 2). By this, water use intensities are approximated by a sigmoid function of income for the domestic sector and by a hyperbolic function of income for the industrial sector. In the irrigation sector, no changes in the mix of crops irrigated (regarding rice and non-rice crops) are assumed. Still, modeled water use intensities in the irrigation sector are bound to change with changing climate conditions.
4.4.6
Technological Change
Assumptions about future technological changes again base on the assumptions of the World Water Vision's Business-as-Usual scenario. In both the domestic and industrial sectors technological changes continue to reduce water use intensities all over Europe at the current estimated pace (about 2%/yr; see, e.g. Carr et al., 1990) until 2005 when the pace is assumed to slow down to 1%/yr following current trends in many areas of technology. After 2025 the pace is assumed to further slow down to then 0.5%/yr. Similarly, improvements in the water use efficiency in the agricultural sector continue to reduce water withdrawals by 0.3%/yr until 2025. In line with the assumptions made for other sectors, this halves to 0.15%/yr thereafter.
EuroWasser: Baseline-A: A reference scenario of global change
4.5
4-8
Conclusions
With the Baseline-A scenario, a consistent reference scenario of future changes in both climate and socio-economic driving forces is provided as a base for analyzing the impacts of global change on water resource systems. This reference scenario is embedded into a wider frame of global change assumptions, based upon a published integrated scenario. It is considered as an intermediate projection within plausible ranges of climate relevant emissions and related socio-economic factors. In this it largely follows current trends, while it assumes no special policy action to curb greenhouse gas emissions or to reduce water abstractions. Nevertheless, we caution the reader that these projections are based on one feasible set of assumptions only – many other projections of socio-economic driving forces are equally conceivable.
4.6
References
Alcamo, J., Henrichs, T., Rösch, T. (2000): World Water in 2025 – Global modeling and scenario analysis for the World Water Commission on Water for the 21st Century. Report A0002, Center for Environmental Systems Research, University of Kassel, Kurt-Wolters-Strasse 3, 34109 Kassel, Germany. Alcamo, J., Leemans, R., Kreileman, E. (1998): Global Change Scenarios of the 21st Century - Results from the IMAGE 2.1 Model. Elsevier, Oxford, U.K. Carr, J.E., Chase, E.B., Paulson, R.W., Moody, D.W. (1990): National Water Summary 1987. USGS Water Supply Paper 2350. USGS: Denver. Döll, P., Siebert, S. (2000): A digital global map of irrigated areas. ICID Journal, 49(2), 55-66. Gordon, C., Cooper, C., Senior, C. A., Banks, H., Gregory, J. M., Johns, T. C., Mitchell, J. F. B., and Wood, R. A. (2000): The simulation of SST, sea ice extents and ocean heat transports in a version of the Hadley Centre coupled model without flux adjustments. Climate Dynamics(16), 147-168. IPCC (Intergovernmental Panel on Climate Change) (2001): Climate Change 2001: Impacts, Adaptation, and Vulnerability - A Report of Working Group II of the IPCC. Cambridge University Press, U.K. IPCC (Intergovernmental Panel on Climate Change) (2000): Special Report on Emission Scenarios. Cambridge University Press, U.K. IPCC (Intergovernmental Panel on Climate Change) (1992): Climate Change 1992 - The Supplementary Report to the IPCC Scientific Assessment, Cambridge University Press, Cambridge, U.K. Kahn, H., Wiener, A. (1967): The Year 2000. MacMillan, New York, US. New, M., Hulme, M., Jones, P. D. (2000): Representing twentieth century space-time climate variability. Part II: Development of 1901-96 monthly grids of terrestrial surface climate. J. of Climate, 13, 2217-2238. Rjisberman, F. R. (2000): World Water Scenarios: Analyses, Earthscan Publications Ltd., London, U.K. Röckner, E., Arpe, K., Bengtsson, L., Christoph, M., Claussen, M., Dümenil, L., Esch, M., Giorgetta, M., Schlese, U., and Schulzweida, U. (1996): The atmospheric general circulation model ECHAM-4: Model description and simulation of present day climate. MPI -Report No. 218, MPI für Meteorologoie, Hamburg, Germany. Röckner, E., Bengstsson, L., Feichter., J., Lelieveld, J., Rohde, H. (1999): Transient changes with a coupled atmosphere-ocean GCM including the tropospheric sulfur cycle. Climate Change, 38, 307-343. Siebert, S., Döll, P. (2001). A Digital Global Map of Irrigated Areas - An Update for Latin America and Europe. World Water Series 4, Center for Environmental Systems Research, University of Kassel, Germany. United Nations (1998): Annual Populations 1950-2050 (The 1998 Revision). United Nations, New York, US. United Nations (1997): Statistical Yearbook 1995. United Nations Department of Economic and Social Affairs Statistics Division, New York, U.S. United Nations (1992): Long-range world population projections. Population Division Report United Nations Population Division, New York, U.S.