The International Archives of the Photogrammetry, Remote Sensing and Spatial Information Sciences, Volume XL-4, 2014 ISPRS Technical Commission IV Symposium, 14 – 16 May 2014, Suzhou, China
BASIC TECHNOLOGIES OF WEB SERVICES FRAMEWORK FOR RESEARCH, DISCOVERY, AND PROCESSING THE DISPARATE MASSIVE EARTH OBSERVATION DATA FROM HETEROGENEOUS SOURCES Victor Savorskiy a, *, Evgeniy Lupyan b, Ivan Balashov b, Mikhail Burtsev b, Andrey Proshin b, Vladimir Tolpin b, Dmitry Ermakov a, Andrey Chernushich a, Olga Panova a, Oleg Kuznetsov a, and Vladislav Vasilyev a a
Kotel’nikov Institute of Radioengineering and Electronics of Russian Academy of Sciences, Fryazino Department, Vvedenskogo sq., 1, Fryazino, Moscow region, Russia -
[email protected] b Space Research Institute RAS, 117997, 84/32 Profsoyuznaya Str, Moscow, Russia -
[email protected] Commission VI, WG VI/4
KEY WORDS: Services, Integration, Infrastructure, Distributed, System, Interface ABSTRACT: Both development and application of remote sensing involves a considerable expenditure of material and intellectual resources. Therefore, it is important to use high-tech means of distribution of remote sensing data and processing results in order to facilitate access for as much as possible number of researchers. It should be accompanied with creation of capabilities for potentially more thorough and comprehensive, i.e. ultimately deeper, acquisition and complex analysis of information about the state of Earth's natural resources. As well objective need in a higher degree of Earth observation (EO) data assimilation is set by conditions of satellite observations, in which the observed objects are uncontrolled state. Progress in addressing this problem is determined to a large extent by order of the distributed EO information system (IS) functioning. Namely, it is largely dependent on reducing the cost of communication processes (data transfer) between spatially distributed IS nodes and data users. One of the most effective ways to improve the efficiency of data exchange processes is the creation of integrated EO IS optimized for running procedures of distributed data processing. The effective EO IS implementation should be based on specific software architecture. 1. INTRODUCTION Both development and application of satellite Earth observation (EO) data involve a considerable consumption of material and intellectual resources. Therefore, it requires using high-tech means for EO data distribution in order to promote accesses for as much as possible number of researchers. It should be accompanied with creation of capabilities for potentially more thorough and comprehensive, i.e. ultimately deeper, complex data analysis enabling qualitatively new information about the state of Earth's natural resources. Objective need in a high quality of EO data assimilation is set by the principal features of satellite observations, namely by the fact that the objects under satellite observations are in uncontrolled state. To high extent the progress in solving this problem is determined by proper functionality of distributed information system (IS) which deals with satellite data assimilation and distribution while implementing long-term large-scale EO programs and missions. One of the most effective ways to improve the efficiency of data exchange processes is the creation of integrated EO IS optimized for running in distributed information environment, especially for special application procedures (e.g. see (Savorskiy, 2013)). Presented work is focused on developing software technologies that should lower the costs of user accesses to distributed EO information resources. Currently many EO IS already contain hundreds of terabytes or even some petabytes of data (Lupyan, 2012; Ramapriyan, 2011; Budget Activity, 2011) and are rapidly increasing (Lupyan, 2012). In most cases these data sets store data in form of multidimensional arrays as for example in
case of IS operating with hyperspectral data (Assefa M. Melesse, 2007; The CEOS database, 2014). So, disparate nature of EO information resources are now objective reality that requires taking into account needs for data integration in developing numerous modern applications based on EO data processing. This work proposes the upgraded virtual integration framework (UVIF) in order to solve the problems of effective data exchanges over distributed networks. The main purpose of the work is the design and development of the experimental sample of UVIF that provides users with remotely accessed interfaces, allowing not only search and retrieve EO products in distributed information system but also dynamically (in on-line mode) configure procedures for processing and presenting EO products. The experimental sample of UVIF uses software prototypes based on GEOSMIS (Savorskiy, 2012) and Stream Handler technologies (Ermakov, 2013). The basic aspects of implementation of these technologies in UVIF are considered in Section 2. Section 3 specifies the discussion with the case of UVIF mock-up optimized to work with hyperspectral data. Concluding remarks are summarized in Section 4.
2. UPGRADED VIRTUAL INTEGRATION FRAMEWORK (UVIF) 2.1 UVIF architecture Data integration was originally based on consolidation technology (Enterprise information management, 2013). But the consolidation technology has significant disadvantages. One of the most significant is the fact that in this case the addition of
* Corresponding author. This is useful to know for communication with the appropriate person in cases with more than one author.
This contribution has been peer-reviewed. doi:10.5194/isprsarchives-XL-4-223-2014
223
The International Archives of the Photogrammetry, Remote Sensing and Spatial Information Sciences, Volume XL-4, 2014 ISPRS Technical Commission IV Symposium, 14 – 16 May 2014, Suzhou, China
new data sources is coupled with new and often very significant budget spending comparable to the initial project spending. These circumstances, confirmed by our experience in application of consolidation technology, determined the choice of federalization, or virtual integration, technology to build advanced systems for satellite monitoring and exploring environment. In particular it has obvious advantages when we have to explore Earth surface using satellite data and auxiliary information from disparate information sources (e.g. see (Savorskiy, 2013)). When applying virtual data integration the user forwards queries for search and select data (only data!) via common distributed system interface. In this case data delivery from their places of permanent storage is done not through a single common repository, but directly from initial storage, i.e. in peer-to-peer mode. Keeping in mind a considerable increase in the volume of the primary satellite data and EO products (Savorskiy, 2013; Assefa M. Melesse, 2007; The CEOS database. 2014), one can conclude that eliminating the central data repository as the potential system bottleneck and as the functional redundancy should be regarded as a significant advantage of the virtual integration.
A significant advantage the virtual service integration system is that it provides system tools for the distributed data processing. For this purposes user requests include the georeferenced description of the analyzed data sets (e.g. references to a shape file). A data server should provide the correct interpretation of these georeferenced data and the formation of dynamically handling procedures (including procedures for statistical analysis of data from individual spatial plots, described by individual shapes). Only processing results (data products) are returned to the user (by default). Obviously, this approach significantly decreases the overall time required for receiving data products, since massive raw data exchanges are excluded. 2.2 GEOSMIS technology user interface In developing GEOSMIS technology (Savorskiy, 2012b) particular attention was drawn to the issue of designing the structure of interfaces aimed to work with data sets. Taking into account needs in reasonably clear and user-friendly interfaces which should support operations with different-type quickly updated spatial data, it was necessary to develop some general approaches to allow user easily navigate interface content. To this end the basic type of Web interface was designed, which main structure elements are shown in Figure 2.
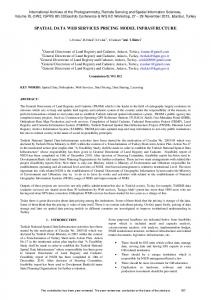
Virtual integration technology can be realized not only as the virtual data integration, but also as the virtual service integration, or virtual data and service integration. In this case, the optimization of data streams could be achieved not only by eliminating the bottlenecks in distributed system data transfers, but also via minimization of initial data traffic. This is due to the fact that only the products of high processing levels describing only objects under investigation form the traffic. For example, during the analysis of remote sensing data for forest cover it is reduced up to 10 times (Savorskiy, 2013). Architecture design of the virtual integration system in this generalization (including services) case is very close to formal virtual data integration architecture (Bertossi, 2004). As a consequence distributed service is realized in the framework of the general paradigm of user-mediator-wrapper-data_source (see Figure 1) virtual integration approach.
Figure 2. Basic structure of GEOSMIS user’s interface (Savorskiy, 2012b) In order to support operations with different data types, GEOSMIS user’s interface (GeoUI) controls have a block structure. Each data type and typical control function matches its own module in GeoUI. At user level the appropriate tabs for each module and each data type are designed in GeoUI. To work comfortably with multi-temporal datasets GeoUI realizes unified blocks which allow managing satellite data of different types as well as the results of their processing, e.g. working with: data of high spatial resolution displayed by quite localized scenes; data of coarse and moderate resolution with their characteristic units, “sessions”, covering large areas; series of temporal and spatial composites of various products of satellite data processing.
Figure 1. Upgraded virtual integration architecture (UVIF) (Savorskiy, 2013)
There’s also a special opportunity in GeoUI to sample different types of data layers to perform their joint analysis. Selected data layer controls are collected in a separate tab which, depending on the specific task of the interface instance, allows performing certain operation on that data collection.
This contribution has been peer-reviewed. doi:10.5194/isprsarchives-XL-4-223-2014
224
The International Archives of the Photogrammetry, Remote Sensing and Spatial Information Sciences, Volume XL-4, 2014 ISPRS Technical Commission IV Symposium, 14 – 16 May 2014, Suzhou, China
Typical samples of tabs to manage such types of data are presented in (Savorskiy, 2012b).
Preserving the virtual integration architecture local Web services using GEOSMIS technology was built. It allows us to get to disparate information resources via uniform global interface enabling data accesses to local heterogeneous information sources using HTTP protocols. As shown in Figure 4 three types of Web services are included in GeoUI software package: Map data Web service (swismap object and map service); Metadata Web service (swismeta object and metadata service); Data management Web service (Wrapper (!) and data management service). 2.4 Upgrading UVIF instrumentation by Stream Handler (SH) technology
Figure 3. Examples of special information panel for data analysis Along with typical ones GeoUI software allows to construct special panels and their pans, aimed to support data analysis procedures. Implemented examples of special information panels are shown on Figure 3 below. There are presented panels, aimed to deal with multichannel satellite data: 1) color synthesis and contrast management; 2) management and multiyear statistical analysis of forest fire over Russian territory; 3) insertion and management of spatial objects and estimation of their parameters, in particular for wood stock estimation for given forest plot; 4) management of forest fire evolution model. 2.3 UVIF architecture implemented by GeoUI software We use GeoUI software to implement UVIF architecture principles. The internal UVIF architecture implemented via GeoUI software is presented in more detail in Figure 4. It reveals roles of supporting services in implementing UVIF approach and specifies application of GEOSMIS software packages. Global
Web interface
Global schema
Execution engine
Source description
Local Global Metadata Global
(smismeta object)
Global Global Wrapper
Map (smismap object)
Smiswms active services getMetadata metadata service
getFeatureInfo data management service
getMap map service
Figure 4. General web-interface architecture, basic elements
One of the crucial factors for effective operating of IS working with massive EO data arrays is the ability to detect and adequately response to some significant features of the data indicating the development of a process and/or change of the characteristics of object under observation. To meet this demand the advanced IS must be based on the event-driven model as proposed and mathematically described in (Savorskiy, 2012a). Software realization of the event-driven model requires implementation of parallel distributed processing of the EO data flows: some data should be (at least primarily) processed and/or analyzed remotely to avoid ineffective exchange of massive data arrays via networks. A feasible approach considered in this work is based on the Stream Handler (SH) technology. SH is generic software architecture to design and develop the applications of parallel distributed processing (Stream Handler, 2014). It is founded on the representation of a processing algorithm as a graph (flowchart) capable for independent execution through parallel branches. Structural elements of the system are processing nodes (“gadgets”) with inputs and outputs (“pins”) and edges (“wires”) describing the algorithm logic and providing the data exchange mechanism. Gadgets are the abstraction of the operations over data subdivided into three main categories: “captures” perform data input from files or other sources (including peripheral devices and network); “filters” implement various operations of data processing; “monitors” perform data visualization (rendering), record them into files, transfer them via exchange buffers to some other applications and/or output to peripheral devices. Most gadgets have parametrical description and can be tuned individually. Here we discuss a sample implementation of the event-driven IS software prototype to monitor and respond to the catastrophic events (earthquakes). The sample is based on the following model scenario. As some catastrophic event (e.g., an earthquake) happens, researchers’ activity (requests to the IS) is changing to reflect growing interest to particular time range, area and EO data types. To face the redistribution and possible increase of the load the IS must rearrange the archived data by their accessibility in advance (Savorskiy, 2012a). The IS module responsible for detecting “significant” events and initiating the recalculation of priorities of the archived data accessibility was prototyped on the basis of SH technology. The module works with the actual information from the server of geophysical service of RAS (Geophysical survey, 2014) which
This contribution has been peer-reviewed. doi:10.5194/isprsarchives-XL-4-223-2014
225
The International Archives of the Photogrammetry, Remote Sensing and Spatial Information Sciences, Volume XL-4, 2014 ISPRS Technical Commission IV Symposium, 14 – 16 May 2014, Suzhou, China
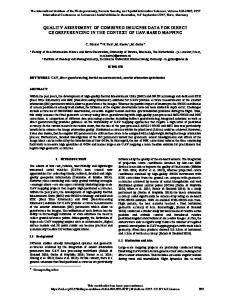
aggregates information on all earthquakes and provide on-line access to the list of “events” ranged by time, area, intensity etc. The processing graph of the IS event-driven module is illustrated in the Figure 5.
problem may be solved without reorganizing the existing data archives and other EO data disparate sources by implementing SH-compatible plug-ins at server side to provide network interface between SH-based client solution and the remote data source. Second, the considered example showed that the practical SH solution of a particular EO task can be designed, tested, debugged and implemented mostly on the basis of the existing “standard” gadgets the SH libraries due to the generic flexibility of the gadgets of flow-chart description. However the demand in new gadgets can appear and be successfully resolved with the means provided by SH technology (as in case of gadget “2” of the considered example). 2.5 SH technology application features
Figure 5. Event-driven IS prototyped on SH technology The module is shown during its execution in the special developer media for visual design, testing and debugging the software solutions built on SH technology. The main pane visualizes the processing graph. Gadgets are the square boxes; straight lines connecting them are wires. Numbers over gadgets denote the following operations. “1” denotes a capture gadget which generates a text string with a selected periodicity. It is used to generate a periodical request to the CEME server (see above). The request is visualized in the setup dialog window just below the gadget box. The generated string is passed to the gadget “2” which performs the data exchange with CEME server via network. It is the only “non-standard” (not contained in the SH libraries) gadget in this prototype and was designed using SH gadget wizard and high-level (C++) programming. It receives the CEME server response in html format and passes it to the gadget “3”. Gadget “3” extracts fragments of text matching a given template. A specific template was takes into account the CEME server table format for automatic extraction of the parameters of the registered earthquakes (location, time, intensity etc). Gadget “3” passes the processing results to the two gadgets. Gadget “4” allows for visual control, providing the text output into a text monitor (its window is to the right of the gadget box). Gadget “5” discriminates “non significant events” (by intensity threshold) and transmits the significant ones. Gadget “6” is a placeholder for the “response” of a fully operating IS. However in this prototype the gadget “6” just passes the obtained data to the monitors for visualization. These monitors are conditionally represented by gadget “(7)” connected to the gadget “6” with a dotted wire. The actual functionality of the module prototype in this example is this limited to the first 5 gadgets, demonstrating the principal ability of data exchange with external data source and performing an online processing of disparate data to form an adequate and fast IS response to some critical event. It is important to emphasize some features of the implemented software prototype. First, the successful implementation was feasible due to the fact that the information on the earthquakes was primarily integrated, preprocessed and represented in a compact ready-to-use form in the server of the external data source (CEME server). This demonstrates the advantage of remote (and distributed) data processing. Not all servers and web portals provide enough functionality to preprocess the EO data in the way necessary for the researcher task. However this
The ease and effectiveness of SH technology for practical EO applications strongly depends of the models of internal data and operations presentation. SH describes and implements several basic data types and allows introducing new ones. Basic SH data types are video frames and raster images, text strings, rectangles and other shapes, numbers (integer and fractional) and arrays, and others (Boolean, audio data, metafiles, clock pulses). A specific type of data is a “container” which consists of references to other data portions (“packets”) as well as nested containers. Containers allow modeling tree data structures of arbitrary depth of nesting and are an important tool of data synchronization through logical combination of data packets in a set with common identifier and time of generation. As it can be noticed from previous section, the set of used gadgets and established connections (wires) between them fully describe the solution algorithm in SH technology. SH has a simple scripting language composed of elementary commands of flow-chart modifications. Such a description can be saved in a file (script) and used for multiple runs of the graph or its implementation as one of the modules in a more complex distributed system. For design, debug and testing purposes it is convenient to use the special SH developer media, SH Studio, providing friendly interfaces in visual programming concept (see Figure 5). A very important feature of SH technology is the opportunity to edit and set-up the flow chart during execution. It can be used both at design and debugging time, and during the actual functioning in order to implement flexible scenarios modifiable and self modifiable in response to incoming data. Standard SH libraries contain collection of gadgets which implement most general and commonly used operations over data. At the same time SH libraries fix the standard of creation and exchange of the executable code in the SH system, and are the tool for integration new gadgets designed by researches into the system. Practical implementation often requires the use of some specific operations. To this end SH contains the tools to design and implement new gadgets. To facilitate this procedure SH provides the wizards for library and gadgets development integrated with Microsoft Studio 2008 and Microsoft Studio 2010. This option was used to create gadget “2” discussed in the previous section.
3. UVIF MOCK-UP OPTIMIZED TO WORK WITH HYPERSPECTRAL DATA Web services framework was implemented in form of UVIF mock-up optimized to work with hyperspectral data (HSD) arrays ensuring high performance user access necessary for
This contribution has been peer-reviewed. doi:10.5194/isprsarchives-XL-4-223-2014
226
The International Archives of the Photogrammetry, Remote Sensing and Spatial Information Sciences, Volume XL-4, 2014 ISPRS Technical Commission IV Symposium, 14 – 16 May 2014, Suzhou, China
effective scientific studies of Earth's natural resources. Developed mock-up allows: 1. To search, locate, and visualize the parameters of energy active zones of anthropogenic origin using HSD (see comparison of multispectral and hyperspectral images on the interfaces built on GEOSMIS technology in Figure 6). 2. To map EO data (including HSD) combined with auxiliary information (see the combined presentation of hyperspectral (Sensors - Hyperion, 2011) and multispectral (Landsat) images combined with forest fire descriptive information in Figure 6);
spectral profiles of the object of satellite monitoring in Figure 9).
Figure 7. Interface of dynamically generating tools for HSD analysis built using Stream Handler technology
Figure 8. Formation of Hyperion (Sensors - Hyperion, 2011) spectral scanning of HSD and selection of informative bands 6.
To provide remote access to the HSD resources for browsing and selection of HSD subsets, generation of procedures of their processing and delivery of the processing results to clients (see results of Hyperion (Sensors - Hyperion, 2011) spectra invocation for different zones of forest fire area in Figure 10).
Figure 6. GeoUI equipped with hyperspectral analytic tools: upper image - Landsat -5 (Landsat-4 and -5, 2008) 09.06.2011, lower image - Hyperion (Sensors - Hyperion, 2011) 08.06.2011. 3.
4.
5.
To dynamically build interfaces using the SH technology which allow visualization and monitoring of various processes, including geothermal, over the controlled area; Using Hyperion HSD (see the flow chart of HSD analysis on SH technology in Figure 7), to incorporate the SH technology into the HSD IS, providing the dynamic HSD browsing (see example of browsing Hyperion (Sensors - Hyperion, 2011) data in Figure 8). To elaborate tools of remote managing of HSD processing including the procedures of selecting HSD subsets from initial HSD arrays invoking additional information (geographical, geophysical, historical, insitu, independent remotely obtained) and procedures of dimensionality reduction of these data at the provider’s side (see the improved interface of the Vega system (Vega, 2014), allowing analyzing the
4. CONCLUSIONS The results of the work present guidelines for development and description of Updated virtual integration framework (UVIF) based on GEOSMIS and SH technologies. It includes: 1. core architecture description which implements virtual integration services for distributed EO databases and archives addressing the problems of environmental monitoring, 2. guidelines for construction of UVIF web-interfaces enabling monitoring the natural environment, 3. description of the GEOSMIS and SH implementation of elaborated architecture conception enabling fast and effective development of UVIF mock-up, 4. UVIF mock-up optimized to work with high dimensional hyperspectral data arrays enabling high performance remote user accesses necessary for effective scientific studies of Earth's natural resources, 5. examples of HSD analysis conducted with use of UVIF mock-up.
This contribution has been peer-reviewed. doi:10.5194/isprsarchives-XL-4-223-2014
227
The International Archives of the Photogrammetry, Remote Sensing and Spatial Information Sciences, Volume XL-4, 2014 ISPRS Technical Commission IV Symposium, 14 – 16 May 2014, Suzhou, China
Figure 9. Hyperion (Sensors - Hyperion, 2011) spectral profile recovering. resources of the Earth remote sensing based on the Stream Handler technology. Modern problems of Earth’s remote sensing from space. V. 10. No.4. PP.118-126. Geophysical survey. 2014. http://www.ceme.gsras.ru. Accessed 21.03.2014. Landsat-4 and -5, 2008. http://www.eoportal.org/directory/ pres_Landsat4and5.html. Accessed 21.03.2014.
Figure 10. Hyperion (Sensors - Hyperion, 2011) spectral profiles in the area of forest fire. ACKNOWLEDGEMENTS Work is supported by RFBR grants No. 13-07-00513 A and 13-07-12116 ofi-m. Landsat and Hyperion data available from the U.S. Geological Survey.
Lupyan E.A., Savorskiy V.P., Sholin Yu.I., Aleksanin A.I., Nazirov R.R., Nedoluzhko I.V., Panova O.Yu., 2012. Up-todate approaches and technology arrangement of Earth observation data applications aimed to solve scientific tasks. Modern problems of Earth’s remote sensing from space. V. 9. No.5. PP. 21-44. Ramapriyan H. K., 2011. Development, Operation and Evolution of EOSDIS – NASA’s major capability for managing Earth science data. Presented at CENDI/NFAIS Workshop on Repositories in Science & Technology: Preserving Access to the Record of Science 30.11.2011. Savorskiy V., Tishchenko Yu., 2012a. Enhancement of spatial database archive services for disaster response. Applied Geomatics. V.4. Issue 4. PP. 269-277.
REFERENCES Assefa M. Melesse et al, 2007. Remote Sensing Sensors and Applications in Environmental Resources Mapping and Modelling // Sensors, No.7, 3209-3241. Bertossi L., Bravo L., 2004. Consistent Query Answer in Virtual Data Integration Systems. In: Inconsistency Tolerance. Bertossi el al. (Eds.), LNCS 3300, pp.42-83
Savorskiy V.P. et al, 2012b. Distributed infrastructure enabling effective integration of Earth observation information resources for collective solution of archiving, searching, processing and EO data analyzing tasks. Int. Archives of the Photogrammetry, Remote Sensing and Spatial Information Sciences, Vol. XXXIX-B4, PP.237- 242.
Budget Activity: National Environmental Satellite, Data, and Information Service, 2012. http://www.corporateservices.noaa.gov/nbo/fy13_presidents_bu dget/7_NESDIS.pdf. Accessed 18.01.2013
Savorskiy V. et al, 2013. Complex Analysis of Optic and Radar Data Observed for Forest Landscapes // Proc. ‘ESA Living Planet Symposium 2013’, Edinburgh, UK 9–13 September 2013 (ESA SP-722, December 2013). CD-ROM.
The CEOS database, 2014. http://database.eohandbook.com /timeline/timeline.aspx. Accessed 21.03.2014.
Sensors - Hyperion. 2011. hyperion. Accessed 21.03.2014.
Enterprise information management. http://www.tern.ru/eim. Accessed 21.03.2014.
Stream Handler. 2014. Accessed 21.03.2014.
2013.
Ermakov D.M. et al, 2013. The implementation of event-driven architecture for rapid collective access to the information
https://eo1.usgs.gov/sensors/
http://www.streamhandler.com.
Vega, 2014. http://sci-vega.ru. Accessed 21.03.2014.
This contribution has been peer-reviewed. doi:10.5194/isprsarchives-XL-4-223-2014
228