BASIL: Effective Near-Duplicate Image Detection using Gene Sequence Alignment Hung-sik Kim 1 , Hau-Wen Chang 1 , Jeongkyu Lee 2 , and Dongwon Lee
3?
{hungsik, hzc120, dongwon}@psu.edu,
[email protected] 1
Computer Science and Engineering, Penn State University, USA Computer Science and Engineering, University of Bridgeport, USA 3 College of Information Sciences and Technology, Penn State University, USA 2
Abstract. Finding near-duplicate images is a task often found in Multimedia Information Retrieval (MIR). Toward this effort, we propose a novel idea by bridging two seemingly unrelated fields – MIR and Biology. That is, we propose to use the popular gene sequence alignment algorithm in Biology, i.e., BLAST, in detecting near-duplicate images. Under the new idea, we study how various image features and gene sequence generation methods (using gene alphabets such as A, C, G, and T in DNA sequences) affect the accuracy and performance of detecting near-duplicate images. Our proposal, termed as BLASTed Image Linkage (BASIL), is empirically validated using various real data sets. This work can be viewed as the “first” step toward bridging MIR and Biology fields in the well-studied near-duplicate image detection problem. Key words: Image Matching, CBIR, NDID, BLAST, Copy detection
1
Introduction
Determining if two images are similar or not is a frequently studied task in the Contents-Based Image Retrieval (CBIR) problem. In particular, the task of detecting near-duplicate images becomes increasingly important in many applications of Multimedia Information Retrieval (MIR) – e.g., detecting illegally copied images on the Web [6] or detecting near-duplicate keyframe retrieval from videos [14]. We refer to such a problem as the Near-Duplicate (ND) problem, informally defined as follows: Near-Duplicate Problem. Given a set of query images Iq and a collection of source images Is , for each query image iq (∈ Iq ), find all images, Ir (⊆ Is ) that are “near-duplicate” to iq . Depending on the types of duplicate images, ND problem can be classified into two folds: (1) Near-Duplicate Keyframes (NDK) [8, 13, 14], and (2) NearDuplicate Image Detection (NDID) problems. Generally, NDK is defined as a ?
Partially supported by NSF DUE-0817376 and DUE-0937891 awards.
pair of keyframes captured from a video, where the two keyframes are “nearduplicate” each other. On the other hand, NDID is a problem of detecting “nearduplicate” images for a query image from a source database. Despite many solutions to the NDID problem (to be surveyed in Section 2), by and large, contemporary solutions have focused on how to identify ND images accurately and efficiently by designing new algorithms, data structures, or models in a particular application or context. However, it is hard to apply newly-developed solutions to new data sets of different scenarios, let alone using additional tools to visualize or analyze the results further. One way to approach the problem is to develop a suite of NDID algorithms and tools for “generic” usage so that the developed solutions can be used in a variety of situations by many users [7]. Another way is to extend an existing generic solution to solve the NDID problem so that one can leverage on the development of the generic solution and its user base [2]. In this paper, we take the latter approach and apply one of such popular and generic solutions drawn from Biology, called BLAST (B asic Local Alignment S earch T ool) [1] to solve the NDID problem. The BLAST, developed in 1990, is one of the most popular (and best cited) algorithms for aligning biological sequence information such as nucleotides of DNA sequences and amino acid sequences of proteins. Our decision to use BLAST for the NDID problem is based on the observations that: (1) Both NDID and gene sequence alignment problems can be variants of approximate pattern matching. By characterizing and converting image features into one-dimensional sequence of gene alphabets, NDID problem can be solved as the approximate pattern matching; (2) The alignment results from BLAST provide a robust and fast similarity measure of S-score as well as a sound reliability measure of E-value with a statistical guarantee; and (3) BLAST has a wealth of advanced algorithms (e.g., nucleotide-nucleotide, protein-protein, protein-nucleotide, and position-specific version), implementations (e.g., NCBI BLAST, FPGA-based BioBoost BLAST, and open source versions), and tools (e.g., KoriBLAST for visualization and Parallel BLAST for parallel processing) to leverage on. Therefore, one can have an immediate access to a vast number of tools with successful transformation from NDID problem to gene sequence alignment problem. The preliminary BLAST-based algorithm was on [9], but simple conversion between image features and genes was only introduced. In addition, the algorithm addressed the CBIR problem, but not the NDID problem. Compared to existing state-of-the-art NDID solutions, BASIL has several important benefits: (1) Flexibility by converting any set of image features into gene sequences using our proposed CC table and scoring matrix; (2) Effectiveness by taking the advantages of using BLAST algorithm; (3) Scalability by dealing with sequence database that is usually more compact than image database.
2
Background
Table 1 shows the summary of a few representative solutions to the three variations of ND problem – NDID, NDK and CBIR. The third and fourth columns
Problem NDID
NDK
CBIR
Paper CIVR07 [6] WWW08 [10] MIR07 [5] MM04 [8] MM04 [13] CIVR07 [15] MM07 [12] ITM07 [14] CIKM08 [11] EDBT09- [4] MM08 [3]
Descriptor Matching Data sets Metric g/l feature L2 /point matching create own with editing PR g feature clustering SapmArchive accuracy l feature clustering create own with editing PR l feature point matching create own with editing PR key points likelihood ratio TRECVID 2003 PR key points point matching TRECVID 2006 PR g/key points Euclidean/point matching create from videos PR key points point matching TRECVID 2003 P(k) key points k-NN search Yorck (art images) PR g feature k-NN search CoPhIR Hit ratio key points L2 /cosine similarity Caltech-101 ROC g(Global), l(Local)
Table 1. Survey of representative solutions to the Near-Duplicate problems.
describe the descriptors and the matching methodology, respectively. In addition, data sets and evaluation metrics are indicated at the fifth and sixth columns of the table, respectively. Recently, the task of determining if two images are near-duplicate or not, i.e., the NDID problem, becomes increasingly important in many applications. In general, such research on the NDID problem falls in two groups: global feature and local feature based approaches. The global feature based approach utilizes the similarity of two images using extracted feature vectors. For the similarity measure, most of CBIR methods can be used, such as color, texture, and shape. However, due to the nature of CBIR system, they are very sensitive to small changes such as illumination or geometric distortion. The local feature based approach focuses on partial areas of image, i.e., keypoints, that can represent the characteristics of the entire image [8, 14]. To detect near-duplicated images, these approaches measure the similarity between two images by matching the keypoints [8, 6] and clustering the feature vectors [5, 10]. By and large, the NDK problem has been studied more extensively than the NDID problem has. The reasons include: (1) more clear problem definition (i.e., keyframe matching for videos), (2) availability of benchmark data sets (e.g., TRECVID), and (3) existence of many real applications (e.g., video search and copied video detection). However, it has been considered as the same problem as the NDID problem in literature. As shown in Table 1, almost all the approaches in the NDK problem [13, 15, 14] are based on key points, i.e., point of interests or local descriptors, and point-wise matching, such as Locality Sensitive Hashing (LSH). Only a few of them consider both global and local features [12]. Due to the nature of the NDK problem, i.e., captured from a video, TRECVID data sets are mostly used for their evaluation. Note that the focus of our study is not to study the effectiveness of particular features for ND problems. Instead, in this paper, we study the feasibility of using 1-dimensional gene sequences as a way to represent images and compare their similarities fast.
3
BASIL: The BLASTed Image Linkage
In order to address the NDID problem, we propose BLASTed Image Linkage (BASIL) by adapting the BLAST algorithm. We believe that BLAST fits the
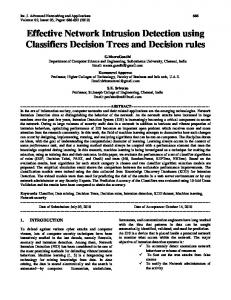
(a) Example images and sequences
(b) Example of Sequence Alignment
Fig. 1. Sequence Alignment Example.
NDID problem well for many reasons. In general, near-duplicate images tend to have near-identical characteristics which in turn are mapped to a long gene sequence of identical alphabetical “hits.” Figure 1(a) illustrates an example of two ND images. The image on the right is modified from the one on the left via operations such as changing contrast, compression and adding logo. The protein sequences below images are generated by BASIL using Y component in YUV color domain. The similarity of the two sequences is and iq can be evaluated by means of a local alignment (e.g., Smith-Waterman) algorithm. In the algorithm, the alignment is operated on twodimensional matrix S in which each cell S(i, j) keeps a score of the current matching. S is initialized with S(i, 0) = 0, 0 ≤ i ≤ |iq | and S(0, j) = 0, 0 ≤ j ≤ |is |, and is built as follows: S(i − 1, j − 1) + s(iq (i), is (j)) max0≤k≤i−1 {S(k, j) − σ(i − k)} , 1 ≤ i ≤ |iq | and 1 ≤ j ≤ |is | , S(i, j) = max max0≤k≤j−1 {S(i, k) − σ(j − k)} 0 where s(iq (i), is (j)) is the pairwise score of i-th letter of iq and j-th letter of is in scoring matrix, σ(k) is the gap penalty of a gap of length k. Figure 1(b) shows the result of the alignment of the two sequences. By utilizing BLAST, alignments can be done much faster than the dynamic programming algorithms. Moreover, single BLAST query can match a sequence against the whole database of sequences, and find the similar sequences instead of pairwise matching in such algorithms. 3.1
Overview of BASIL
Figure 2 shows the overview of the proposed BASIL framework. First, for each image is (⊆ Is , source image set), we extract a set of features, F, and transform F to a (either DNA or protein) gene sequence, ss . All the generated sequences are stored in the BLAST database D. Similarly, a query image iq is also transformed
to a corresponding gene sequence sq . Then, using the BLAST algorithm and an appropriate scoring matrix, sq is compared to sequences in D and top-k nearduplicate sequences (and their corresponding images) are returned as an answer. When we genBLAST Source images, Is CC Table Gene sequence erate gene sequences Feature 1 ACACGTTTTAGCA Store BLAST AATCATGGTTACT from images, dess Feature 2 GAGACTGGTACTA Sequence CCTTTACGGTTAC pending on how Database (D) TGCCACTATTCTA GCCCTTGCGCTAG Feature n we translate which ss sq of the extracted Query image features, images Scoring Return a set of nearMatrix we end up with Iq duplicate images , Ir different gene representations. In Fig. 2. Overview of BASIL. particular, since it is difficult to find a set of image features that work universally well for all data sets, it is important to devise a solution orthogonal to the choice of image features. Toward this first challenge, we propose the Composite Conversion (CC) table that contains both pre-defined conversion rules and candidate image features so that users can select desirable features and gene sequences depending on a given data set (see Section 3.2). In addition, the second challenge is to devise solutions in BASIL such that the kernel of BLAST algorithm and implementation should not be changed to make existing tools remain useful. Instead, our proposal sits atop BLAST algorithm and manipulates query and source image sequences. For instance, the scoring matrix (that reflects the similarity between different gene alphabets) used in BLAST is originally adjusted to the Biology domain. Therefore, we propose variations of new scoring matrices that reflect the characteristics of near-duplicate image matching scenarios (see Section 3.3). 3.2
The Composite Conversion (CC) Table
ND images are often created by deliberate editing methods (e.g., changing colReturn matched images with top-k, Ir ors/contrasts or cropping images), involuntary distortion (e.g., changing format/size) and variations of capturing conditions (e.g., different angle/time). To find appropriate features for BASIL, therefore, we have tested and selected a variety of features of three groups: color-based (FC , Y in Y Cb Cr and H in HSV ), texture-based (FT , edge density by Law’s texture energy), and semantic (FS , keywords and annotations) features. Each image, i, will be divided to some blocks, say 16 × 16 macro blocks, and both color- and texture-based features are computed within a macro block while semantic feature is computed from associated keywords or annotations of i. Then, the feature set, F, is the union of FC , FT , and FS . In order to generate the gene sequences from F, we consider two types of sequences used in BLAST: (1) a protein sequence is made of 23 alphabets (i.e., A, B, C, D, E, F, G, H, I, K, L, M, N, P, Q, R, S, T, V, W, X, Y, and Z), while (2) a DNA sequence is made of four gene alphabets (i.e., A, C, G, and T). BASIL can take both protein and DNA sequences.
letter Pro. DNA letter Pro. DNA A A AAC N N CAG B B AAG O Y CAT C C AAT P P CCC D D ACC Q Q CCG E E ACG R R CCT F F ACT S S CGC G G AGC T T CGG H H AGG U Z CGT I I AGT V V CTC J X ATC W W CTG K K ATG X X CTT L L ATT Y Y GAC M M CAC Z Z GAG
n-Value Pro. DNA n-Value Pro. DNA 0∼δ A AAC ∼ 13δ L ATT ∼ 2δ R CCT ∼ 14δ K ATG ∼ 3δ N CAG ∼ 15δ M CAC ∼ 4δ B AAG ∼ 16δ F ACT ∼ 5δ D ACC ∼ 17δ P CCC ∼ 6δ C AAT ∼ 18δ S CGC ∼ 7δ Q CCG ∼ 19δ T CGG ∼ 8δ Z GAG ∼ 20δ W CTG ∼ 9δ E ACG ∼ 21δ Y GAC ∼ 10δ G AGC ∼ 22δ V CTC ∼ 11δ H AGG ∼ 23δ X CTT ∼ 12δ I AGT ∼ 24δ
(a) Mapping chart for FC and FT (σ =
1 ) 23
(b) Mapping chart for FS
Phase 1 : feature selection Phase 2 : mapping Phase 3 : adding prefix Feature protein & extraction gene DNA Mapping chart 1 Feature 1 : Y component Feature 2 : H component Feature 3 : S component Feature 4 : V component Feature 5 : Edge density … Feature n : annotation
0~0.043 ~0.087 ~0.130 ...
A G C
...
Mapping chart 2 A B C ...
A G C
Y H S V Edge ...
Y H S V E
Annot.
A
AA AC AG AT CG ... TT
Phase 4 : combining all sequences for selected features
(c) The Composite Conversion Table Fig. 3. The CC table with two mapping charts.
The Composite Conversion (CC) table, as illustrated in Figure 3(c), contains various image features and two mapping charts. A mapping chart in Figure 3(a) is used for mapping numeric values obtained from image contents, while another in Figure 3(b) is for literal words obtained from descriptive annotations. For FC and FT , we use the normalized values to use the same mapping chart in Figure 3(a). Since we have 23 gene alphabets for protein, for the best transformation of feature values, we place the normalized real values to 23 bins, as shown in Figure 3(a). For DNA gene sequences, since 4 gene letters are not enough to express 23 bins, 3-bit combination of 4 letters is used for each bin. For FS , similarly, each literal alphabet is mapped to gene alphabet(s) by pre-defined rules, as shown in Figure 3(b). For protein sequences with 23 protein letters, we add 3 more artificial letters (X, Y, and Z) to have 1-to-1 mapping to 26 literal alphabets. For DNA sequences, we use 3-bit combination letters with A, G, C, T. Figure 3(c) shows the four phases of the CC table to generate the final gene sequences: – Phase 1 (Feature selection & extraction) Among all available image features, a set of features are selected (by users) and normalized. The selection of features depends on the availability of features as well as the characteristic of the given image sets. In addition, the size of a macro block that determines the length of gene sequences is fixed.
– Phase 2 (Mapping to gene letters) According to the mapping tables in Figure 3(a), the normalized feature values from Phase 1 are mapped to appropriate gene letters. If semantic features are used in Phase 1, for instance, they are also mapped to gene letters using Figure 3(b). At this phase, one can decide whether to use DNA or protein genes as the final representation. – Phase 3 (Adding prefix) Because of the limitation of gene alphabets, the same gene letters can be used in different features. For ensuring stronger connection within the same features, therefore, each letter from phase 2 is combined with corresponding letters representing a specific feature, as shown in Figure 3(c). This phase can be skipped if only one image feature is selected in phase 1. – Phase 4 (Combining all features) All gene sequences from different features are combined. The final output sequence of the CC table thus captures all features of an image holistically. This phase is also skipped if only one image feature is selected in phase 1. Since an individual feature in a CC table is very independent, the features in a CC table can be obtained by separating homogeneous components of an image such as color components. With the same reason, the features in a CC table can be acquired very heterogeneously. For example, all of image color components, texture information, meta data (such as resolution, format, and date), and annotations can be included as features in a CC table. The final gene sequence of an image captures all selected homogeneous and heterogeneous components, and is passed through BLAST to compare all features at once. 3.3
The Scoring Matrix
When two sequences are compared in BLAST, a similarity score is computed to quantify the quality of the pair-wise alignments. For this task, BLAST uses a scoring matrix that includes all possible pair-wise scores of letters in 2-dimensional matrix. For the scoring matrix, Percent Accepted Mutation (PAM), and BLOcks SUbstitution Matrix (BLOSUM) derived from theoretical or empirical frequencies of amino acid substitutions are popular. Since both matrices are originally created for biological data in mind, they are not suitable for BASIL with image data. Therefore, we propose to use new scoring matrices: (1) Uniform matrix assigns uniform score for each identity and substitution. For example, “1” is assigned for all identities (i.e., diagonal), and “-1” is assigned for the others of the matrix; and (2) Gaussian distributed matrix: The uniform matrix cannot capture the diverse characteristics of features used in BASIL. For example, red and orange colors are more similar than red and blue in terms of hue (H) color domain. In general, the gaussian distributed matrix is good for numeric features, such as FC and FT . There are several important advantages to employ characterized scoring matrices into BASIL: (1) The semantics of image features can be represented using the matrix; (2) The different weights can be applied for image matching using identities’ values in the matrix; (3) Positive credits and negative penalties can be
adjusted for exact/fuzzy matched and unmatched letters, respectively; (4) The more sophisticated scoring matrix than Uniform or Gaussian (e.g., Probabilistic, Linguistic, or Trained matrices) can be easily added to the CC table. We will leave this as future work.
4
Experimental Validation
4.1
Set-Up
The CC table is imReal world data set Modified data set The Lord of The Ring plemented by Matlab 7.0 Flickr (FK) Dark Knight (DK) (LR) on Intel Core 2 Duo (1.8GHz, # of # of # of Category Category Category 2GB RAM, Windows XP images images images Back 19 Home), and both BLAST 1 Batman 17 Poster Each original original DB generation and gene with 20 Face 27 image + image annotations Fire 42 sequence matching (near12 (240 original Joker 9 edited images) duplicate image matching) Wsos 41 Others with images 200 annotations Others 1108 was done by WU-BLAST Sub-total 1263 Sub-total 220 Sub-total 3120 2.01 on IBM Z60t (Intel Total number of images : 4603 Pentium-M 1.6GHz, 1.5GB RAM, Ubuntu 7.10). Fig. 4. Image data sets. As summarized in Figure 4, two real-world data sets and one edited data set are used in our experiments: Dark Knight (DK), The Lord of The Rings (LR)2 , and Flickr (FK)3 . The DK data set is manually classified into 6 categories (9∼41 images in each category), and further augmented by 1,108 irrelevant images for each category. For LR data set, one category (LR poster, 20 images) is selected with additional semantic annotations such as title, file name, and descriptions of images, while the other category is of 200 irrelevant images with their annotations. In the FK data set, for each original image, 12 near-duplicate images are generated by 12 typical editing methods, i.e., blur, changing brightness, changing format, changing color, color enhancement, changing contrast, compression, crop, adding logo, changing resolution, changing size, and multi-editing (e.g. crop+compression+logo). As an evaluation metric, we mainly use the average precision (P) and recall (R) in a PR graph using top-k model. In DK and LR image sets, for each category except others, 9-15 query images are randomly chosen to achieve 95% confidence levels with 6.5-9.9 confidence intervals on average precision and recall. With FK image set, for each category (total 240 categories), 10 query images are randomly chosen to achieve 99% confidence levels with 2.9 confidence interval. 4.2
Comparison within BASIL
DNA vs. Protein and Scoring Matrix. BASIL’s CC table is flexible to take different mapping and scoring matrix – e.g., DNA/Protein for mapping and Uniform/Gaussian for scoring matrix. Therefore, we first examined the performance under different selections of mapping and scoring matrix. While we omit details in the interest of space, we found that in general: (1) Protein yields 1 2 3
http://www.advbiocomp.com/blast/obsolete/ Both DK and LR are gathered from the Web. FK is gathered from http://www.flickr.com/
better accuracy than DNA does, because protein utilizes finer granularity than DNA such that the gap between two numerical values are less ambiguous; and (2) The Gaussian matrix provides better accuracy than Uniform or BLOSUM62 does. This is because the Gaussian matrix compensates the strict difference between letters. Based on above observations, in subsequent experiments, we use Protein and Gaussian as the default mapping and scoring matrix. Comparison among Image Features. Since gene sequence is generated by extracted features, the performance of BASIL depends on the quality of F. In this experiment, we use 16 macro blocks per image for FC and FT , collected meta data for FS , and 23 gene letters in Figure 3 (a) and (b). We used 6 popular features in the CC table: Y component from Y Cb Cr color domain, H, S, V components from HSV color domain, Law’s edge energy component, and semantic feature. Y , H, S, V , E (energy), and A (semantic annotation) stand for each component, respectively. For the evaluation of the effect of selected features, among these 6 features, one can choose any combination of them. In Figures 5(a) and (b), we evaluate the performance of various combination of features including 1 feature (i.e., H, V , and E), 2 features (i.e., SE and V E), 3 features (i.e., HSE and Y V E), 5 features (i.e., Y HSV E), and all 6 image features in the CC table. Note that feature A is only available in the LR image set. For the FK set, in Figure 5(a), all of H, V , and E features have a high precision until recall becomes 0.5. However, afterward, H feature becomes the best. In the real-world data set (DK and LR), in Figure 5(b), both V and E give the best result overall in terms of both precision and recall, while H yields the worst accuracy. Since color feature is more sensitive to H, in the realworld data set (DF and LR), people often copy and modify images with color change/enhancement functions before images are uploaded to the Web. On the other hand, the FK data set is generated by 12 editing methods. However, only 2 of them are related to the color in FK data set. Therefore, the results show that V and E for DK and LR are better features than H. When multiple features are selected, one can usually gain the average performances of different features. For instance, in the real-world image set (DK and LR), the accuracy with multiple features is always between those with an individual feature. However, note that the combination of features from image contents usually outperforms the average of the accuracies from individual feature selection. This is because the accuracy of BASIL system follows the top-k model. That is, even though the similarity between genes are averaged from multiple features, the similarity ranking from BLAST can be changed when features are combined. Another benefit of using multiple features combined is the improved robustness of BASIL for unknown image sets. In this paper, note that all sets are set to be unknown since we do not analyze the characteristic of data sets by sample or whole images in data sets. As a result, by combining all six features, Y HSV EA, in LR image set, we achieve the highest accuracy from BASIL system shown in Figure 5 (b).
11
1
FK‐H FK V FK‐V FK‐E FK‐SE FK‐VE FK‐HSE FK‐YVE FK‐YHSVE
06 0.6 0.4 0.2 0 0
0.2
0.4
0.6 0.4
Precision P
0.8 Precisio on
P Precisio on
08 0.8
0.2
0.6
0.8
1
00 0
DK‐H DK‐V DK‐EE DK DK‐SE DK‐VE DK‐HSE DK‐YVE DK YHSVE DK‐YHSVE LR‐YHSVE 0.2
0.4
Recall
0.6
0.8
(b) Features on DK & LR
6 6 14
57
140
4 14 6 2
116
7 0
1
50
100
150
Ranking
Recall
(a) Features on FK
6
chang_size multiple_editing change_resolution adding_logo crop contrast compression color_enhancement changing_color changing_format brightness, bl blur
(c) Editing methods
Fig. 5. Comparison among BASIL insides
Comparison among Editing methods. Using FK image set, we compare the impact of different editing methods on the accuracy of BASIL. For this evaluation, we select 5 features (Y HSV E) and 23 protein letters. Since we use 12 editing methods, when an original image is queried, ideally, all 12 edited images must be returned at high ranking. The worst ranking of a returned image is 3,120, since we have 3,120 images in FK set, i.e., 3,120 gene sequences in BLAST DB. Since BLAST DB also contains original images, note that the best ranking of edited images always starts from 2. Figure 5(c) shows the average rank of edited images in the returned list from BASIL with 12 different editing methods. BASIL system reveals that the average ranking of the expected duplicate images is about 2 for the best case and about 140 for the worst case. While some editing methods (e.g., contrast and brightness) make the detection of ND images really challenging for BASIL, in general, majority of editing methods are well covered by BASIL framework. Overall, BASIL is robust on various editing methods that are typically used by image editing tools. 4.3
Comparison against Other Methods
Due to the difficulty in obtaining the implementations of other NDID methods (summarized in Table 1), instead, we compare the performance of BASIL against two publicly available non-NDID solutions – Ferret for CBIR and ND PE for NDK. Comparison with Ferret. Here we first evaluate BASIL against one of the state-of-the-art CBIR alternatives, Ferret, from the CASS project at Princeton4 . Ferret is a toolkit for content-based similarity search for various data types including digital image. The result using the FK image set is shown in Figure 6(a), where Ferret and HSE exhibit the best results while the balanced Y HSV E is behind them after the recall of 0.5. With the DK set, BASIL achieves the best accuracy using the Y V E feature selection as shown in 6(b). Overall, both BASIL 4
http://www.cs.princeton.edu/cass/
1
11
06 0.6 0.4
FK HSE FK‐HSE FK‐YVE FK‐YHSVE FK‐Ferret
0.2
Precision P
0.8 Precisio P on
P Precisio on
0.8
06 0.6 0.4 0.2
00
0 0
02 0.2
04 0.4
06 0.6
08 0.8
Recall
(a) vs. Ferret on FK
1
0
DK‐HSE DK_YVE DK‐YHSVE DK‐Ferret LR‐YHSVE LR‐YHSVEA LR‐Ferret 02 0.2
04 0.4
06 0.6
08 0.8
1
Recall
(b) vs. Ferret on DK & LR
(c) vs. ND PE on DK
Fig. 6. Comparison BASIL to Ferret and ND PE.
with Y SHV E features and Ferret show similar accuracy. One of the benefits of the CC table in BASIL is that it enables to combine any heterogenous features to the final gene sequences. For instance, heterogeneous features such as semantic or content-based one can be uniformly represented in gene sequences. As a result, Figure 6(b) shows that the line of LR-YHSVEA (6 features including a semantic information) significantly outperforms Ferret. Comparison with ND PE. The ND PE is a near-duplicate keyframe (NDK) detection toolkit based on local features of images, developed by Video Retrieval Group (VIREO) from City University of Hong Kong5 . In ND PE, a set of local interest points of images are extracted and represented in PCA-SIFT descriptor. The similarity of two images is then determined on the degree of matches between two sets of keypoints such as a bipartite graph matching. We compare the accuracy of ND PE and BASIL with Y SHV E features on DK data set in Figure 6(c). In this test, 9–10 images in each category are selected to measure the similarity against all images in the data set. The top-25 returned images per query are used to generate the average PR graph6 . Figure 6(c) shows that overall the accuracy of BASIL is comparable to that of ND PE for the real nearduplicate data set, DK. Note that ND PE was originally designed to solve the NDK problem, not the NDID problem. Since both the NDK and NDID problems are slightly different, therefore, direct comparison between the results of BASIL and ND PE should be interpreted with much care.
5
Conclusion
In this paper, we proposed a novel solution, named as BLASTed Image Linkage (BASIL), to the near-duplicate image detection (NDID) problem by bridging two seemingly unrelated fields – Multimedia and Biology. In BASIL, we use the 5 6
http://vireo.cs.cityu.edu.hk/research/NDK/ndk.html The implementation of ND PE crashed for a few pairs of images in testing. In preparing the PR graph of Figure 6(c), such images were ignored.
Figure 6(c) is revised and replaced by a new graph from the article in the proceeding.
popular gene sequence alignment algorithm in Biology, BLAST, to determine the similarity between two images. To be able to handle flexible transformation from diverse image features to gene sequences, we also proposed the Composite Conversion (CC) table that hosts different images features and pre-fixed transformation rules. The validity of BASIL is positively measured using three real image sets on various aspects. In future, we plan to extend BASIL to apply it to different mediums such as video, audio, or time series. In addition, the structural characteristics of multi-media inputs will be studied to achieve structural alignment matching algorithms. BASIL implementations and data sets used in this paper are available at: http://pike.psu.edu/download/ecir10/basil/
References 1. S. Altschul, W. Gish, W. Miller, E. Myers, and D. Lipman. Basic Local Alignment Search Tool. J. Mol. Biology, 215(3):403–410, 1990. 2. D. Cai, X. He, and J. Han. Spectral Regression: A Unified Subspace Learning Framework for Content-Based Image Retrieval. In ACM Multimedia, 2007. 3. W. Dong, Z. Wang, M. Charikar, and K. Li. Efficiently Matching Sets of Features with Random Histograms. In ACM Multimedia, 2008. 4. F. Falchi, C. Lucchese, S. Orlando, R. Perego, and F. Rabitti. Caching Contentbased Queries for Robust and Efficient Image Retrieval. In EDBT, 2009. 5. J. J. Foo, J. Zobel, and R. Sinha. Clustering near-duplicate images in large collections. In ACM MIR, 2007. 6. J. J. Foo, J. Zobel, R. Sinha, and S. M. M. Tahaghoghi. Detection of Near-Duplicate Images for Web Search. In ACM CIVR, 2007. 7. P. Howarth and S. M. R¨ uger. Evaluation of Texture Features for Content-Based Image Retrieval. In ACM CIVR, 2004. 8. Y. Ke, R. Sukthankar, and L. Huston. An Efficient Parts-based Near-Duplicate and Sub-Image Retrieval System. In ACM Multimedia, 2004. 9. H. Kim, H. Chang, H. Liu, J. Lee, and D. Lee. BIM: Image Matching using Biological Gene Sequence Alignment. In In IEEE Int’l Conf. on Image Processing (ICIP), November 2009. 10. B. Mehta, S. Nangia, M. Gupta, and W. Nejdl. Detecting Image Spam using Visual Features and Near Duplicate Detection. In WWW, 2008. 11. E. Valle, M. Cord, and S. Philipp-Foliguet. High-dimensional Descriptor Indexing for Large Multimedia Databases. In ACM CIKM, 2008. 12. X. Wu, A. G. Hauptmann, and C.-W. Ngo. Practical Elimination of NearDuplicates from Web Video Search. In ACM Multimedia, 2007. 13. D.-Q. Zhang and S.-F. Chang. Detecting Image Near-Duplicate by Stochastic Attributed Relational Graph Matching with Learning. In ACM Multimedia, pages 877–884, Oct 2004. 14. W.-L. Zhao, C.-W. Ngo, H.-K. Tan, and X. Wu. Near-Duplicate Keyframe Identification with Interest Point Matching and Pattern Learning. IEEE Trans. on Multimedia, 9:1037–1048, August 2007. 15. Y.-T. Zheng, S.-Y. Neo, T.-S. Chua, and Q. Tian. The Use of Temporal, Semantic and Visual Partitioning Model for Efficient Near-Duplicate Keyframe Detection in Large Scale News Corpus. In ACM CIVR, 2007.