BASIN SCALE RAINFALL - RUNOFF MODELING FOR FLOOD FORECASTS T.P. KAFLE1, M. K. HAZARIKA1, S. KARKI2, R.M. SSHRESTHA3, R. SHARMA4, L. SAMARAKOON1
Abstract Flow estimation at a point in a river is vital for a number of hydrologic applications including flood forecast. This paper presents the results of a basin scale rainfall-runoff modeling on Bagmati basin in Nepal using the hydrologic model HEC-HMS in a GIS environment. The model, in combination with the GIS extension HEC-GeoHMS, was used to convert the precipitation excess to overland flow and channel runoff. The rainfall data used were: rain gauge data alone, TRMM data alone and both rain gauge and TRMM data. The simulation was done for a period of four months (JuneSeptember) covering the total rainy season of year 2004. The predicted hydrograph was calibrated against observed one and the model parameters were manually optimized for good simulation. The predicted peak discharge, using rain gauge data, was close to the observed value and the smaller discharges followed the observed trend. The model framework developed in the study considered the spatial variation in the runoff response of the watershed through the use of Curve Numbers based on soil type and land use and the spatial distribution of the rainfall in the watershed by using rainfall data from a number of rain gauge stations located in different parts of the basin. The peak flow of the derived hydrograph was used as an input in hydraulic model (HEC-RAS) for producing flood maps showing inundation area extent and flood depths, thus directly linking the model to operational flood forecast. While designed for Bagmati basin the approach may be applied to other basins as well. 1. Introduction Flooding induced by storm events is a major concern in many regions of the world (Dutta et al., 2000; Blanchard-Boehm et al., 2001; Horrit and Bates, 2002; Knebl et al.2005;). It causes over one third of the total economic loss from natural catastrophes and is responsible for two thirds of people affected by natural disasters. On the other hand, studies and analysis have shown that damage reductions due to forecasts improvements can range from a few percentage points to as much as 35% of annual flood damages (UN ISDR, 2004). Determining the extent of flooding is an important role of the hydrological research community and provides a vital service to planners and engineers (Hudson and Colditz, 2003). The impact of flooding was not felt to the same extent in the past as it is now. This could be due to the rapid increase in population and consequent increase in the human activities (Kron, 2003, Todini, 1999). The flood plains are being increasingly occupied to meet ever-increasing requirements of food and fiber, and consequently the flood problem is exacerbated. In Nepal each year, on an average 330 lives are lost due to floods and landslides and infrastructure and property amounting to more than US$ 100 million is damaged (DWIDP, 2004) causing negative impacts on the social and economic development of the country. There is a growing realization about the importance of non-structural measures, including flood forecasting and early warning, in flood management. Establishing a flood forecasting system would 1 Geoinformatics Centre, Asian Institute of Technology, Thailand; Corresponding author:
[email protected] 2 Survey Department, Kathmandu, Nepal 3 Department of Water Induced Disaster Prevention, Kathmandu, Nepal 4 Department of Hydrology and Meteorology, Kathmandu, Nepal
enhance the effectiveness of all other mitigation measures by providing time for appropriate actions. This has increased the importance of flood modeling for flood forecasts to issue advance warning in severe storm situations to reduce loss of lives and property damage. But the accuracy of operational hydrological models primarily rely on goof rainfall data input in terms of temporal and spatial resolution and accuracy ( Pathirana et al., 2005). For real time flood warning to be effective the rainfall information should also be made available real time, a capability though desirable but not available in most of the countries in Asia. Main objectives of this study included: (1) the development of a hydrological model of the Bagmati River Basin and incorporation of precipitation data in the model; (2) rainfall– runoff analysis for the basin and use of the computed hydrograph for flood map generation and (3) preparation of flood maps for discharges corresponding to various return periods to assess the area likely to be inundated due to potential flooding. The methodology attempts to create an approach of rainfall input and floodplain (inundation area and flood depth) output, which will enable user agencies to model rainfall–runoff relations with greater efficiency and will also contribute to improvements in their ability to respond to flooding events. 2. Study Area China
The Bagmati River originates in the Mahabharat range of mountains at about 16 km northeast of Kathmandu, the capital of Nepal. Figure 1: Study area As the river comes out of the hills, it enters into Terai and flows as a divide between Sarlahi and Rautahat districts and drains out of Nepal across the Indian state of Bihar to join the Ganges. Its total length is 597 km of which 195 km lies in Nepal and the remaining portion in India. The catchment area of the river at Karmaiya and Indo-Nepal border are computed to be 2800 sq. km. and 3670 sq. km. respectively. The study area comprising of rural and urban settlement as well as agricultural land is shown in Figure 1. A number of settlements situated on both the banks of the river in the study area are usually flooded during rainy season. Flooding is mainly caused by intense rainfall over its catchment that generates high volumes of run-off, which spills the riverbank. An extreme flooding event in 1993 killed 1029 people, affected 400,000 people, damaged 25,000 houses and destroyed 40,000 ha agricultural land (DWIDP, 2005). 3. Data Precipitation data from 24 nos. of rain gauges within and in the periphery of the basin covering the whole monsoon season (June to September 2004) were used in the study. DEM was generated from
contour and spot heights data of Survey Department of Nepal. Observed data on stream flow by Department of Hydrology and Meteorology at Pandhera Dovan were used for calibrating the rainfall-runoff model. Land cover maps were produced using Landsat ETM image of year 2005 and land resource mapping project (LRMP) database. Soil type was broadly classified based on the physiography in general e.g. Valley, Mahabharat, Churia and Terai in conjunction with land capability/utilization map and geologic map. River network and terrain geometry were generated from the DEM. Tropical Rainfall Measuring Mission (TRMM) is a joint mission between NASA and the Japan Aerospace Exploration Agency (JAXA) designed to monitor and study tropical rainfall. TRMM rainfall data - 3B42RT were downloaded from NASA’s website. 4. Model Description 4.1 Rainfall-runoff model: HEC-HMS The Geospatial Hydrologic Modeling Extension (HEC-GeoHMS) uses ArcView and Spatial Analyst to develop a number of hydrologic modeling inputs. Analyzing digital terrain information, HEC-GeoHMS transforms the drainage paths and watershed boundaries into a hydrologic data structure that represents the watershed response to precipitation. Rainfall-Runoff modeling was performed using the Hydrologic Engineering Center’s Hydrologic Modeling System (HEC-HMS version 3.0.1) importing results from HEC-Geo-HMS. This model developed by the US Army Corps of Engineers, is designed to simulate the precipitation-runoff processes of dendritic watershed systems (USACE, 2005). The physical representation of the watershed is accomplished with a basin model. Various hydrologic elements are connected in a dendritic network to simulate runoff processes. A variety of methods are available for simulating infiltration losses, transforming excess precipitation into surface runoff, computing baseflow contributions to subbasin out flow, flow routing etc. Outflow from a sub-basin is computed from rainfall data by subtracting losses, transforming excess precipitation and adding base flow. 4.2 Hydro-dynamic model: HEC-RAS HEC-RAS, developed by the United States Army Corps of Engineers Hydrologic Engineering Center, is intended for performing one-dimensional hydraulic calculations for a full network of natural and constructed channels. The system can calculate water surface profiles for both steady and unsteady gradually varied flow. The steady flow system is designed for application in flood plain management studies. Also, capabilities are available for assessing the change in water surface profiles due to channel improvements, and levees. HEC-GeoRAS, an ArcView GIS extension, creates a HEC-RAS import file containing geometric attribute data from a digital terrain model (DTM) and performs post processing of results exported from HEC-RAS. Main parameters needed are cross-sections for river and flood plain including left and right bank locations and flow paths, roughness coefficients (Manning’s n), and contraction and expansion coefficients. 5. Methodology The model is an integration of HEC-HMS and HEC-RAS in a GIS environment. A number of flood related studies have shown that these models provide accurate and useful results (Knebl et al. 2005, Anderson et al. 2002).
5.1 GIS of the basin Clark mentions one of the main advantages of using GIS for flood management as its creation of potential to further analyze the visualization of flooding for estimating probable flood damage (Clark, 1998). The knowledge of the catchment’s characteristic, spatial and temporal stream flow and precipitation distributions are crucial for setting up a hydrologic model and its calibration. Therefore, as a first step a detailed Geographic Information System (GIS) of the basin was developed. It comprised the following layers most of them developed from maps with scale of 1:25,000 and 1:50,000. • Contour lines of the relief (interval 5- 10m); Digital Elevation Model (DEM) • River network • Stream flow and precipitation measuring stations; • Administrative boundaries, settlements; roads; • Land cover • Geological map, Soil map etc. 5.2 HEC-HMS model components and processing steps The hydrologic model was generated with the help of the HEC-GeoHMS (USACE, 2003) using DEM of the region. Using terrain data in the form of a DEM, HEC-GeoHMS, an extension of GIS Arc View creates HMS input files in the form of stream network, sub-basin boundaries, connectivity of various hydrologic elements etc. through a series of steps collectively known as terrain pre-processing and basin processing. The physical representation of watersheds or basins and rivers was configured in the basin model. Hydrologic elements were connected in a dendritic network to simulate runoff processes. The basin was divided into 8 sub-basins as shown in Figure 2 representing the main tributaries of the Bagmati river. Then it was supplemented by following models. • Models that compute runoff volume (loss rate): The Curve Number (CN) of the U.S. Dept. of Agriculture, Natural Resources Conservation Service (NRCS) (formerly Soil Conservation Service, SCS) known as SCS CN was used to predict the runoff properties for surface based on the hydrologic soil group and ground cover (US SCS, 1986). One weighted CN for each sub-basin was computed. • Models of direct runoff (transform): Transformation of excess precipitation into surface runoff was accomplished using SCS Unit Hydrograph. Figure 2: Bagmati basin subdivided into 8 sub-basins
• Models of base flow: Baseflow can be an important parameter in flood studies because it defines a minimum river depth over which additional runoff accumulates. Models that neglect baseflow may under estimate water levels and therefore fail to identify inundated reaches (Knebl et al., 2005). In this study constant monthly values were used for base flow computations. These values were computed applying the monthly specific base flows at Pandhera Dovan for the entire basin (q= Q/A). • Meteorological model (precipitation): The inverse distance method addresses dynamic data problems. The method was originally designed for application in real time forecasting systems. It can use recording gages that report on regular interval and gages that only report daily total precipitation. Because it was designed for real time forecasting, it has the ability to automatically switch from using close gages to using more distant gages when the closer gages stop reporting data. • Model of channel flow of a river reach (routing model): Kinematic Wave method that approximates the full unsteady flow equations by ignoring inertial and pressure forces was adopted. This method is best suited to fairly steep streams (USACE, 2005). The time span of a simulation is controlled by control specifications. Control specifications include a starting date and time, ending date and time, and computation time step. A computation run is created by combining a basin model, meteorological model, and control specifications. The available records of 24 precipitation stations and one stream flow gauge station were used for calibration and verification of the HEC-HMS model. The calibration was done using daily data for the period from June1 to September30, 2004 (4 months). The SCS unit hydrograph transform method requires lag time as input, which was taken to be 60% of the time of concentration (USACE, 2005). Time of concentration was calculated using Izzard, Kirpich, Kerby, Kinematic Wave, Federal Aviation Agency and Bransby Wiilliams equations (Wanielista, 1997) and several simulation runs were performed in HEC-HMS using the obtained values. Finally the values obtained using the following Kirpich’s formula were used. (1) Where L= reach length in ft. S = slope TRMM rainfall data (3B42RT) of 11 grid points within the basin were also included in two simulation runs to assess the suitability of using TRMM data in conjunction with observed rainfall or as standalone input for runoff computation 5.3 HEC-RAS modeling The flood plain visualization was carried out using one-dimensional numerical model HEC-RAS. HEC-GeoRAS, an Arc View extension, was used as the interface between HEC-RAS and GIS for pre-processing and post-processing of the data in GIS. The geometric data of the flood plain and river were obtained from the digital elevation model (DEM). Water surface profiles, along the river reach under study, for floods of various return periods were computed with sub critical flow
simulation. These profiles were exported to GIS and water surface Triangular Irregular Network (TIN) was generated. An intersection of the terrain TIN and water surface TIN results in flood map. 6. Rainfall-runoff model calibration The model was calibrated against measured stream flow data at Pandhera Dovan. Watershed parameters e.g. initial abstraction, time of concentration, CN, baseflow was used to modify the predicted hydrograph for obtaining a best fit. Flood Depths for Q
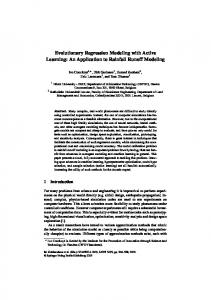
7. Validation of hydraulic model results 3.00
Validation is based on the comparison of modeled flood depths with observed flood depths based on flood marks at specific locations (Kafle, 2006) corresponding to the peak flood event of 2004 and is shown in Figure 3. Though the results show a good conformity with observed values, alternative validation using satellite images capturing peak floods is desirable.
50
Model Results vs O bserved
Observed depth, m
2.50 2.00 1.50 1.00 0.50 0.00 0.00
0.50
1.00
1.50
2.00
M odelled depth , m
2.50
3.00
y = 0.9758x + 0.0749 R 2 = 0.8877
Figure 3: Observed and modeled flood depths 8. Results and discussions Flood forecasting is the prediction of water levels, areas and depth of flooding in rivers and flood plains (Paudyal, 2005). The results of flood frequency analysis (Gumbel distribution) carried out using instantaneous peak discharge values from 1965 to 2004 are shown in table 1.The predicted peak discharges using different rainfall data as input are shown in table 2. The results of hydrologic simulation are shown in Figure 4. The predicted peak discharge (98% of observed value), on the same day as the observed one, using point gauge rainfall data can be regarded as reasonably accurate. Table 1: Flood discharges for different return periods Return period (year) 2 5 10 20 50 100
Discharge (cumecs) 3750 6150 7750 9250 11250 12700
Table 2: Comparison of predicted discharges Description Rain gauge stations only
Predicted peak discharge (cumecs) 5498
Observed peak discharge (cumecs)
Rain gauge and TRMM
3900
5600
TRMM only
2500
The peak resembled well but the lower discharges need further refinement. The discrepancy in lower discharges might be Simulated vs. Observed Discharges due to non-uniform distribution and low density of the rain gauges 6000 in some parts of the basin. Another reason might be 5000 the use of the SCS unit 4000 hydrograph method in Simulated_gauge data basins where some of its Observed 3000 TRMMonly assumptions, mainly basin TRMM+gauge size, are not fulfilled. The 2000 root mean square error 1000 (RMSE) for the full hydrograph and for the 0 peak flow was found to be 1-Jun-04 21-Jun-04 11-Jul-04 31-Jul-04 20-Aug-04 9-Sep-04 29-Sep-04 760 cumecs and 101 Time in Days cumecs respectively. Figure 4: Simulated vs. observed hydrographs The normalized peak error (NPE), defined as follows (Masmoudi and Habaib, 1993) was computed to be –0.018. NPE = (Qpmax - Qomax)/Qomax
(2)
Where Qpmax is the predicted peak discharge and Qomax is the observed peak discharge. Flood risk is defined in terms of 100-year flood (UNDP, 1994). But depending on the degree of acceptable risk that is selected for an evaluation, other frequencies may be choosen (UNDP, 1994 a). Flood depth is considered as the most important indicator of the intensity of flood hazard (Islam et al. 2001, Townsend et al. 1998, Wadge et al. 1993 as cited by Sanyal et al. 2004). In this study flood maps showing inundation area and flood depths were produced using the hydrodynamic model HEC-RAS and inundation area corresponding to floods of various return periods were computed. The total area of the 95 flood affected Village Development Committees (VDCs) was 984 sq. km. The results are shown in table 3. Figure 4 shows a flood map corresponding to a discharge having a return period of 50 years. Table 3: Total inundated area corresponding to floods of various return periods Return period (year)
Area inundated (sq.km.)
% Area inundated
2 5 10 20 50 100
363.4 403.9 422.9 437.7 454.8 465.6
36.9 41 42.9 44.5 46.2 47.3
Further analysis showed that an area of 183 square km. was estimated to have a flood depth of greater than 1m during a 50 year flood. Considering the relatively inferior building materials, low height of roads and possibility to crop damage 1m is considered as the critical depth beyond which the floodwater will become more damaging. 9. Conclusions Though an exact agreement for the smaller discharges was not achieved, the rainfall-runoff model predicted the peak discharge, based on point gauge data, fairly accurately. Hence the methodology could be considered valid for application in peak flow computation for flood forecasting. Decision makers and communities are often concerned with inundation area extent and flood depths at specific locations. Flood maps were prepared for various return periods and corresponding inundation areas were computed.
Figure 4: Flood map corresponding to a 50 year flood These maps can be used in conjunction with the predicted peak flows for flood forecasting, awareness raising, development planning, emergency services and post disaster rehabilitation aimed at reducing flood damages and economic impacts in future. Acknowledgement Our thanks to Japan Aerospace Exploration Agency (JAXA) for financial support and to Department of Water Induced Disaster Prevention, Department of Hydrology and Meteorology and Survey Department of Nepal for providing data used in this study. REFERENCES Anderson M. L., Chen Z. Q., Kavvas M. L., Feldman A., 2002. Coupling HEC-HMS with atmospheric models for prediction of watershed runoff. Journal of Hydrologic Engineering 7 (4), pp. 312–318. Blanchard-Boehm R. D., Berry K. A. and Showalter P. S., 2001. Should flood insurance be mandatory? Insights in the wake of the 1997 New Year’s Day flood in Reno–Sparks, Nevada, Applied Geography 21, 199-221. Clark M. J., 1998. Putting Water in its Place: A Perspective on GIS in Hydrology and Water Management, Hydrological Processes 12, pp. 823-834, John Wilwy & Sons Ltd.
Department of Water Induced Disaster Prevention (DWIDP)/Govt. of Nepal, 2005. Preparation of water induced hazard maps of Bagmati River basin vol.I (Main Report) Department of Water Induced Disaster Prevention (DWIDP)/Govt. of Nepal, 2004. Disaster Review Dutta D., Herath S., Musiake K., 2000. Flood inundation simulation in a river basin using a physically based distributed hydrologic mode,. Hydrological Processes 14 (3), 497–519. Horritt M. S., Bates P. D., 2002. Evaluation of 1D and 2D numerical models for predicting river flood inundation, Journal of Hydrology 268, 87–99. Hudson P. F. and Colditz R. R., 2003. Flood delineation in a large and complex alluvial valley, lower Panuco basin, Mexico. Journal of Hydrology 280, 229–245. Kafle T.P., Hazarika M. K., Shrestha K.G., Prathumchai K., and Samarakoon L., 2006. Integration of remote sensing and GIS with flood simulation model for flood hazard mapping in the Bagmati River, Nepal, Proc. Fifth International Symposium on New Technologies for urban safety of Mega Cities in Asia, Phuket, Thailand. Knebl M.R., Yang Z. L., Hutchison K., Maidment D.R., 2005. Regional Scale Flood Modeling using NEXRAD Rainfall, GIS, and HEC-HMS/RAS: Accase study for the San Antonio River Basin Summer 2002 storm event, Journal of Environmental Management 75 pp. 325–336. Kron W., 2003. Flood Catastrophes: causes – losses – prevention from an international re-insurer's viewpoint, Proc. International Workshop on Precautionary Flood Protection in Europe, Bonn, Germany. Masmoudi M., Habaieb H., 1993. The Performance of Some Realtime Statistical Flood Forecasting Models Seen Through Mmulticriteria Analysis. Water Resour. Mgmt 7, pp. 57–67. Pathirana A., Herath S. and Swain D., 2005. Hydrometeorological input for improving flood forecasting in the Mekong, Proc. International Symposium on role of Water science in transboundary river basin management, Ubon Ratchathani, Thailand, pp 49-56. Paudyal G. N., 2005. Flood forecasting and Warning in Bangladesh: Modelling of large river systems including transbundary rivers, Proc. International Symposium on role of Water science in transboundary river basin management, Ubon Ratchathani, Thailand, pp 57-65. Sanyal Joy and Lu Xi Xi, 2004. Application of Remote Sensing in Flood Management with Special Reference to Monsoon Asia – A Review, Natural Hazards 33, Kluwer Academic Publishers. Todini E., 1999. An operational decision support system for flood risk mapping, forecasting and management, Urban Water 1, 131-143. UNDP, 1994. Vulnerability and Risk Assessment, 2nd Edition, Source: http://www.undmtp.org/english/vulnerability_riskassessment/vulnerability.pdf. pp. 46 UNDP, 1994a: Vulnerability and Risk Assessment, 2nd Edition, Source: http://www.undmtp.org/english/vulnerability_riskassessment/vulnerability.pdf. pp. 89 UN Inter Agency Secretariate of the International Strategy for Disaster Reduction (UN ISDR), 2004. Guidelines for reducing flood losses, www.unisdr.org. USACE, 2005. Hydrologic Modeling System: User’s Manual Version 3.0.0, US Army Corps of Engineers, Institute for Water Resources, Hydrologic Engineering Center, Davis, CA, USA. USACE, 2003. Geospatial Hydrologic Modelling Extension HEC-GeoHMS, User’s Manual Version 1.1, US Army Corps of Engineers, Hydrologic Engineering Center, Davis, CA, USA. US Soil Conservation Service, 1986. Urban Hydrology for Small Watersheds (Technical Release 55), US Department of Agriculture.
Wanielista M, Kersten R.and Eaglin R., 1997. Hydrology: Water Quantity and Quality Control, John Wiley & Sons. 2nd ed.