example, a temperature of 40° Celsius is normally la- belled as very hot, but in the context of a sauna it is labelled cold. In this work, contextual feedback was not.
Pers Ubiquit Comput (2003) 7: 113–124 DOI 10.1007/s00779-003-0237-8
ORIGINAL ARTICLE
Panu Korpipa¨a¨ Æ Miika Koskinen Æ Johannes Peltola Satu-Marja Ma¨kela¨ Æ Tapio Seppa¨nen
Bayesian approach to sensor-based context awareness
Received: 1 March 2002 / Accepted: 4 February 2003 Ó Springer-Verlag London Limited 2003
Abstract The usability of a mobile device and services can be enhanced by context awareness. The aim of this experiment was to expand the set of generally recognizable constituents of context concerning personal mobile device usage. Naive Bayesian networks were applied to classify the contexts of a mobile device user in her normal daily activities. The distinguishing feature of this experiment in comparison to earlier context recognition research is the use of a naive Bayes framework, and an extensive set of audio features derived partly from the algorithms of the upcoming MPEG-7 standard. The classification was based mainly on audio features measured in a home scenario. The classification results indicate that with a resolution of one second in segments of 5–30 seconds, situations can be extracted fairly well, but most of the contexts are likely to be valid only in a restricted scenario. Naive Bayes framework is feasible for context recognition. In real world conditions, the recognition accuracy using leave-one-out cross validation was 87% of true positives and 95% of true negatives, averaged over nine eight-minute scenarios containing 17 segments of different lengths and nine different contexts. Respectively, the reference accuracies measured by testing with training data were 88% and 95%, suggesting that the model was capable of covering the variability introduced in the data on purpose. Reference recognition accuracy in controlled conditions was 96% and 100%, respectively. However, from the applicability viewpoint, generalization remains a problem, as from a wider perspective almost any feature may refer to many possible real world situations.
P. Korpipa¨a¨ (&) Æ M. Koskinen Æ J. Peltola Æ S.-M. Ma¨kela¨ VTT Technical Research Centre of Finland, VTT Electronics, Kaitova¨yla¨ 1, P.O. Box 1100, FIN-90571 Oulu, Finland E-mail: Panu.Korpipaa@vtt.fi T. Seppa¨nen Department of Electrical and Information Engineering, University of Oulu, Oulu, Finland
Keywords Audio context Æ Bayesian networks Æ Context awareness Æ Context recognition Æ Mobile computing Æ Sensor
1 Introduction Recently, mobile computing and forming ubiquitous computing communities have signalled an increasing interest in context, narrowly defined as the situation of a user. The aim is to achieve more natural interaction between humans and machines, and increase the usefulness of mobile services by improving computers’ contextual awareness. Although most context-exploiting applications in ubiquitous computing are currently based on time and location, some work has been reported on extracting more complex contexts like the user activity and state of the environment. A common approach is to attempt to recognise the context by adding a set of sensors, such as accelerometers, microphone, camera, etc., into a mobile device the user is carrying, or more often, into the environment. Machine learning and data mining methods are then used to learn or discover multidimensional context descriptions from the sensor data. The machine learning approach in sensor-based context recognition is studied, for example, by Clarkson and Pentland [1], who apply Hidden Markov Models (HMM) to differentiate noise from speech by and around a wearable computer user. Clarkson et al. [2] describe experiments in recognising user situation using a wearable camera and a microphone. Again, HMMs are used to detect rough locations (such as at work or in a subway) and events (such as conversation or traffic). Laerhoeven and Cakmakci [3] report on using Kohonen maps, K Nearest Neighbor classification (KNN) and Markov chains to detect user activity. As subjects of future work, one can identify, among others, increasing the number of sensors and detecting multiple simultaneous contexts. Ma¨ntyja¨rvi et al. [4] and Himberg et al. [5] performed data mining to discover a mobile device
114
user context from multidimensional sensor data (three axis acceleration, light, temperature, humidity, skin conductivity). Minimum variance segmentation, k-means clustering, PCA and ICA are used as methods of analysing the data, which reveal patterns referring to rough usage situations. Also, their results suggest that more informative sensors and a wider set of features would be essential for more detailed and accurate situational descriptions. Madabhushi and Aggarwal [6] apply a Bayesian framework to classify ten different human activities from visual information by tracking (manually) the position of the head in the pictures. Concerning plain auditory scene recognition, Peltonen et al. [7] classify 17 everyday environment situations, such as streets, restaurants, etc., achieving an accuracy of 63.4% of true positives, with an average of 30 second analysis duration. They choose and compare two best performing feature sets out of 11 possible as an input for 1-nearest neighbor and Gaussian mixture model classifiers. The focus of this study differs from theirs in emphasising sensor fusion, and a wide variety of different features are combined to provide as much discriminative information for the classifier as possible. The recognition is based on measuring audio, accelerations for three directions, temperature, light level, humidity and skin conductivity. Hence, we added a microphone into the sensor array [8] to gain more information from the environment. In total, 13 contexts are extracted from the sensor data in this study. Seven of them – Speech, Rock music, Classical music, Other sounds, Car, Elevator and Running tap water – are audio-related and classified by using a Bayesian network. The rest of the contexts are based on the other sensors. Two of them, Inside and Outside, are recognised by using another separate Bayesian network. The remaining four contexts, Walking, Running, Activity and Still, are extracted directly from the fuzzy set layer output without classification. The main contribution of this work is applying naive Bayesian networks in learning and classifying the contexts of a mobile device user based on the features derived from the measurements. The approach is mobile device-oriented, as the sensors are embedded into the device instead of being distributed into the environment. Although similar in some aspects to the related work, our approach differs from it in that the focus is to recognise static short-term events that are as descriptive and generic as possible at the intermediate levels of the context representation layer structure, while sequences of these events could be utilised at the upper level(s). Naive Bayesian learning and inference are straightforward and computationally very efficient. The most informative input for the network with given sensors is a diverse combination of audio signal features derived using a variety of signal processing algorithms from the MPEG-7 standard. Additional cues are given by the other sensors. The organisation of the paper is as follows. First, the layers of the representation of context are discussed one by one, starting from the lowest in the hierarchy,
Fig. 1 Context representation layers
focusing on audio features and the naive Bayesian classifier. Next the experiment setup is introduced, followed by the recognition results and detailed analysis of the results. Finally, some directions for future work are given.
2 Context representation layers To represent complex entities, any single methodology alone is often insufficient. This is evident in the modelling of contextual information, which, in this case, refers to a situation in the real world. Concerning knowledge representation generally, Minsky [9] reached a similar conclusion about the necessity for a hierarchy utilising heterogeneous methodologies. Laerhoeven and Cackmacki [3] use four layers, which in ascending order are statistical cues, Kohonen clustering, kNN classification and a Markov chain supervisory layer. The architecture in Fig. 1 is somewhat similar in principle, but the layers consist of different methods. The main difference in the approach is that more emphasis is put on a wide variety of complex algorithmic solutions in producing more descriptive features, instead of letting a Kohonen map cluster a set of simpler features to raise the abstraction level. An advantage of this approach is that control and
115
‘accurate touch’ to the data is maintained up to the classification layer. The features can also be chosen in such a manner that they are as descriptive of a context they are attempting to model as possible. If the feature itself is discriminative enough, the classification layer is not even necessary. Only when a combination of different features is needed for recognition is the classification layer useful. A disadvantage of using high-level features is that the development of proper signal processing algorithms is laborious, compared to the use of very low-level features. The expressiveness of information increases upwards while the accuracy decreases (Fig. 1). In a restricted scenario setup, a unidirectional information flow is sufficient. Wider generability requires a feedback loop in the structure from context to quantisation, since the mapping of feature values into verbal descriptions (signal-to-symbol conversion) is context-dependent. For example, a temperature of 40° Celsius is normally labelled as very hot, but in the context of a sauna it is labelled cold. In this work, contextual feedback was not included. 2.1 Measurements The measurement system hardware consisted of a small sensor box attached to a shoulder strap of a backpack containing a laptop. When collecting scenario data, the user carried the backpack. The measurement system was controlled with a cordless mouse, so that marking the scenario phases, in other words, data labelling, could be performed ‘on the fly’ by an assistant simply by clicking a mouse button for a phase change. These data labels were later used to verify the correctness of the classification results (label-train-classify approach). Nine channels were used to measure the environment; one for each axis of acceleration, two for light intensity, and one for temperature, humidity, skin conductivity and audio. The microphone was a small, omni-directional AKG C 417/B. The audio sampling frequency was 22050 Hz, and for other sensors the rate was 256 Hz. For the other sensors, such a high sampling rate is only required when detecting artificial light from the frequency of light emitted from the power rectified light bulbs. For example, walking can be detected with only 10 Hz [10], and running requires at most 20 Hz sampling rate. 2.2 Feature extraction from audio The environmental audio categorisation to certain known events is challenging, due to the high quantity of different types of sounds and the high variation between the sounds that belong to the same category. The situation is even more complex if several sound sources are active at the same time. A total of 47 quantised features was used to describe seven audio related contexts:
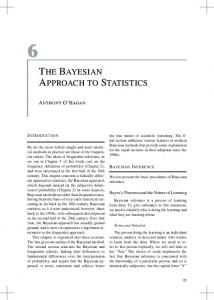
Speech, Rock music, Classical music, Other sound, Car, Elevator and Running tap water. The algorithms were mainly selected from the upcoming MPEG-7 standard (part4, audio). Unlike previous MPEG standards, the MPEG-7 is not a compression standard, instead it is a content description standard. MPEG-7 standardizes metadata presentation and some features that can be used to describe any digital content. The main expected exploitation area of this standard is in information retrieval applications. The content description nature of the standard allows us to partly use it in defining the properties of the surrounding audio environment. Audio data was divided into one-second intervals, and each second was subdivided into blocks depending on the needs of the particular algorithm. Results from the blocks were collected to form a single value for each second. Algorithm outputs were refined by using deviations, median and ratios of high and low values during the one-second window. To smooth out the temporal fluctuation between one-second windows, the mean and median of the last 10-second values were used additionally for some features. The audio signal used in this study consisted of speech, music and ambient sounds such as a car, elevator and running tap water. Ambient sounds can mostly be categorized as colourful noise produced by surrounding technical equipment, and transient sounds, which occur mostly when solid materials collide. The characteristic structure of speech can be generally described as a series of syllables composed of a successive trail of vowels and consonants. Some consonants are produced by a constriction in the vocal tract, resulting in a turbulent airflow and unvoiced speech segments. Vowels, on the other hand, are generated by the lack of constriction in the vocal tract. Thus, vowels are usually high-energy events and show a visible periodic component, due to the oscillatory excitation of the vocal chords. The generation of voiced consonants resembles vowel generation, but the vocal tract is more constricted. Periodic components appear as a voiced speech segments. The syllabic rate and silent intervals between words cause low energy frames to occur more often in speech than in music. The music signal is difficult to characterise, since almost anything can be present in music pieces. Generally, it is expected that high frequency harmonic components do occur in music signals. The ambient sound may also contain mixed harmonic components. Properties of the ambient noise, such as the power envelope and perceived pitch, are expected to be more constant in time than similar characteristics in the speech or music. The word ‘transient’ does not have an exact definition. It usually refers to a short signal, which starts as a step function, but rapidly decays, and the parameters such as frequency and phase vary with time. In Fig. 2, waveform examples for the speech, music, car sound and a transient are presented. The duration of the first four samples is one second, and below them is a zoomed version of the transient sound.
116
Fig. 2 Audio waveform examples of speech, music, car sound and transient
The main algorithms selected from the MPEG-7 to produce features for classification were harmonicity ratio, spectral centroid, spectral spread, spectral flatness and fundamental frequency. Harmonicity ratio describes the proportion of harmonic components in the spectrum. The algorithm output is 1 for a purely periodic signal, and 0 for white noise. For example, the sound of tap water running is similar to the white noise. A high harmonicity ratio can be expected, for example, from musical instruments and voiced speech segments. A useful feature derived from the harmonicity ratio was the length of the comb filter, which is an estimate of the delay that maximises the autocorrelation of the audio waveform. Using this feature, it was possible to classify brown noise-like signals, such as the sound of a car engine, which in general have the smallest possible comb filter length. The upper limit of harmonicity loosely defines the frequency beyond which the spectrum has no harmonic components. The harmonics below 6 kHz were taken into account. The upper limit frequency for the harmonics is expected to be higher for the music than voiced speech segments. The spectral centroid is the centre of gravity of the power spectrum. For audio signals that clearly have
much energy in lower or higher parts of the spectrum, this feature is useful. In this work, the car and elevator represent sounds with a low centroid, while running tap water has a high centroid. The spectral spread is the RMS deviation of the spectrum centroid, and thereby it describes whether the spectrum is widely spread out or concentrated around its centroid. Noise-like sounds should have a wider spectrum compared to voiced sounds such as speech. Spectral flatness describes the flatness of spectrum for different frequency bands. The spectral flatness of higher bands is a good indicator for musical instruments, which tend to spread their harmonics to the higher part of the spectrum. In this study, a frequency band of 1–2 kHz was examined, as it seemed to give high values for the classical music. Fundamental frequency (F0) is the lowest harmonic that is found in acoustic signals, such as music or speech. F0 together with a voiced/unvoiced decision can be used to indicate the presence of voiced speech segments and music. The MPEG-7 standard does not define an exact method for estimating the fundamental frequency. Thus, the narrowed autocorrelation [11] was used to extract F0. Outside the MPEG-7 standard two extra features, transient detection and low energy ratio, were applied. Many momentary environment sounds, such as for
117
example shutting doors, or a heel hitting the floor when walking, dining, the clinking of keys, etc. contain transients. The Low Energy Ratio (LER) [12] is the ratio of signal power less than 50% of mean power within a certain time window. The feature can be used to distinguish between signals that have a relatively constant power envelope, and those that have fluctuating power. For example, speech has a high LER, whereas rock music typically has a low LER [13]. 2.3 Feature extraction from other sensors In practical context recognition, the results based on a single sensor may in many cases be unreliable. Reliability of recognition can be enhanced by fusing the features from many different sources. For example, if the goal is to detect whether the device is outside or inside a building, the inputs of humidity and light sensors can be combined. If the device is, for example, in a pocket so that the light level is unchanging, humidity may possibly still indicate the situation. The features of acceleration, temperature, light, humidity and skin conductivity sensors are in most cases more straightforward to derive than audio features, and can be quite directly associated with situations. On the other hand, unfortunately, these sensors are not very expressive in describing context, and can only be used to recognise a handful of useful simple situations in a restricted scenario. In this study, acceleration sensors are used to detect movement in general by monitoring the standard deviation of the three acceleration channels. The recognition of a feature indicating walking is a bit more elaborate. The basic assumption concerning the pose of the device in practice is that the pose varies dynamically in different situations. From this assumption, it follows that the direction of the movement in the horizontal level cannot be bound to any fixed axis. The solution was to first derive the acceleration component parallel to G, since it is the only acceleration vector that is independent of the pose and direction of the movement. In a four-second time window, if the power of the peak frequency exceeds a certain limit, peak frequencies between 1 and 6 Hz often refer to walking, fast walking and running. Naturally, frequency tends to rise concurrently with faster walking or running, but in the real world, ambiguities exist; for example, a car on a bumpy road can cause similar features. In practice, G parallel acceleration components of walking also depend upon the placement of the device in relation to the user. Placement at the belt or trouser pocket creates much more vertical movement than placement on the upper body, such as a jacket pocket or a shoulder strap. Thus in this work, placement on the shoulder strap was not the best alternative possible, which can be seen from the results. With an optimal positioning of the sensors for maximal movement, the results would probably be improved [8].
Environmental light was used in two ways: in detecting the light level, and the frequency of the flashing of light. In most artificial light sources, the frequency of flashing generated by the electronic power rectification can be detected to give cues whether the device is inside or outside. However, there are a lot of exceptions in the real world in this recognition, too. The electronic power rectification-based flickering can be detected from striplights and from incandescent lights, but is not present in plasma lights, nor lights that use Direct Current (DC) power source. Additional ambiguity in Indoors/Outdoors-reasoning based on detecting artificial light sources may be caused by outdoor artificial light sources such as streetlamps. 2.4 Quantization The features were chosen according to their ability to describe aspects of a real world context. To raise information expressiveness further, the meaning of the features is bound by quantising the information content of the data. In other words the processing step after the feature extraction is a signal-to-symbol conversion. Two ways of quantize features were used. First, crisp limits were applied for features requiring only a coarse distinction between the values of the feature, for example division into three categories, of which one is true and the others false. Secondly, fuzzy sets [14] were applied on features which require finer granulation, and for which crisp limit boundaries are not very clear. Hence, an output of the quantisation phase is a vector of context atoms caðnÞ ¼ ½a1 ; a2 ; . . . ; an �T for each quantisation time step (of one second), context atom 0 < ai � 1. Vectors ca(n) during k time steps form a dataset to be used as an input for the Bayesian classification. To obtain good quantisation limits for the audio related features, a histogram analysis was performed. Histograms from each feature for every audio related context were calculated. The quantisation limits were selected so that each atom could provide good recognition accuracy in terms of the histogram distribution. Figure 3 presents one of the scenarios after the feature extraction and quantisation phases. The numbers on the y-axis represent context atoms a, and the x-axis shows the time in seconds. The intensity colour (grey scale) shows the degree of membership. 2.5 Classification The problem was to infer the correct context of the user at each time step in a scenario, based on the given set of context atoms. In other words, the task was to classify each vector ca(n) into a set of context classes. The correct set of classes for each phase of the scenario is given
118
Fig. 3 Some of the quantised features (context atoms) in one scenario. The black vertical lines divide different phases in the scenario (see Table 1)
in Table 1. Two separate networks were used, one for audio-related contexts and one for other sensors. The amount of different atoms, n, in input vectors, was 47 for the audio network and 13 for the other network. Atoms 49-88 are shown in Fig. 3. The number of target classes was seven for the audio network and two for the other, nine in total. The theory of probability gives a solid ground for the classification task. Bayesian networks provide a flexible, noise resilient and intuitively Table 1 The scenario
interpretable framework for classification, as well as causal modelling [15–17]. Matlab Bayesian toolbox [18] was used for the classification.
2.5.1 Naive Bayes network The most straightforward and widely studied Bayesian classification method is the naive Bayesian classifier (Fig. 4). The structure of the naive Bayes classifier is a Directed Acyclic Graph (DAG) that represents the
Phase of the scenario
Correct set of contexts
1. Drive car 2. Run to the door 3. Walk to the elevator 4. Wait for the elevator 5. Elevator 6. Walk to the door 7. Open the door, go sit down 8. Make a phone call 9. End call, put on music 10. Classical music 11. Stop, change disc, play 12. Rock music 13. Stop music, walk to the tap 14. Take tap water 15. Walk to the table, sit 16. Eat 17. Conversation
(Car, Activity) (Other Sound, Running, Outside, Activity) (Other Sound, Walking, Inside, Activity) (Other Sound, Inside) (Elevator, Inside) (Other Sound, Walking, Inside, Activity) (Other Sound, Walking, Inside, Activity) (Speech, Inside) (Other Sound, Walking, Inside, Activity) (Classical music, Inside, Still) (Other Sound, Walking, Inside, Activity) (Rock music, Inside, Still) (Other Sound, Walking, Inside, Activity) (Tap water sound, Inside) (Other Sound, Walking, Inside, Activity) (Other Sound, Inside, Activity) (Speech, Inside)
119
Thus, if we get, for example, number 0.7 from the fuzzy layer for state 1 of a context atom, we get the likelihood ratio 0.7 : (1–0.7). In the experiment, virtual evidence is used for inferring. In the learning phase the fuzzy input is rounded to nearest integer.
C
3 The experiment
X1
X2
X3
Xn
Fig. 4 Structure of the naive Bayesian classifier
conditional probabilities with arrows between variables, and independence of variables if the arrow is missing. In Fig. 4, a class variable C is connected to the feature variables X1 ; . . . ; Xn representing conditional probabilities P(Xi|C). Despite the fact that feature variables are assumed to be independent of each other, which is rarely the case in reality, the structure often works well in practice [19]. The joint probability density function for the network is n Y P ðCj jX1 ; . . . ; Xn Þ ¼ P ðCÞ P ðXi jCÞ i¼1
Solving the P ðCj jX1 ; . . . ; Xn Þ gives the probability for the discrete class variable C to be in state j. 2.5.2 Learning the network parameters Estimating model parameters from the training data was carried out by finding the MAP (maximum a posterior) estimate, which maximises the posterior probability P(g|D), where g are the model parameters and D is the training data [17]: aijk þ Nijk h^ijk ¼ aij þ Nij Nijk are the number of case combinations in the data whereP i is the node with value k and parent j. Moreover, Nij ¼ k Nijk . The alpha terms are corresponding prior values. Uniform (aijk ¼ 1) distributions for priors were used in the experiment. 2.5.3 Virtual evidence Some features (fuzzy sets) are continuous values between 0 and 1, which cannot directly be interpreted as conditional probabilities of the states of the feature atoms [15]. Instead, they are converted to so-called virtual evidence, which is a likelihood ratio of the states of a variable P ðX jstate 1Þ : P ðX jstate 2Þ:
The Bayesian classification performance was evaluated using two kinds of data. The first data set was measured in controlled conditions and the second set in a real world scenario. First, nine (out of 13) individual context class data sets were recorded, each five times separately in controlled conditions. Four contexts (Walking, Running, Activity, Still) were utilised directly from the atoms, without classification, since no sensor fusion was required in those cases. The length of each nine-class data set was 30 seconds (divided into 30 sets of one second atoms), resulting in nine sets, each to the sum of 150 vectors. To create variability in the data, five samples of different songs from two albums were recorded (Rock and Classical music), two cars were used, and speech and acceleration-based contexts were recorded by four different persons. To test the recognition capability of the classifier in the optimal case, the same data was used for training and testing. To test the classifier performance in a real world situation, a scenario taking place in a home environment, shown in Table 1, was used. The scenario consists of a series of phases each containing multiple simultaneous contexts. Thus the recognition system is required to detect all the contexts that are present in each phase. Only those contexts that can be defined in each phase are counted. For example in the first segment (Car) it cannot actually be defined whether the person is Inside or Outside, and thus these contexts are not applicable. Another example is waiting for an elevator, where it cannot be defined whether one is still or active in that segment, and both are correct, and therefore these contexts are ignored in that segment. The scenario data was measured by five testees, who performed the scenario twice, resulting in ten test data sets with a length of 6–8 minutes. The last test data set had to be rejected later because sensor box wires had been broken during the recording. Thus the final amount of scenario data sets was nine, containing a total amount of about 60 minutes of data. To test the generalisation ability of the learned model, different songs were played from the two albums, and three different cars were used. In this real world case, manual on-the-fly segmentation is not accurate, labels are not always completely correct when compared to the real situation, and there are a lot of disturbances. Therefore, in order to find out the recognition accuracy with respect to the maximal performance with the scenario data, a two-step approach was used. First, the testing was performed using the same data as in the training,
120
to find out the maximal reference performance. Secondly, the actual performance was measured using cross validation, by leaving out in turn one of the nine data sets of the training data set being used as a test data set.
4 Recognition results To visualise the recognition history in a scenario, the results of one scenario (1 of 9) are shown as an intensity graph (Fig. 5), where the x-axis shows time and the yaxis shows the 13 context classes as a function of time. The black vertical lines on the graph represent the transition from one phase of the scenario (Table 1) into the next phase. The grey level of each step in the graph represents the probability of that step belonging to the corresponding class. Contexts Walking, Running, Activity and Still are derived directly from the context atoms, and thus for them the grey level represents fuzzy membership. The other nine are classified by two separate parallel naive Bayesian networks, one for the seven audio contexts, and one for the two contexts from other sensors. The resolution of one second used for atoms was in many cases short in respect to the nature of the phenomena, and therefore the final results were calculated after applying a five second moving average over the classified data. Table 2 presents the results averaged over all classified nine contexts, and over nine scenarios. Controlled condition data (first row) were measured separately from the scenario data in as ideal conditions as possible. Since the data for each context were measured separately, these data are free of the disturbances that were present while measuring the actual continuous scenario data (the results on rows 2 and 3). Hence, the controlled conditions experiment predictably yielded almost 100% accuracy in both, true positives and negatives. This can be viewed as a maximal accuracy in an optimal setup. Four percent error in true positives suggests that the data contain some similarities that cannot be discriminated with the current context atoms. In the real world situation, even if training and test data are the same, the recognition accuracy falls below 90% (row 2). The main reasons for the decrease are, first, coarseness of annotation, as it is not possible to label the correct answers precisely, and secondly, the undefined action that takes place each time a segment changes. Also, extra events often occur randomly when they should not, since the real world situation cannot be controlled. In theory, about eight percent of the error in true positives is explained by these factors. The results on the second row of Table 2 are calculated by using each individual data set as training data, while the same data set is used as the test data. Hence, the second row results can be viewed as a reference accuracy of the classifier in the specified setup with the real world scenario data. The actual classification results shown at the third row of the Table 2 must be viewed in comparison to the results in the second row. The actual performance (row 3) was
measured using cross validation, by leaving out in turn one of the nine data sets of the training data set being used as a test data set. Comparison of rows two and three clearly shows that the naive Bayesian networks model the data satisfactorily in this setup, and the amount of training data has been sufficient. The recognition results for each of the 13 individual contexts, averaged over nine scenarios, are shown in Table 3. The last row shows the system average, which accordingly includes both, Bayes-classified contexts, and direct contexts. Some important non-audio contexts such as Inside and Outside are recognised well in the scenario. The corresponding network contains as an input the atoms describing light and humidity. Acceleration-based contexts are extracted fairly well in this scenario, but there is a lot of variation in movement patterns among different persons and scenarios. The recognition of Walking is built based on detecting the frequency and intensity of vertical movement, and thus placement in a trouser pocket or on a belt would have been more optimal than a shoulder strap. Of course, the results concerning Walking and Running would be much better if the sensors were attached to, for example, a foot, but the basis of this study was that the sensors are attached into a personal mobile device and are not distributed onto clothes, shoes, etc. The choice was made because of the practical fact that people usually carry one device with them, and no sensors will be attached to anyone’s trousers nor shoes in the near future. Another factor affecting to the Walking results negatively is the coarseness of manual segmentation, for instance the scenario segments 9 and 11, where the task, to walk to the CD player, change the disc, and walk back to the sofa, is labeled as merely Walking, which of course is not true while you change the disc. The data was collected by five testees. The results shown are thus more generic than if the training data and test data had both been given by the same person. However, personalisation in the use of training data would enhance the results for some contexts that vary a great deal among different users, such as Speech. In this experiment, the recognition of Speech can be considered speaker-independent, and thus the accuracy of 91% is good. Concerning acceleration-based contexts, some testees never produced any context atoms that refer to the contexts Walking and Running due to their ‘skiing’ style of movement that contains negligible vertical accelerations, with the device placement on the shoulder strap. Context Activity is designed to indicate any movement of the device. Hence, while the user state is Walking or Running, there is also Activity. Context Still is the opposite of the Activity, and should be on when there is no movement of any kind. Some people are more active than others, so that while for some of the testees the context Still is in the correct segments, other testees are active during the whole scenario. In this sense, the recognition of, for example, contexts Still and Activity is practically 100% correct with respect to the real situation, but as some people tend to move while sitting
121
Fig. 5 Recognition results as an intensity graph, scenario number one of nine. The x-axis is time in seconds, y-axis is the context class, and the color intensity (greyscale) shows the probability (and in four cases, membership) of context. Black vertical lines mark the changes of the segments in the scenario. The description of each segment is shown above the graph, and in Table 1
on the sofa and listening to music although annotated Still, the actual numbers are much worse. This is partly a problem of scenario design, which should have contained a segment where the device is put on the table, for instance, so that the annotation could be set to Still and we would be sure that this annotation corresponded to the real situation.
122 Table 2 Three stages of classification accuracy results for the nine contexts classified using two naive Bayesian networks. The actual real world scenario results (row 3) can be compared to the maximum scenario results (row 2)
1. Controlled conditions, test data same as training data 2. Scenario data, test data same as the training data 3. Scenario data, leave-one-out cross validation
True positive %
True negative %
96
100
88
95
87
95
Table 3 Recognition results for each of the 13 individual contexts, averaged over nine scenarios. The last row shows the system average over all the 13 contexts, of which nine are classified and four are direct
Classical music Rock music Other Sound Speech Tap water Elevator Car Running Walking Activity Still Outside Inside System average
True positive %
True negative %
80 68 91 91 91 92 100 62 72 100 88 69 100 85
99 98 94 97 100 97 100 95 83 40 92 100 69 90
In the contexts that relied mainly on audio atoms, the best results were achieved in recognizing Car, Tap water and Elevator. For those contexts there were mainly one or two atoms that separated them quite clearly from the other contexts. For example tap water could be recognised directly from the low amount of harmonicity ratio and the high spectral centroid. In addition, those audio signals were continuous in time, unlike for example a speech signal. The recognition of Classical music, Rock and Speech signals suffers clearly from the strong variation between consecutive analysis windows, as well as between the training and testing data. The variation increases the randomness of features. Due to the variation there was not any single context atom that was clearly capable of distinguishing these contexts. Instead, a combination of several atoms was needed for recognition. Some variation in the audio atoms was noticed to be predictable. For example, the F0 feature formed a rectangular wave shape for speech sections. This predictability could be used to formulate more discriminative features for the varying signals. One of the problems in audio atom design was deciding the length of the time window. The atoms were used as input for the Bayesian classifier using a onesecond interval, and thus if the atoms were calculated using a longer window, delays were evident in the rec-
ognition, thereby decreasing accuracy. Some atoms were derived within a time window as long as 10 seconds, which still may be too short on some occasions. Even for humans the average recognition time for some everyday auditory scenes is 20 seconds [20]. On the other hand, duration of contexts in the testing data was short, from only a few seconds up to 30 seconds. Due to the length of the history window some atoms could not adapt fast enough to the context change. The measurement setup was natural, and thus far from ideal. Sources of confusion include birds singing outside, clinking of keys, the sound of the ‘director’s’ footsteps, sounds made by taking the CD out of its case, command replies of the measurement system, etc. As mentioned before, the transitions are naturally not as immediate as they should be, for example after driving one does not directly start running, but turns off the car engine, undoes the seatbelt, opens the door, gets out, closes the car door, and then starts jogging. Therefore, some of the seemingly odd mistakes in the recognition are actually correct if one looks at the raw data, but they still have to be treated as errors in accuracy calculation, which decreases numerical results.
5 Discussion and further work The ambitious aim of this work was to expand the collection of generally recognizable constituents of context, where personal mobile device usage is concerned. Even though the scenario setup was limited, some conclusions can be made about the genericity of recognition. It is quite obvious that most of the contexts recognized in the scenario are likely to be valid only locally, since most features potentially refer to many possible real world situations. Progress towards solving ambiguities requires more and more finely grained information at the lower levels of the context hierarchy and background knowledge modelling at the uppermost layers. Background knowledge was only used in the network structure setup for dividing the classifier into two networks, based on the underlying sensor types, and for quantisation limits. On the other hand, over-specific background knowledge modelling causes the loss of generality of the classification system as more and more context atoms become context dependent instead of being generic descriptors of the environment. Much of the performance depends on how specifically the context atoms can discriminate between the events. In addition to ambiguity, the traditional machine learning problem of generalizing beyond training data [21] may emerge, although the scenario in this study was limited enough to control that aspect. Failure in generalisation may cause difficulties in contexts that are complex at feature level or contain a lot of variation, such as Speech, which tends to be user specific. However, some contexts, such as Car, Elevator, Inside, Outside, Activity and Still, are quite distinctive, and even generic to a certain extent in the activities of a
123
mobile device user. Car, Tap water and Elevator were very well recognised. To achieve even better results for the other audio related contexts the variation of the audio signal over time should be modeled better. Predictable variation in feature data in some contexts could be recognised by taking the past values of the features into account. Concerning individual classes, the Other Sound context consists mostly of silence and occasional transient sounds. A sum of transients in a time window was not enough to distinguish events like walking in the corridor from eating. An approximation of the length and perceived pitch of the transient should be extracted in order to make this feature more effective for separating further detailed contexts from the Other Sound class. Bayesian networks are suitable for classifying incomplete information, and learning conditional probabilities is straightforward, requiring relatively little training data. Naive Bayes networks are computationally very efficient, and thus feasible for real time recognition. Training a naive Bayes classifier requires O(en) time, where e is the number of training examples, and n is the number of context atoms for each example. Inference requires O(cn) time where c is the amount of different classes. Hence, both training and inference have a complexity linear in the size of input data. In this experiment, the naive Bayesian classifier almost reaches the reference accuracy, which indicates that there were enough training data to explain the variability introduced in the data on purpose. Even though the naive Bayes independence assumption is violated, the classifier still performed well. In controlled conditions, only four percent of the data could not be classified correctly. Concerning time, the classification is performed independent of previous contexts; each second is treated individually. It is evident that the history of events provides additional context information, which in this experiment was not exploited. From that viewpoint the results are encouraging, and suggest that the introduced layer structure is feasible to be used as a base hierarchy in a more complex scenario setting, where complementary predecessor state information could be used by using a high abstraction level, for example a Markov Model layer, above the Bayes classifier layer. Although this study focused on contributing to longterm context awareness basic research, some of the contexts are recognised reliably enough to suggest even a possible near term applicability. An example of such a context is Car, which was recognized with an accuracy of 100% both in true positives and negatives. A very simple application would be a mobile device adapting to the context by changing its functionality (activate hands free, enable speech command interface), or changing the user profile (louder ring tone), or informing people trying to contact the user about her situation. However, even this simple application requires firstly studying, for example, how different clothing affects recognition, since in most practical situations the mobile device is often placed under some clothing. Despite the recent increasing
research interest in context awareness, the direct utilisation of sensor-based context recognition to gain truly useful applications is still difficult with the current technology.
6 Conclusions Naive Bayesian networks were applied to classify contexts of a mobile device user in her daily activities. The contexts were derived mainly from audio features with algorithms from the upcoming MPEG-7 standard. The recognition accuracy was good for most contexts on a time resolution of one second, with five second moving average. The recognition accuracy using leave-one-out cross validation was 87% of true positives, and 95% of true negatives, averaged over nine eight-minute scenarios containing 17 segments of different lengths and nine different contexts. Respectively, the reference accuracies measured by testing with training data were 88% and 95%, suggesting that the model was capable of covering the variability introduced in the data on purpose. The decrease of the benchmark baseline from 96% and 100% (to 88%, 95%) was mainly due to inaccuracy of labeling and uncontrollable real world conditions. The results indicate that the hierarchical representation of context information with the computationally efficient naive Bayes classification layer can fairly accurately recognise a set of at least nine activities even without modeling the predecessor states. As further work, a layer modelling history information in multiple temporal granularities above the introduced structure could be studied, for the purpose of recognising a larger amount of different classes in a more complex scenario. Some contexts, such as Car, are recognised reliably enough to suggest even possible near term simple applications. However, in non-trivial real world applications that require context awareness in a general sense, not restricted to a scenario, problems in genericity of recognition are caused by the ambiguity of some features referring to multiple contexts. In the future, more and more finely grained context atoms, more informative sensors, and utilisation of causality and background knowledge are required to make progress towards the distant goal. Acknowledgements The authors would like to acknowledge the funding provided by NOKIA.
References 1. Clarkson B, Pentland A (1998) Extracting context from environmental audio. Proceedings 2nd International Symposium on Wearable Computers, 154–155 2. Clarkson B, Mase K, Pentland A (2000) Recognizing user context via wearable sensors. Proceedings Fourth International Symposium on Wearable Computers, 69–76 3. Laerhoven K, Cakmakci O (2000) What Shall We Teach Our Pants? Proceedings Fourth International Symposium on Wearable Computers, 77–83
124 4. Ma¨ntyja¨rvi J, Himberg J, Korpipa¨a¨ P, Mannila H (2001) Extracting the context of a mobile device user. IFAC/IFIP/ IFORS/IEA Symposium on Analysis, Design, and Evaluation of Human-Machine Systems, 445–450 5. Himberg J, Ma¨ntyja¨rvi J, Korpipa¨a¨ P (2001) Using PCA and ICA for exploratory data analysis in situation awareness. Proceedings IEEE Conference on Multisensor Fusion and Integration in Intelligent Systems, 127–131 6. Madabhushi A, Aggarwal J (1999) A Bayesian approach to human activity recognition. Proceedings Second IEEE Workshop on Visual Surveillance, 25–32 7. Peltonen V, Tuomi J, Klapuri A, Huopaniemi J (2002) Sorsa T. Computational auditory scene recognition. Proceedings International Conference on Acoustics Speech and Signal Processing 8. Ma¨ntyja¨rvi J, Himberg J, Seppa¨nen T (2001) Recognizing human motion with multiple acceleration sensors. Proceedings IEEE International Conference on Systems, Man, and Cybernetics, 747–752 9. Minsky M (2000) Commonsense-based interfaces. Communications of the ACM 8: 67–73 10. Hinckley K, Pierce J, Sinclair M, Horvitz E (2000) Sensing techniques for mobile interaction. ACM User Interface Software and Technology, CHI Letters 2: 91–100 11. Brown J, Puckette M (1989) Calculation of ‘Narrowed’ autocorrelation. Journal of Acoustical Society of America 4: 1595– 1601
12. Saunders J (1996) Real-time discrimination of broadcast speech/music. Proceedings International Conference on Acoustics Speech and Signal Processing, 993–996 13. Penttila¨ J, Peltola J, Seppa¨nen T (2001) A speech/music discriminator-based audio browser with a degree-of-certainty measure. Proceedings Infotech Oulu International Workshop on Information Retrieval, 125–131 14. Zadeh L (1965) Fuzzy sets. Information and Control 8: 338– 353 15. Pearl J. Probabilistic Reasoning in Intelligent Systems. Revised second printing. Morgan Kaufmann, San Francisco, 1988 16. Langley P (1994) Induction of Selective Bayesian Classifiers. Proceedings Tenth Conference on Uncertainty in Artificial Intelligence, 399–406 17. Monti S, Cooper G. A Bayesian Network Classifier that Combines a Finite Mixture Model and a Na Bayes Model. (Tech. Rep. No. ISSP-98-01). University of Pittsburgh, 1998 18. Bayes Net Toolbox Documentation. http://www.cs.berkeley.edu/~murphyk/Bayes/bnt.html 19. Langley P, Iba W, Thompson K (1992) An analysis of Bayesian classifiers. Proceedings 10th National Conference on Artificial Intelligence, 223–228 20. Peltonen V, Eronen A, Parviainen M, Klapuri A. Recognition of everyday auditory scenes: potentials, latencies and cues. Proceedings 110th Audio Engineering Society Convention, Amsterdam, Netherlands, 2001 21. Mitchell T. Machine Learning. McGraw-Hill, 1997