Earthquakes and Structures, Vol. 12, No. 6 (2017) 000-000 DOI: https://doi.org/10.12989/eas.2017.12.6.000
000
Bayesian-based seismic margin assessment approach: Application to research reactor Shinyoung Kwag, Jinho Oh, Jong-Min Lee and Jeong-Soo Ryu Research Reactor Mechanical Structure Division, Korea Atomic Energy Research Institute, 111 Daedeok-daero, Yuseong-gu, Daejeon 34057, Republic of Korea
(Received January 10, 2017, Revised May 22, 2017, Accepted June 19, 2017)
A seismic margin assessment evaluates how much margin exists for the system under beyond design basis earthquake events. Specifically, the seismic margin for the entire system is evaluated by utilizing a systems analysis based on the sub-system and component seismic fragility data. Each seismic fragility curve is obtained by using empirical, experimental, and/or numerical simulation data. The systems analysis is generally performed by employing a fault tree analysis. However, the current practice has clear limitations in that it cannot deal with the uncertainties of basic components and accommodate the newly observed data. Therefore, in this paper, we present a Bayesian-based seismic margin assessment that is conducted using seismic fragility data and fault tree analysis including Bayesian inference. This proposed approach is first applied to the pooltype nuclear research reactor system for the quantitative evaluation of the seismic margin. The results show that the applied approach can allow updating by considering the newly available data/information at any level of the fault tree, and can identify critical scenarios modified due to new information. Also, given the seismic hazard information, this approach is further extended to the real-time risk evaluation. Thus, the proposed approach can finally be expected to solve the fundamental restrictions of the current method. Abstract.
seismic margin assessment; seismic probabilistic risk assessment; fault tree analysis; Bayesian inference; research reactor; fragility analysis; hazard curve Keywords:
1. Introduction The quantitative procedures to calculate the risk metrics or seismic margin for beyond design basis events regarding nuclear systems under external hazard events of earthquakes are called seismic probabilistic risk assessment (SPRA) (USNRC 1975, USNRC 1983, Yu et al. 1989, Ellingwood 1994, Vermaut et al. 1988, IAEA 1992, EPRI 1994, Fullwood 2000, ASME/ANS 2009, ASCE 2016) or seismic margin assessment (SMA) (Budnitz et al. 1985, EPRI 1991). Specifically, USNRC proposes an SPRA methodology for a nuclear power plant subjected to a seismic external hazard. This method has been applied to many existing plants such as the Diablo Canyon Nuclear Power Plant, the Oyster Creek Unit 1 Nuclear Generating Station, and the Zion Nuclear Power Station (EPRI 1994). IAEA also explains this method in the technical guide (IAEA 1992). This method calculates a plant level risk metric using a convolution of a system level fragility curve combining the basic event (i.e., the basic structures and equipment)’s fragilities in terms of systems analysis, and a seismic hazard curve. The basic event’s fragility curves are probabilistically obtained using empirical, experimental, and/or numerical simulation data in the seismic hazard’s intensity domain. The hazard curve is probabilistically
Corresponding author, Senior Researcher, Ph.D. E-mail:
[email protected] Copyright © 2017 Techno-Press, Ltd. http://www.techno-press.com/journals/eas&subpage=7
estimated by identifying and integrating hazard sources, size, propagation characteristics, developed prediction model, etc. However, the current practice in SPRA has limitations in that it cannot cope with uncertainties of basic event fragilities or accommodate newly observed data. Since the SPRA is an integrated process that includes seismic hazard information, fragility data, systems analysis, and consequence evaluation, the SMA methodology is developed in order to avoid the cumbersome hazard analysis task. This method is intended to show the seismic margin over the design earthquake level to quantify the plant safety while the SPRA provides estimates of the seismic risk in terms of annual frequency of core damage, large radioactive material release, or adverse public health effects. Hence, this involves fragility analysis and systems analysis, except for the seismic hazard information, and thus it can only answer questions on how much margin exists above the design basis earthquake event. Further, this method is not yet able to handle uncertainties of the fragilities of basic events or newly available data for evaluation of the seismic margin. In the structural engineering area, a number of researchers have tried to incorporate additional data into the existing seismic fragility curve through a Bayesian inference technique. Let us consider a few representative examples. Gardoni et al. (2002), using extensive experimental data, present a Bayesian framework to determine the seismic fragility of reinforced concrete bridge components. Straub and Der Kiureghian (2008) employ the Bayesian inference to construct fragility curves of electrical ISSN: 2092-7614 (Print), 2092-7622 (Online)
Shinyoung Kwag, Jinho Oh, Jong-Min Lee and Jeong-Soo Ryu
sub-station equipment using empirical observations of seismic performance. Koutsourelakis (2010) suggests a Bayesian framework to develop fragility surfaces and applies it to geotechnical problems. A common context in all of these studies is that under uncertainties of ground motion and structure, additional data such as analysis, experiment, and field information are used to construct and update the median seismic fragility curves. However, these research works are focused on a single structural system having only a few failure modes. This method of single component level updating has not yet been extended to the entire system level. The currently used methodology for a systems analysis at a nuclear facility is an event tree approach linked with a fault tree analysis. From an analysis perspective, the approach depends solely on the fault tree analysis for the modeling and assessment of system-level failures since the desired end event of core damage (CD) in event trees combined with the fault trees can be mapped into a single integrated fault tree and this integrated fault tree is only solved for obtaining the total risk of the entire system. Therefore, the intrinsic characteristics of the standard fault tree analysis include the limitations in that Aleatory and Epistemic uncertainties in the basic events are not explicitly considered and it cannot accommodate additional data in the fault tree formalism. To resolve the problems mentioned above, a few techniques have been attempted to integrate into current systems analysis, a standard fault tree (FT). The uncertainties of basic events in standard FT analysis have been addressed mainly by adopting Monte-Carlo simulation (Rasmussen 1975, Hakata 2007), Latin hypercube sampling (Ellingwood 1990, Kim et al. 2011, Kwag and Ok 2013) or Fuzzy set theory (Tanaka et al. 1983, Singer 1993). The Bayesian updating strategy has been used to attempt to fully accommodate newly available data at any system level of the FT analysis (Hamada et al. 2004, Kelly and Smith 2009, Kwag and Gupta 2016, 2017, Kwag 2016). However, the techniques used are still limited to addressing nothing but the risk values within the fault tree formulation, without taking the seismic fragilities into account. Also, the uncertainties considered in those studies are restricted to the inherent randomness. Under this background, a novel SMA approach combining FT analysis and the Bayesian inference based on seismic fragility data of basic events is proposed in this study. The proposed approach is first applied to the nuclear research reactor plant for seismic margin evaluation. Due to the inherent characteristics of the Bayesian inference, the proposed approach can consider uncertainties of fragilities of basic events and include new, additional information at any level of the fault tree. In addition, this method can identify important updated critical paths with real-time field or up-to-date experimental data. Finally, this method can solve the fundamental restrictions of the current SMA method, specified above, and the shortcomings of typical FT analysis. Besides this, this approach can be extended to the SPRA process if the end result of the seismic fragility is convoluted with the seismic hazard information. This paper is organized as follows. In section 2, the
seismic fragility analysis method is recapitulated. In section 3, the basic concepts of FT analysis and the Bayesian inference are introduced. The introduction of the concepts is limited to the aspects that are necessary in this study. In section 4, we describe the proposed approach. Basically, the current SMA procedure is integrated with the Bayesian inference to deal with additional observed data. Section 5 illustrates the performance of the proposed approach when applied to an example of a pool-type research reactor system; this section also discusses important findings. For this, we compare the results of conventional FT analysis with those of the proposed method by utilizing several cases. Section 6 concludes with a summary and discussion.
2. Seismic fragility analysis method Seismic fragility analysis is employed to determine the relationship between a specific intensity parameter such as the moment magnitude (Mw), the peak ground acceleration (PGA) or the spectral acceleration (Sa) of an earthquake and the corresponding probability of structural failure. Specifically, the seismic fragility of a structure, system, or component (SSC) is defined as the conditional failure probability to attain or exceed a specified performance function, G, under a given measure of the specific intensity parameter IP. It can be stated as
Pf P G 0 | IP
(1)
in which G is a function of the random variables representing the uncertainties of the material properties, modeling, and loading conditions of a SSC. This can be described in a very simple form as follows
G C D
(2)
where C denotes the “capacity” of the SSC corresponding to the specified loading condition and D represents the response “demand” according to the given hazard intensity parameter. The capacity C is usually a representative value evaluated from material properties, yield stress, ultimate stress, etc. based on the design codes and standards. The response demand D is the structural responses obtained from the numerical models, earthquake time histories, damping, frequency, coupling, soil structure interaction, etc. from an analysis perspective or from experimental data or field observation. Various methods have been proposed for the fragility analysis of the SSC, especially under the seismic intensity of an earthquake hazard, based on empirical, experimental, and/or numerical simulation data (EPRI 1994, Shinozuka et al. 2000, Gardoni et al. 2002, Straub and Der Kiureghian 2008, Koutsourelakis 2010, Ju et al. 2013, Balasubramanian et al. 2014, Kwag et al. 2014, Lee and Moon 2014, Jung and Ju 2015, Chen and Chen 2016, Mosleh et al. 2016, Kwag 2016). These can be broadly grouped according to the following classifications: (1) Factor of safety method (2) Monte Carlo simulation (MCS) based method (3) First/Second order approximation based method (4) Statistical inference approach
Bayesian-based seismic margin assessment approach: Application to research reactor
Most seismic fragility curves determined using these methods have been assumed to follow a log-normal cumulative distribution function. If the seismic intensity parameter IP is defined by PGA, then failure probability can be expressed as the following equation
ln a ln AM Pf PGA a R
(3)
where Φ[∙] is the standard normal cumulative distribution function; a is a specific PGA value; AM is the median seismic capacity; βR is the logarithmic standard deviation of the cumulative distribution function. In case of AM, it has some degree of the uncertainty typically represented by a lognormal distribution having median Am and logarithmic standard deviation βu. These two logarithmic standard deviations represent two types of uncertainties. βR is a deviation of the inherent randomness, which cannot be reduced by increasing knowledge, i.e., Aleatory uncertainty. βu is a deviation of the uncertainty which represents the lack of complete knowledge about the material properties, modelling assumption, etc., which is typically called Epistemic uncertainty.
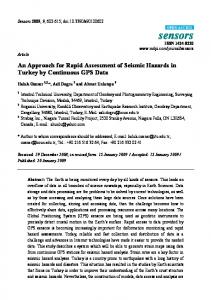
3. Basic concepts: Fault tree analysis and Bayesian inference 3.1 Fault tree (FT) analysis A fault tree diagram is a graphical decomposition into intermediate events and basic events through the use of logical gates (AND and OR gates) for an undesirable event representing system failure (denoted as top event TE). The basic events are characterized by Boolean states that represent “failure” or “safe” states. The basic events are considered to be statistically independent. The basic events are connected through the logic gates to characterize the intermediate events. The intermediate events are also connected through the logic gates up to the TE. To begin with, a qualitative evaluation is used to develop the logical expression for the TE. Boolean algebra is used to obtain the minimal cut-sets. The order of a minimal cutset is the number of basic events that contributes to the particular minimal cut-set. For illustration purposes, let us consider an example of a simple fault tree, as shown in Fig. 1. In this figure, C1, C2, C3, and C4 represent four basic events. The values IE1 and IE2 are the intermediate events produced through the combination of the basic events by the logic gates. Therefore, we can write a logical expression for the top event as: TE = (C1∪C2)∪(C3∩C4). The corresponding Boolean algebra is (C1+C2)+(C3·C4) and a total of 3 minimal cut-sets exist, namely, C1, C2 and C3∙C4. The minimal cut-sets C1 and C2 are of first order and the minimal cut-set C3∙C4 is of second order. Finally, a quantitative analysis is conducted to compute the probability of occurrence of the TE and to determine the importance measure for each minimal cut -set. The probability of occurrence of the TE is calculated using the
Fig. 1 An example of simple fault tree (FT)
following equation n P TE P M i i 1
n
n
PM PM M i
i 1
i
j
1
n 1
P M 1M 2
i j 2
Mn
(4)
where M1, M2, …, Mn represent the minimal cut-sets and n is the total number of minimal cut-sets. The importance measure (IM) analysis calculates the contribution of the minimal cut-sets to the occurrence of TE and accordingly identifies the critical scenarios/events. Methods for assessing the IMs are: Birnbaum, Criticality, Fussell-Vesely, Risk-Reduction Worth, and Risk-Achievement Worth measures of importance (Modarres et al. 1999). In this study, the importance measure of the minimal cut-set of Fussell-Vesely (1975) is employed according to IM F M i / F M
(5)
where F(M) is the total risk from all minimal cut-sets; F(Mi) is a risk only from the minimal cut-set Mi. These obtained IMs compute the overall percent contributions of minimal cut sets to the total risk. 3.2 Bayesian inference The fragility curve calculated from Eq. (3) can change due to the availability of new data from empirical, experimental, or high fidelity simulations. Consequently, the fragility curve needs to be updated. The Bayesain theorem facilitates the incorporation of additional data d into the current fragility model. The “prior” fragility curve Pf prior a; θ is updated to evaluate a “posterior” fragility post curve Pf a | d by the following equations
Pf post a | d Pf prior a; θ f θ | d dθ f θ | d
f d | θ f θ
f d | θ f θ dθ
(6)
(7)
where θ is the parameter of the defined probabilistic fragility model such as AM and βR, f θ | d is the posterior joint probability density function (PDF), f d | θ is the likelihood function, and f(θ) is the prior joint PDF of the
Shinyoung Kwag, Jinho Oh, Jong-Min Lee and Jeong-Soo Ryu
parameters of the fragility model. The likelihood function is formulated as Eq. (8) because the performance-based risk assessment approach allows a representation of the data as a binomial event with the probability of system failure taken as Pf prior ai ; θ and the probability of non-failure as 1 Pf prior ai ; θ k ri ni ri n f d | θ i Pf prior ai ; θ 1 Pf prior ai ; θ (8) i 1 ri
where d is the kth number of data as formatted in T T T d a1 ak r1 rk n1 nk with number of observed failure ri out of total number of events ni at a given a = ai; and Π is the product of all k of a = ai levels. For the likelihood function to incorporate the multi-level discrete data within a fault tree, it can be expanded to a binomial PDF as
L D f d1 | θ1
f d m | θm
(9)
where dm is discrete data which has same format like d at any level of events such as basic events, intermediate events or top events; θm is the parameter related to the fragility models in the corresponding event; m is the total number of data sets regarding the events; and D is the total data set consisting of d1 to dm. For a higher dimension problem, solutions of Eqs. (6) and (7) are mathematically intractable in most cases. Therefore, in this study, we use a Gibbs sampling algorithm to overcome this restriction. The implementation of Gibbs sampling is achieved by adopting the JAGS of R code (Plummer 2003).
4. Proposed approach: FT analysis combined with Bayesian inference based on fragility data In the seismic probabilistic risk assessment (SPRA) and the seismic margin assessment (SMA) methods, fragility analysis is necessitated and executed for basic SSCs (hereafter referred to as basic events) selected after a plant walk-down and screening process. In order to quantify the representative seismic fragility of an entire system failure event that induces direct core damage, systems analysis needs to be performed by employing the event tree and fault tree formulation. Current systems analysis in the SMA and SPRA is an event tree approach linked with a fault tree analysis. From an analysis perspective, the approach depends only on the fault tree analysis for the modeling and assessment of system-level failures because the desired end event of core damage (CD) in event trees combined with the fault trees can be mapped into a single integrated fault tree. The end result of the desired risk, denoting the annual core damage frequency, can be obtained by integrating the attained system fragility curve and the seismic hazard information for the site of interest. However, the currently used fault tree based systems analysis has some limitations: (1) it cannot account for Aleatory and Epistemic uncertainties, (2) it cannot carry out the updating of scenarios brought about from the availability of new data,
and (3) it cannot identify the modified critical path (i.e. the most vulnerable scenario). Therefore, in this section, a fault tree analysis combined with the Bayesian inference, which can consider Aleatory and Episdemic uncertainties of the seismic fragility data of basic events and accommodate newly observed data at any system level, is newly proposed. Specifically, each basic event’s seismic fragility curve is quantified by the method of chapter 2 under the assumption that the event conforms to the log-normal distribution. The parameters of the log-normal seismic fragility curve, AM and βR, are estimated to express the median seismic capacity and randomized uncertainties. To take into account the variation of AM due to the insufficient knowledge, βu is also evaluated. With the identified basic events, their fragilities, and relations among those, the fault tree is developed for the system failure event leading to core damage. Within this fault tree structure, AM is characterized by a log-normal distribution having median Am and log-standard deviation βu; βR is described as a uniform distribution for dealing with the uncertainties of each seismic fragility of basic event. Under the prior distributions of fragilities of basic events, the newly available data about any level including basic, intermediate, and top event fragilities in terms of the binomial data (r failure out of total n observance at a given PGA a) are incorporated into the developed fault tree structure through the Bayesian theorem, which is introduced in section 3.2. As a result, the prior distributions of all levels of event fragilities are updated as the posterior distributions based on the newly observed data. These updated results possibly alter the critical path and change the end result of the risk. Here, the uncertainties of basic event fragilities and the Bayesian theorem are implemented using Gibbs sampling of MCMC technique. Consequently, this proposed approach can consider the uncertainties of fragilities of basic events and new, additional information on any level. Accordingly, these characteristics can solve fundamental restrictions of the currently utilized method and, finally, be expected to allow the reflecting of continuing real-time data into the system risk calculation throughout the period of system operation.
5. Application Example: Nuclear research reactor system 5.1 Description of research reactor system and its safety functions: Pool-type research reactor A research reactor is a nuclear reactor which employs a neutron source in various utilizations. The utilizations include but are not limited to neutron scattering, neutron radiography, neutron activation analysis, neutron transforming doping, non-destructive test, irradiation test of materials, fuel testing for nuclear power engineering, production of radioisotopes, public outreach, education, etc. (IAEA 2001, Kwag et al. 2011, Kwag et al. 2012, Kwag et al. 2014,). Research reactors can be categorized into several types (Brynda et al. 1978). Out of these, the open pool-type research reactor is the most popular due to the easy accessibility to the reactor and primary cooling system, with
Bayesian-based seismic margin assessment approach: Application to research reactor
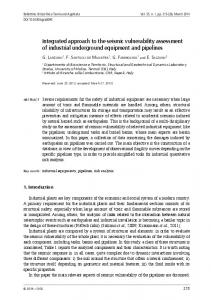
*Ci: basic events, IEi: intermediate events, RR: research reactor, CD: core damage, Sys.: System, Struc.: structure, Elec.: electrical, Auto.: automatic, Oper.: operation Fig. 2 Fault tree for failure of research reactor system leading to core damage 1
1
For an external hazard of seismic event, a fault tree for the research reactor system failure has been developed. Entire system failure is defined as a situation of direct core damage. Core damage is induced by failure of the safety functions mentioned above. Specifically, research reactor system failure can mainly come from structure failure, I&C system failure, beam tube rupture, coolant system failure and electric power failure. The structure failure consists of structure integrity failures of main buildings, a reactor structure assembly and pool operation facilities. The I&C system failure is caused from the RPS, APS and corresponding electrical system failures. Beam tube rupture
f
(b)
0.8
0.8
0.6
0.6 C1 C2 C3 C4 C5
0.4 0.2 0
0
1
2
3
4
C6 C7 C8 C9 C10
0.4 0.2
5
1
0
0
f
Probability of failure ( P )
4
5
0.4
C16 C17 C18 C19 C20
0.6 0.4
0.2
0.2
0
1
2
3
4
5
1
0
0
1
2
3
4
5
1 (e)
f
3
0.8
C11 C12 C13 C14 C15
0.6
(f)
0.8
0.8
0.6
0.6 C21 C22 C23 C24 C25
0.4 0.2 0
2
(d)
0.8
0
1
1 (c)
Probability of failure ( P )
5.2 Development of fault tree for research reactor system failure
Probability of failure ( P )
(a)
light water under normal pressure. So, this study is focused on the safety of open pool-type research reactors. The safety functions of research reactors to prevent core damage can mainly be described as: (1) controlling reactivity, (2) maintaining the coolant inventory, and (3) removing the core decay heat. The function of controlling reactivity is associated with the proper responses of the reactor protection system (RPS), the alternative protection system (APS), and the corresponding instrument & control (I&C), electrical and mechanical system. Maintaining the coolant inventory is determined by major structural system integrities and the successful function of the pool isolation valve. Removing the core decay heat depends on appropriate functions of the primary cooling system (PCS) and natural circulation. Therefore, a failure of the research reactor system that induces core damage can be defined based on the responses of these systems corresponding to reactor safety functions.
0
1
2
3 PGA (g)
4
0.4
C26 C27 C28 C29
0.2
5
0
0
1
2
3
4
5
PGA (g)
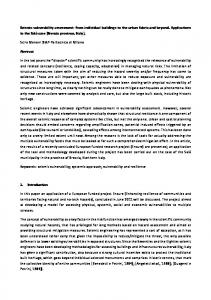
Fig. 3 Seismic fragility curves for basic events of fault tree of Fig. 2
can cause severe loss of coolant accident, which can extend to the core damage. Coolant system failure can result from malfunction of the PCS, natural circulation and reactor trip. Lastly, if a loss of electric power occurs, the pumps needed to circulate coolant come to stop and this induces damage to the reactor core. The detailed fault tree is illustrated in Fig. 2; related information is represented in Table 1.
Shinyoung Kwag, Jinho Oh, Jong-Min Lee and Jeong-Soo Ryu
Table 1 Seismic fragility analysis results for basic events of fault tree of Fig. 2 βr
βu
1.70
0.29
0.24
1.90
0.29
0.21
2.00
0.29
0.26
Support plate 1.40
BEs
SSCs
C1
Reactor Building (RB)
Bending
C2
Bending End fitting
C4
Service Building (SB) Reactor Structure Assembly (RSA) Pool Platform (PP)
C5
Pool Cover (PC)
C6
1E Cable Tray (CT)
C3
Failure Mode Am (g)
0.29
0.21
2.00
0.29
0.26
Tube bending 1.80
Beam
0.29
0.18
1E 125V DC Battery Rack frame 1E 125V DC Distribution C8 Function Panel 1E 120V UPS C9 Function Distribution Panel Reactor Protection System C10 Function (RPS) cabinet RPS reactor trip actuation C11 Function panel for CRDM RPS reactor trip actuation C12 Function panel for SSDM RPS Manual Trip Safety C13 Function Panel Alternative Protection C14 Function System (APS) Thermal Column C15 Fastener Assembly (TCA) Thermal Column Flange C16 Bolt (TCF) C17 Beam Tube (BT) Tube bending Beam Port Housing C18 Housing (BPH) Primary Cooling System C19 Base plate (PCS) pump C20 PCS decay tank (DT) Skirt shell
1.60
0.31
0.21
2.20
0.29
0.39
2.10
0.29
0.41
2.50
0.29
0.42
2.20
0.29
0.33
2.20
0.29
0.33
3.40
0.29
0.42
2.50
0.29
0.42
6.50
0.29
0.21
2.70
0.29
0.25
8.00
0.29
0.23
6.30
0.29
0.26
2.70
0.29
0.25
1.50
0.29
0.27
C21
3.00
0.39
0.39
1.60
0.29
0.26
1.70
0.29
0.26
3.50
0.09
0.14
3.50
0.09
0.14
1.50
0.09
0.14
1.50
0.09
0.14
1.30
0.33
0.30
1.10
0.36
0.30
C7
C22 C23 C24 C25 C26 C27 C28 C29
PCS piping Weldolet Control Rod Drive Weldment Mechanism (CRDM) Second Shutdown Drive Rod end Mechanism (SSDM) PCS Flap Valve #1 (FV Body cover #1) PCS Flap Valve #2 (FV Body cover #2) PCS Siphon Break Valve Yoke leg #1 (SBV#1) bending PCS Siphon Break Valve Yoke leg #2 (SBV#2) bending 480V Motor Control Function Center (MCC) 480V Electrical Diesel Function Generator (EDG)
5.3 Seismic fragility analysis results From the safety functions of the research reactor system and the fault tree formulation above, the basic events can be identified. Seismic fragility analyses for these basic events are performed using the method detailed in chapter 2. For the building structures, the fragility parameters are evaluated using the specific information of the design
report. For the major mechanical structures and passive equipment, the fragility curves are obtained based on the original design analyses. For the electrical components and active equipment, analysis, testing and the combination of both are utilized to acquire the fragilities. All seismic fragility curves corresponding to the basic events of fault tree are obtained as log-normal distributions having different medians Am’s, and log-standard deviations βr’s and βu’s. The failure modes and fragility parameters are represented in Table 1. Am represents median seismic capacity of SSCs. The log-standard deviations βr and βu denote the Aleatory and Epistemic uncertainties, respectively. The detailed fragility curves are described in Fig. 3. 5.4 Application of proposed approach Case 1 - Typical FT analysis and critical path: Firstly, a typical FT analysis is conducted. The Boolean expression for the system failure event S of this fault tree is as follows S C1 C 2 C 3 C 4 C 5 C 6 C 7 C 8 C 9 C10 C11 C12 C13 C14
C15 C16 C17 C18 C19 C 20 C 21 C 22 C 23 C 24 C 25 C 26 C 27 (10) C 28 C 29
The qualitative approach of FT analysis obtains total 25 minimal cut-sets as C1, C2, C3, C4·C5, C6·C7, C8, C9, C10·C13·C14, C11·C13·C14, C12·C13·C14, C15, C16, C17, C18, C19·C22, C19·C23, C19·C24·C25·C26·C27, C20·C22, C20·C23, C20·C24·C25·C26·C27, C21·C22, C21·C23, C21·C24·C25·C26·C27, C28, and C29. For the quantitative approach of FT analysis considering uncertainties of the fragility data of Table 1, Eq. (11) is formulated for the distribution parameter of each basic event of Table 1
Ci ~ LN AM , R AM ~ LN Am , u
(11)
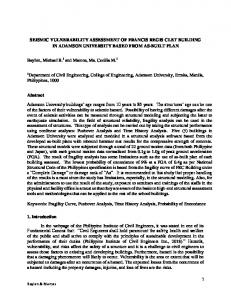
R ~ Uniform 0.85 r ,1.15 r where LN denotes the log-normal distribution and Uniform represents the uniform distribution. In this study, βR is assumed to follow the uniform distribution within ±15% of its mean value of βr. We implement quantitative FT analysis through the use of MCMC method (Gibbs sampling of JAGS in R). A total of 50,000 samples are used including 10,000 burn-in samples. The mean results of the intermediate and system failure events are illustrated in Fig. 4. The importance measures (IMs) of minimal cut-sets evaluated using Eq. (5) are represented in Table 4. Accordingly, the critical path is identified as shown in Fig. 8. Case 2 - FT analysis with Bayesian inference (evidence in a basic event): Secondly, we apply the proposed approach to the fault tree shown in Fig. 2 in order to illustrate the concept of updating to incorporate new data in a basic event. Let us consider that new data is available on the seismic performance of the reactor building (C1). These data can be achieved through any of a multiple possible sources such as experiments, simulation studies, or even experience data. These are typically characterized as a type
Bayesian-based seismic margin assessment approach: Application to research reactor 1
1
0.6
0.6 C1 C2 C3 C4 C5
0.4 0.2 0
0
1
2
3
4
C6 C7 C8 C9 C10
0.4 0.2
5
1
0
0
f
1
2
3
4
5
1 (c)
Probability of failure ( P )
7
(b) 0.8
Probabiliy Density Function (PDF)
f
Probability of failure ( P )
(a) 0.8
(d)
0.8
0.8
C11 C12 C13 C14 C15
0.6 0.4
0.4
0.2
0.2
0
0
0
1
C16 C17 C18 C19 C20
0.6
2
3
4
5
5 4 3 2 1 0
0
1
2
3
4
w/o evidence w/ evidence
6
0
1
2
3
4
5
PGA (g)
5
(a) PDF of AM for fragility curve of C1 1
1 (f)
0.6 C21 C22 C23 C24 C25
0.4 0.2
0
1
2
3
4
0.8
0.4
C26 C27 C28 C29
0.2
5
0
0
1
PGA (g)
2
3
4
f
0.6
0
1
0.8
Probability of failure ( P )
f
Probability of failure ( P )
(e) 0.8
5
PGA (g)
Fig. 4 Seismic fragility curves for intermediate and system failure events of fault tree (case 1)
0.6
0.4 w/o evidence (Median) w/ evidence(Median) w/o evidence (95% CI) w/ evidence (95% CI)
0.2
Table 2 Evidence in C1 (case 2) PGA r/n
0.2 g
1.0 g
1.6 g
1/30
15/30
25/30
0
0
1
2
3
4
5
PGA (g)
(b) Fragility curve of C1 Fig. 5 Probability distribution of C1 with and without evidence (case 2) 1
0.8
f
Probability of failure ( P )
of binomial data. Table 2 shows the specific data of case 2 of this study. The values of r and n respectively denote the number of failures and total number of seismic events at a certain PGA. This additional information is incorporated into the fault tree by using the Bayesian inference and updating the prior distributions for events. As a result of the proposed approach, Fig. 5(a) illustrates the prior and posterior PDFs of AM for the fragility curve of C1. Fig. 5(b) shows prior and posterior fragility curves of C1 including a 95% confidence interval (CI). It is observed that the median seismic capacity Am is decreased and corresponding uncertainties are reduced. From these results, we can see that the Bayesian inference technique is quite instrumental in the significant reduction of the 95% CI. The reason that the wide CI of the prior shrinks to the narrow CI of the posterior is that more knowledge on C1 derived from the terms in Table 2 can reduce the epistemic uncertainty of the envisioned seismic capacity. Fig. 6 shows the prior and posterior fragility curves for intermediate and system failure events at IE1 and S, along with curves of C1. The additional information on C1 has first modified the prior distribution of C1. This updating results by C1 has influenced the upper level fragilities, as shown in Fig. 6. It is noteworthy that this updated result, incorporating the additional information, can never be discovered by conventional FT analysis. Case 3 - FT analysis with Bayesian inference (evidence
0.6 C1 IE1 S updated C1 updated IE1 updated S
0.4
0.2
0
0
1
2
3
4
5
PGA (g)
Fig. 6 Comparison of prior and updated fragility curves of C1, IE1, and S events (case 2)
in an intermediate event) and modified critical path: Thirdly, let us consider a case in which we have data in an intermediate event, unlike case 2. The newly observed data is available in the electrical system failure event (IE4). Table 3 shows the specific binomial data of case 3. In this case, it is expected that the new data in the intermediate event level can forwardly update the intermediate failure and system failure events above the IE4, and also inversely change the intermediate failure and basic failure events below the IE4 level.
Shinyoung Kwag, Jinho Oh, Jong-Min Lee and Jeong-Soo Ryu
Table 3 Evidence in the electrical system failure event IE4 (case 3) PGA r/n
0.2 g
0.4 g
0.6 g
5/30
14/30
18/30
f
Probability of failure ( P )
1
f
Probability of failure ( P )
1 0.8 0.6 0.4 C9 updated C9
0.2 0
0
1
2 3 PGA (g)
4
5
0.8 0.6 0.4 S updated S
0.2 0
0
1
2 3 PGA (g)
4
5
Fig. 7 Comparison of prior and updated fragility curves of C9 (left) and S (right) events (case 3) Table 4 Importance measure for case 1 and case 3 Minimal Cut-Sets (MCS)
Importance Measure (%) Case 1
Case 3
C1
4.93
2.01
C2
1.97
0.80
C3
1.23
0.50
C4·C5
0.15
0.06
C6·C7
0.20
0.08
C8
0.48
0.07
C9
0.77
59.55
C10·C13·C14
1.12E-09
4.56E-10
C11·C13·C14
4.63E-09
1.89E-09
C12·C13·C14
4.63E-09
1.89E-09
C15
7.95E-09
3.25E-09
C16
0.05
0.02
C17
5.47E-11
2.24E-11
C18
1.61E-08
6.58E-09
C19·C22
2.37E-03
9.67E-04
C19·C23
1.51E-03
6.19E-04
C19·C24·C25·C26·C27
2.87E-100
1.17E-100
C20·C22
0.62
0.25
C20·C23
0.40
0.16
C20·C24·C25·C26·C27
7.57E-98
3.09E-98
C21·C22
0.02
7.63E-03
C21·C23
0.01
4.88E-03
C21·C24·C25·C26·C27
2.26E-99
9.26E-100
C28
31.23
12.77
C29
57.93
23.69
Fig. 7 shows prior and updated fragility curves of C9 and S events. As we can see in Fig. 7, the additional data of Table 3 have a huge impact on the fragility results at component and system levels in both directions with reference to the data available level. These updated results furthermore change the critical path compared to case 1
which does not take the new data into account. The modified critical path and related IMs of the minimal cutsets are represented in Fig. 8 and Table 4. This updated critical scenario cannot be identified within the conventional FT analysis framework. The realistic information of the new data well reflecting the behavior of current physical system can be finally utilized for a timely and effective plan for mitigating system-level seismic vulnerability. Case 4 - Risk evaluation merging with seismic hazard information: Finally, let us investigate the change of system-level risk (i.e., annual core damage frequency) caused by the updated fragility results of case 2 and case 3 compared to the prior fragility result of case 1. The annual core damage frequency can be determined through the convolution of system-level seismic fragility curve of core damage and the seismic hazard curve
CDF Pf
dH PGA dPGA
dPGA
(12)
in which CDF is the annual core damage frequency and H (PGA) is the mean seismic hazard curve. The seismic hazard curve is probabilistically obtained by identifying and integrating hazard sources, size, propagation characteristics, ground motion prediction model, etc. and finally describes the probability of annual exceedance (λ) in an identical horizontal domain of fragility curve, PGA. A detailed explanation and description for the probabilistic seismic hazard analysis are described in other publications (McGuire 1995, Baker 2008, Atkinson et al. 2014, Giorgio and Iervolino 2016, Mahmoudi et al. 2016, Mulargia et al. 2016). Within US, the US Geological Survey (USGS: http://earthquake.usgs.gov/hazards/products/) provides the seismic hazard information (e.g., PGA values corresponding to the mean return period T) for many places of an interest. Fig. 9 shows the seismic hazard maps for the US. For the purpose of conducting the structural risk assessment, Cornell et al. (2002) proposed the approximated seismic hazard curve equation, as follows
H PGA ko PGA k
(13)
where the terms k0 and k are constants. Therefore, based on the hazard information obtained from the USGS and on the Eq. (13), the seismic hazard curve at any site of interest in the US can be developed by identifying values of k0 and k for seismic risk calculation purposes. Note that the absolute values of hazard estimates presented below are not of particular significance in the context of the methodology presented in this paper. It is more than likely that extensive investigations are needed to arrive at actual values of hazard estimates at a nuclear site. Such investigations are well beyond the scope of study presented in this paper. In this study, let’s consider the three representative sites of Los Angeles, Memphis and Charleston to account for different seismic characteristics throughout the US. Specifically, Table 5 illustrates the specific hazard information having a 10 % probability of exceedance in 50 years (λ = 0.0021, T = 475 years), a 5% probability of exceedance in 50 years (λ = 0.0010, T = 975 years) and a
Bayesian-based seismic margin assessment approach: Application to research reactor
Fig. 8 Change of critical path 0
10
LA Memphis Charleston
(a) 10% probability of exceedance in 50 years map of PGA
Annual Exceedance Probability
-1
10
-2
10
-3
10
-4
10
-5
10
-6
10
0
1
2 3 PGA ( unit : g )
4
5
Fig. 10 Seismic hazard curves for Los Angeles, Boston and Charleston Table 5 Seismic hazard information for Los Angeles, Memphis, and Charleston PGA values
(b) 2% probability of exceedance in 50 years map of PGA Fig. 9 Seismic hazard maps for the US (Petersen et al. 2008)
2% probability of exceedance in 50 years (λ = 4.04e-4, T = 2475 years); all data were obtained from the USGS. Fig. 10 shows the seismic hazard curves for Los Angeles, Memphis, and Charleston evaluated from the Eq. (13) and the hazard information of Table 5. Finally, Table 6 shows the annual core damage frequency values of case 1, case 2 and case 3 in Los Angeles, Memphis and Charleston. These are estimated using the convolution of the fragility curve of the S event of each case and the seismic hazard curves from Fig. 10 obtained using Eq. (12). The CDF increases 1.3 and 9.8 times in Los Angeles, 1.2 and 2.8 times in Memphis, and
10% in 50 years (T = 475yr, λ = 0.0021) 5% in 50 years (T = 975yr, λ = 0.0010) 2% in 50 years (T = 2475yr, λ = 4.04e-4)
Los Angeles
Memphis
Charleston
0.481 g
0.169 g
0.151 g
0.662 g
0.333 g
0.345 g
0.935 g
0.588 g
0.719 g
Table 6 Comparison of annual core damage frequency Annual core damage frequency (risk of S) Los Angeles
Memphis
Charleston
Case 1
4.4014e-4
2.5099e-4
3.0615e-4
Case 2
5.8605e-4
2.9147e-4
3.4815e-4
Case 3
43.000e-4
7.1046e-4
7.2929e-4
Shinyoung Kwag, Jinho Oh, Jong-Min Lee and Jeong-Soo Ryu
1.2 and 2.4 times in Charleston due to the new information of case 2 and case 3. It is observed that data for Los Angeles, in the western US site, is more influential on the risk estimation than are data from Memphis and Charleston, which are the middle and eastern US sites under the same system-level fragility curve. Overall, though the degree of change in risks differs depending on the sites, the quantity of change seems noticeable everywhere. Whether or not we consider information brings the significant deviation to the CDF results. It is worthy of mention that these increased risks are possible to detect when we utilize the proposed approach. Ultimately, this information can be further amalgamated for effective risk management of a research reactor system subjected to seismic hazard.
6. Conclusions This study focuses on the development of a Bayesianbased approach for seismic margin assessment of a research reactor system. The concept of the Bayesian inference is combined with a fault tree technique of current seismic margin assessment. Unlike the traditional fault tree analysis, this Bayesian inference facilitates updating of prior information of all events based on new information or data that might become available from experimental studies, field observations, or high fidelity simulations. This combined approach is successfully applied to the seismic capacity and risk evaluation of a pool-type research reactor system, and, by considering new observation, is found to more accurately estimate those values than is possible using the current practice. The primary conclusion of this study can be summarized as: • The proposed approach considers Aleatory and Epistemic uncertainties of basic event fragilities in the quantification of the seismic margin of the entire system. • Availability of new data reduces the Epistemic uncertainty in the corresponding fragility curve and changes the system-level fragility. • Incorporation of the Bayesian inference makes a path for new exploration of the modified critical scenario. • The proposed approach also assists in identification of important events that lie on an updated critical path. • The system-level fragility, when altered in terms of new evidence, changes the system-level risk quite a lot when integrated with the seismic hazard information. Therefore, these features and findings of the proposed approach can make feasible real-time risk analysis and quantification. Such analysis can finally be utilized to come up with an effective plan to mitigate the system-level risk.
Acknowledgments The authors acknowledge the financial support provided by the Ministry of Science, and ICT of Korea.
References
ASCE (2016), Seismic analysis of safety-related nuclear structures and commentary, ASCE/SEI 4-16, American Society of Civil Engineers. ASME/ANS (2009), Addenda to ASME/ANS RA-S-2008 Standard for Level 1/Large Early Release Frequency Probabilistic Risk Assessment for Nuclear Power Plant Applications, ASME/ANS RA-Sa-2009, American Society of Mechanical Engineers. Atkinson, G.M., Bommer, J.J. and Abrahamson, N.A. (2014), “Alternative approaches to modeling epistemic uncertainty in ground motions in probabilistic seismic‐hazard analysis”, Seismol. Res. Lett., 85(6), 1141-1144. Baker, J.W. (2008), An introduction to probabilistic seismic hazard analysis, Report for the US Nuclear Regulatory Commission, page Version, 1. Balasubramanian, S.R., Balaji, R.K., Meher, P.A., Rupen, G. and Anoop, M.B. (2014), “A methodology for development of seismic fragility curves for URBM buildings”, Earthquakes and Structures, 6(6), 611-625. Brynda, W.J., Lobner, P.R., Powell, R.W. and Straker, E.A. (1978), Design Guide for Category-III Reactors Pool Type Reactor, BNL 50831-III, Brookhaven National Laboratory Associated Universities Inc., Upton, New York. Budnitz, R.J., Amico, P.J., Hall, W.J. and Kennedy, P.R. (1985), An Approach to the Quantification of Seismic Margins in Nuclear Power Plants, Lawrence Livermore National Laboratory Report UCID-20444, NUREG/CR-4334, Prepared for the US Nuclear Regulatory Commission. Chen, L. and Chen, S. (2016), “Seismic fragility performance of skewed and curved bridges in low-to-moderate seismic region”, Earthq. Struct., 10(4), 789-810. Cornell, C.A., Jalayer, F., Hamburger, R.O. and Foutch, D.A. (2002), “Probabilistic basis for 2000 SAC federal emergency management agency steel moment frame guidelines”, J. Struct. Eng., ASCE, 128(4), 526-33. Ellingwood, B. (1990), “Validation studies of seismic PRAs”, Nuclear Eng. Des., 123(2-3), 189-196. Ellingwood, B. (1994), Validation of Seismic Probabilistic Risk Assessments of Nuclear Power Plants, NUREG/GR-0008, Prepared for the US Nuclear Regulatory Commission. EPRI (1991), A Methodology for Assessment of Nuclear Power Plant Seismic Margin, NP-6041-SLR1, Electric Power Research Institute. EPRI (1994), Methodology for Developing Seismic Fragilities, TR-103959, Electric Power Research Institute. Fullwood, R.R. (2000), Probabilistic Safety Assessment in the Chemical and Nuclear Industries, Butterworth-Heinemann. Fussell, J. (1975), “How to hand calculate system reliability and safety characteristics”, IEEE Trans. Reliability, 24(3), 169-174. Gardoni, P., Der Kiureghian, A. and Mosalam, K.M. (2002), “Probabilistic capacity models and fragility estimates for reinforced concrete columns based on experimental observations”, J. Struct. Eng., ASCE, 128(10), 1024-1038. Giorgio, M. and Iervolino, I. (2016), “On multisite probabilistic seismic hazard analysis”, Bull. Seismol. Soc. Am., 106(3), 12231234. Hakata, T. (2007), “Seismic PSA method for multiple nuclear power plants in a site”, Reliability Eng. Syst. Safe., 92(7), 883894. Hamada, M., Martz, H.F., Reese, C.S., Graves, T., Johnson, V. and Wilson, A.G. (2004), “A fully Bayesian approach for combining multilevel failure information in fault tree quantification and optimal follow-on resource allocation”, Reliability Eng. Syst. Safe., 86(3), 297-305. IAEA (1992), Procedures for Conducting Probabilistic Safety Assessments of Nuclear Power Plants (Level 1), Safety Series
Bayesian-based seismic margin assessment approach: Application to research reactor No. 50-P-4, International Atomic Energy Agency. IAEA (2001), Utilization related Design Features of Research Reactors: A Compendium, Technical Report Series, No.455, International Atomic Energy Agency. Ju, B.S., Jung, W.Y. and Ryu, Y.H. (2013), “Seismic fragility evaluation of piping system installed in critical structures”, Struct. Eng. Mech., 46(3), 337-352. Jung, W.Y. and Ju, B.S. (2015), “Effect of MDOF structures’ optimal dampers on seismic fragility of piping”, Earthq. Struct., 9(3), 563-576. Kelly, D.L. and Smith, C.L. (2009), “Bayesian inference in probabilistic risk assessment-The current state of the art”, Reliability Eng. Syst. Safe., 94(2), 628-643. Kim, J.H., Choi, I.K. and Park, J.H. (2011), “Uncertainty analysis of system fragility for seismic safety evaluation of NPP”, Nuclear Eng. Des., 241(7), 2570-2579. Koutsourelakis, P.S. (2010), “Assessing structural vulnerability against earthquakes using multi-dimensional fragility surfaces A Bayesian framework”, Prob. Eng. Mech., 25(1), 49-60. Kwag, S. (2016), “Probabilistic approaches for multi-hazard risk assessment of structures and systems”, Ph.D. Dissertation, North Carolina State University, Raleigh, NC, US. Kwag, S. and Gupta, A. (2016), “Bayesian network technique in probabilistic risk assessment for multiple hazards”, Proceedings of 24th International Conference on Nuclear Engineering (ICONE 24), June 26-30, 2016, Charlotte, NC, US. Kwag, S. and Gupta, A. (2017), “Probabilistic risk assessment framework for structural systems under multiple hazards using Bayesian statistics”, Nuclear Eng. Des., 315, 20-34. Kwag, S. and Ok, S.Y. (2013), “Robust design of seismic isolation system using constrained multi-objective optimization technique”, KSCE J. Civ. Eng., 17(5), 1051-1063. Kwag, S., Lee, J.M., Ryu, J.S. and Kim, Y. K. (2012), “Structural integrity evaluation of reactor pool working platform: guide tubes and refuelling cover in a research reactor”, The Eleventh International Conference on Computational Structures Technology (11th CST), 4-7 September, Dubrovnik, Croatia. Kwag, S., Lee, J.M., Oh, J. and Ryu, J.S. (2014), “Development of system design and seismic performance evaluation for reactor pool working platform of a research reactor”, Nuclear Eng. Des., 266, 199-213. Kwag, S., Lee, J.M., Oh, J., Ryu, J.S. and Kim, Y.K. (2011), “Structural integrity evaluation of a service pool working platform in research reactor,” Transactions of the Korean Nuclear Society Autumn Meeting, October 27-28, Gyeongju, Korea. Lee, Y.J. and Moon, D.S. (2014), “A new methodology of the development of seismic fragility curves”, Smart Struct. Syst., 14(5), 847-867. Mahmoudi, M., Shayanfar, M., Barkhordari, M.A. and Jahani, E. (2016), “New fuzzy method in choosing Ground Motion Prediction Equation (GMPE) in probabilistic seismic hazard analysis,” Earthq. Struct., 10(2), 389-408. McGuire, R.K. (1995), “Probabilistic seismic hazard analysis and design earthquakes: closing the loop”, Bull. Seismol. Soc. Am., 85(5), 1275-1284. Modarres, M., Kaminskiy, M.P. and Krivtsov, V. (1999), Reliability Engineering and Risk Analysis: a Practical Guide. CRC press. Mosleh, A., Razzaghi, M.S., Jara, J. and Varum, H. (2016), “Development of fragility curves for RC bridges subjected to reverse and strike-slip seismic sources,” Earthq. Struct., 11(3), 517-538. Mulargia, F., Stark, P.B. and Geller, R.J. (2016), “Why is Probabilistic Seismic Hazard Analysis (PSHA) Still Used?”, Physics of the Earth and Planetary Interiors, In Press. Petersen, M.D., Frankel, A.D., Harmsen, S.C., Mueller, C.S.,
Haller, K.M., Wheeler, R.L. and Luco, N. (2008), Documentation for the 2008 Update of the United States National Seismic Hazard Maps, U.S. Geological Survey OpenFile Report 2008-1128, 61. Plummer, M. (2003), “JAGS: A program for analysis of Bayesian graphical models using Gibbs sampling”, Proceedings of the 3rd international workshop on distributed statistical computing, 124, Technische Universit at Wien. Rasmussen, N.C. (1975), Reactor Safety Study, WASH-1400, NUREG-75/014, Appendix II, US Nuclear Regulatory Commission, Washington DC. Shinozuka, M., Feng, M.Q., Lee, J. and Naganuma, T. (2000), “Statistical analysis of fragility curves”, J. Eng. Mech., ASCE, 126(12), 1224-1231. Singer, D. (1990), “A Fuzzy set approach to fault tree and reliability analysis”, Fuzz. Set. Syst., 34(2), 145-155. Straub, D. and Der Kiureghian, A. (2008), “Improved seismic fragility modeling from empirical data”, Struct. Safe., 30(4), 320-336. Tanaka, H., Fan, L.T., Lai, F.S. and Toguchi, K. (1983), “Fault-tree analysis by Fuzzy probability”, IEEE Trans. Reliab., 32(5), 453457. USNRC (1975), Reactor Safety Study, WASH-1400, NUREG 73/041, US Nuclear Regulatory Commission. USNRC (1983), PRA Procedure Guide - A Guide to the performance of probabilistic risk assessments for nuclear power plants, NUREG/CR-2300, US Nuclear Regulatory Commission. Vermaut, M., Monette, P., Shah, P. and Campbell, R.D. (1998), “Methodology and results of the seismic probabilistic safety assessment of Krško nuclear power plant”, Nuclear Eng. Des., 182(1), 59-72. Yu, F.L., Chen, P.C., Lin, E. and Wu, J.S. (1989), “Seismic probabilistic risk assessment and its application to utility safety decisions”, Reliability Eng. Syst. Safe., 24(2), 199-221.
CC