Jun 3, 2015 - We thank Will Taylor, Mathew Self, Robin Hanson, Bob Kanefsky, Jim Kelley, Don. Freeman, and Chris Wallace, without whose help AutoClass ...
6
Bayesian Classification (AutoClass): Theory and Results Peter Cheeseman RIACS John Stutz NASA Abstract
We describe AutoClass, an approach to unsupervised classi cation based upon the classical mixture model, supplemented by a Bayesian method for determining the optimal classes. We include a moderately detailed exposition of the mathematics behind the AutoClass system. We emphasize that no current unsupervised classi cation system can produce maximally useful results when operated alone. It is the interaction between domain experts and the machine searching over the model space, that generates new knowledge. Both bring unique information and abilities to the database analysis task, and each enhances the others' e�ectiveness. We illustrate this point with several applications of AutoClass to complex real world databases, and describe the resulting successes and failures.
6.1 Introduction This chapter is a summary of our experience in using an automatic classi cation program (AutoClass) to extract useful information from databases. It also gives an outline of the principles that underlie automatic classi cation in general, and AutoClass in particular. We are concerned with the problem of automatic discovery of classes in data (sometimes called clustering, or unsupervised learning), rather than the generation of class descriptions from labeled examples (called supervised learning). In some sense, automatic classi cation aims at discovering the \natural" classes in the data. These classes re ect basic causal mechanisms that makes some cases look more like each other than the rest of the cases. The causal mechanisms may be as boring as sample biases in the data, or could re ect some major new discovery in the domain. Sometimes, these classes were well known to experts in the eld, but unknown to AutoClass, and other times
62
Cheeseman & Stutz
the classes were a surprise to the experts because they revealed something important about the domain that was previously unknown. Such discovery of previously unknown structure occurs most frequently when there are many relevant attributes describing each case, because humans are poor at seeing structure in a large number of dimensions. We wish to emphasize that the discovery of important structure (classes) in data is rarely a one-shot process of throwing some database at AutoClass (or similar program) and getting back something useful. Instead, discovery of important structure is usually a process of nding classes, interpreting the results, transforming and/or augmenting the data, and repeating the cycle. In other words, the process of discovery of structure in databases is an example of the well known hypothesize-and-test cycle of normal scienti c discovery. We believe that a strong interaction between the discovery program and the expert will be the common pattern in Knowledge Discovery in Databases (KDD) for the foreseeable future, because each have complementary strengths. A structure searching program like AutoClass can search huge amounts of data looking for multi-dimensional structures with a speed and accuracy that no human could hope to match. An expert, on the other hand, has domain knowledge that the program lacks. This enables the expert to interpret the results of the search in a way that computers cannot. Knowledge discovery is then an interactive process that involves nding patterns, interpreting them, generating new hypothesis, getting more data and then repeating the process. We shall illustrate this process through case studies from our experience in using AutoClass. We rst give a quick outline of what AutoClass does and how it does it, followed by a more detailed description of the theory and details. We then give a number of case studies of AutoClass in action.
6.2 Bayesian Classi cation The word \classi cation" is ambiguous. Often it means assigning a new object/case to one of an existing set of possible classes. As used in this paper, however, it means nding the classes themselves from a given set of \unclassi ed" objects/cases (unsupervised classi cation). Once such a set of classes has been found, they can be the basis for classifying new cases in the rst sense. In the Bayesian approach to unsupervised classi cation, the goal is to nd the most probable set of class descriptions (a classi cation) given the data and prior expectations. The introduction of priors automatically enforces a tradeo� between the t to the data and the complexity of the class descriptions, giving an automatic form of Occam's razor (section 6.3.4). Alternate approaches, such as maximum likelihood, that try to nd the class descriptions that best predict the data, have trouble because the best such
Bayesian Classi cation (AutoClass): Theory and Results
63
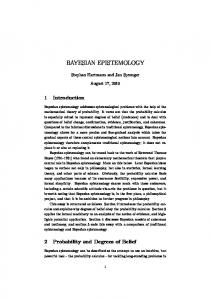
X = fX1 ; : : :; XI g X~ i = fXi1 ; : : :; XiK g i j k l c S T = Tc ; T1; : : :; TJ V~ = V~c ; V~1; : : :; V~J �j
the set data instances Xi the vector of attribute values Xik , describing instance Xi indexes instances, i = 1; : : :; I indexes classes, j = 1; : : :; J indexes attributes, k = 1; : : :; K indexes discrete attribute values, l = 1; : : :; L indicates inter-class probabilities & parameters denotes the space of allowed p.d.f.'s V~ ; T denotes the abstract mathematical form of the p.d.f. denotes the set of parameter values instantiating a p.d.f. class mixture probability, V~c = f�1; : : :; �J g I implicit information not speci cally represented
Table 6.1
Symbols used in this paper.
classi cation is a set of single case classes, perfectly tting each case, with a class for each unique case. This extreme \classi cation" has little predictive power for new cases.
6.2.1 AutoClass Model Overview
We limit ourselves to data for which instances can be represented as ordered vectors of attribute values. In principle, each attribute represents a measurement of some instance property common to all instances. These are \simple" properties in the sense that they can be represented by single measurements: discrete values such as \true" or \false", or integer values, or real numbers. For example, medical case #8, described as (age = 23, blood-type = A, weight = 73.4kg, ...) would have X8;1 = 23, X8;2 = A, etc. We make no attempt to deal with relational data where attributes, such as \married-to", have values that are other instances. Note however, that these limitations are solely a property of our speci c method of modeling classes, and could be overcome by using more expressive models. In discussing a probabilistic model, we refer to a probability distribution or density function (p.d.f.) that gives the probability of observing an instance possessing any particular attribute value vector. Ideally, such a model would take into account everything known about the processes potentially involved in generating and observing an instance. A Bayes Net relating input and output attributes would be suitable for instances of a well-understood process. For general KDD systems like AutoClass, where little is known about underlying processes, relatively simple statistical models are used.
64
Cheeseman & Stutz
Probabilistic models invariably contain free parameters, such as Bernoulli probabilities or the Gaussian mean and variance, which must either be xed or removed (by integration) before instance probabilities can be computed. Thus it is useful distinguish between the p.d.f.'s functional form and its parameter values, and we denote these by T and V~ respectively. S will denote the space of allowed p.d.f.'s V~ ; T, while I denotes implicit information not speci cally represented. For AutoClass, our fundamental model is the classical nite mixture distribution. This is a two part model. The rst gives the interclass mixture probability that an instance Xi is a member of class Cj , independently of anything else we may know of the instance: P(Xi 2 Cj j V~c ; Tc; S; I ). The interclass p.d.f. Tc is a Bernoulli distribution characterized by the class number J and the probabilities of V~c . Each class Cj is then modeled by a class p.d.f., P(X~ i j Xi 2 Cj ; V~j ; Tj ; S; I ), giving the probability of observing the instance attribute values X~ i conditional on the assumption that instance Xi belongs in class Cj . The class p.d.f. Tj is a product of individual or covariant attribute p.d.f.'s Tjk ; e.g. Bernoulli distributions for nominal attributes, Gaussian densities for real numbers, Poisson distributions for number counts, etc. It is not necessary that the various Tj be identical, only that they all model the same subset of the instance attributes. We di�er from most other classi ers in that we never assign any instances to the classes. Instead we use a weighted assignment, weighting on the probability of class membership: P(X~ i ; Xi 2 Cj j V~j ; Tj ; S; I ). We hold that no nite amount of evidence can determine an instance's class membership. We further hold that the classi cation p.d.f. T and parameter values V~ constitute a more informative class description than any set of instance assignments. As a practical matter, the weighted assignment approach eliminates the brittle behavior that boundary surface instances can induce in classi cation systems that decide assignments. More importantly, it allows any user to apply decision rules appropriate to that user's current goals.
6.2.2 AutoClass Search Overview
Given a set of data X we seek two things: for any classi cation p.d.f. T we seek the maximum posterior (map) parameter values V~ , and irrespective of any V~ we seek the most probable T. Thus there are two levels of search. For any xed T specifying the number of classes and their class models, we search the space of allowed parameter values for the maximally probable V~ . This is a real valued space of generally high dimension, subject to strong constraints between the parameters. There are many local maxima and we have no simple way to determine the global maximum except by generate and test. Thus parameter level search requires an expensive numerical optimization. The model level search involves the number of classes J and alternate class models Tj . There are several levels of complexity. The basic level involves a single p.d.f. Tj common
Bayesian Classi cation (AutoClass): Theory and Results
65
to all classes, with search over the number of classes. A second level allows the individual Tj to vary from class to class. Model level search is subject to the usual combinatorial explosion of possibilities as attribute number increases, but the Occam factor inherent in the Bayesian approach limits the probability of complex class models for any choice of model and non-delta priors (section 6.3.4). Note that we have described the search problem for unsupervised classi cation. Supervised classi cation is much easier: since we already know the class assignments, the parameter level search reduces to a single step computation of the map parameter values. The model level search retains some of its combinatorial complexity, but with known class memberships we can seek the most probable model for each class individually. The additional information obtained by knowing the class assignments makes it much easier to explore the space of allowed class models, and obtain maximally informative class descriptions.
6.3 AutoClass in Detail We begin with the standard assumption that the data instances Xi are conditionally independent given the classi cation p.d.f. V~ ; T. Thus we claim that any similarity between two instances is accounted for by their class memberships, and that there are no further interactions between data. Under this assumption the joint data probability is just the product of the individual instance probabilities.
6.3.1 AutoClass Basic Model
Our classi cation level, or interclass, model V~c ; Tc is the classical Finite Mixture model of Everitt & Hand (1981) and Titterington et al. (1985). This postulates that each instance belongs to one and only one, unknown, member of a set of J classes Cj , with a probability P(Xi 2 Cj j V~c ; Tc; S; I ). Note that this probability is independent of the instance attribute vector X~ i . In principle the classes constitute a discrete partitioning of ~ the data, and thus the appropriate p.d.f. is a Bernoulli distribution. Its P parameters Vc are a set of probabilities f�1; : : :; �J g, constrained that 0 � �j � 1 and j �j = 1. Thus we have: P(Xi 2 Cj j V~c ; Tc; S; I ) � �j : (6.3.1) Since the Dirichlet (multiple Beta) distribution is conjugate1 to the Bernoulli, we use a uniform minimum information version for the prior probability distribution on the �j : 1 A conjugate prior is one which, when multiplied with the direct probability, gives a posterior probability having the same functional form as the prior, thus allowing the posterior to be used as a prior in further applications.
66
Cheeseman & Stutz
?(J + 1) Y � J1 (6.3.2) [?(1 + 1=J)]J j j The map parameter estimates for the supervised case, where Ij is the known number of instances assigned to Cj , are then �bj = (Ij + 1=J)=(I + 1). The instances Xi from each class are assumed to possess attribute vectors X~ i that are independently and identically distributed w.r.t. the class as P(X~ i j Xi 2 Cj ; V~j ; Tj ; S; I ). The p.d.f. V~j ; Tj thus gives the conditional probability that an instance Xi would have attribute values X~ i if it were known that the instance is a member of class Cj . This class distribution function is a product of distributions modeling conditionally independent attributes k:2 Y P(X~ i j Xi 2 Cj ; V~j ; Tj ; S; I ) = P(Xik j Xi 2 Cj ; V~jk; Tjk ; S; I ): (6.3.3) P(�1; : : :; �J j Tc ; S; I ) �
k
Individual attribute models P(Xik j Xi 2 Cj ; V~jk; Tjk ; S; I ) include the Bernoulli and Poisson distributions, and Gaussian densities. They are detailed in the next section. Combining the interclass and intraclass probabilities, we get the direct probability that an instance Xi with attribute values X~ i is a member of class Cj : Y P(X~ i ; Xi 2 Cj j V~j ; Tj ; V~c ; Tc; S; I ) = �j P(Xik j Xi 2 Cj ; V~jk; Tjk ; S; I ): (6.3.4) k
The normalized class membership probability is obtained from this by normalizing over the set of classes. The probability of observing an instance Xi with attribute values X~ i , regardless of its class is then: X Y (6.3.5) P(X~ i j V~ ; T; S; I ) = (�j P(Xik j Xi 2 Cj ; V~jk; Tjk ; S; I )): j
k
Thus the probability of observing the database X is: YX Y P(X j V~ ; T; S; I ) = [ (�j P(Xik j Xi 2 Cj ; V~jk; Tjk ; S; I ))]: i
j
k
(6.3.6)
So far we've only described a classical nite mixture model. We convert this to a Bayesian model by introducing priors, at this point only on the parameters, obtaining the joint probability of the data and the parameter values: P(X V~ j TS I ) = P(V~ j TS I )P(X j V~ TS I ) (6.3.7) Y YX Y = P(V~c j Tc S I ) [P(V~jk j Tjk S I )] [ (�j P(Xik j Xi 2 Cj ; V~jk Tjk S I ))]: jk
i
j
k
2 For exposition we show all attributes as if independent, with independent p.d.f.'s and parameter priors. The shift to partially or fully covariant attributes is only a matter of bookkeeping.
Bayesian Classi cation (AutoClass): Theory and Results
67
6.3.2 AutoClass Search and Evaluation We seek two things: For any given classi cation form T = Tc ; T1; : : :; TJ and data X, we want the map parameter values obtained from the parameters' posterior p.d.f.: P(X; V~ j T; S; I ) P(X; V~ j T; S; I ) = P(V~ j X; T; S; I ) = : (6.3.8) R ~ P(X j T; S; I ) dV P(X; V~ j T; S; I ) Independently of the parameters, we want the map model form, conditional on the data, where the posterior probability of the p.d.f. form T is: R P(T j S; I )P(X j T; S; I ) P(T j S; I ) dV~ P(X; V~ j T; S; I ) = (6.3.9) P(T j X; S; I ) = P(X j S; I ) P(X j S; I ) Z / P(T j S; I ) dV~ P(X; V~ j T; S; I ) (6.3.10)
/
Z
dV~ P(X; V~ j T; S; I ) = P(X j T; S; I ):
(6.3.11)
The proportionality in (6.3.10) is due to dropping the normalizing constant P(X j S; I ), which is not generally computable. This is not a problem, since we are only interested in relative probabilities of a limited number of alternate models T. The proportionality in (6.3.11) holds when we take the prior probability P(T j S; I ) to be uniform over all T of interest. This is reasonable when we have no strong reason to favor one model over another. P(T j S; I ) is only a single discrete probability. In any but toy problems, the product over the data probabilities and/or the parameter priors will quite dominate any non-zero P(T j X; S; I ). Thus we implicitly use P(T j S; I ) to exclude models deemed impossible, by ignoring those models, and substitute P(X j T; S; I ) for P(T j X; S; I ) when making decisions. Frustratingly, attempts to directly optimize over or integrate out the parameter sets ~Vjk , in equation (6.3.7), founder on the J I products resulting from the product over sums. Only minuscule data sets can be processed without approximation. The classical application of the mixture assumption suggests a useful approach. If we knew the true class memberships, as in supervised classi cation, and augmented the instance vectors Xi with this information, the probabilities P(Xi0 j Xi0 2 Cj ; V~j ; Tj ; S; I ) would be zero whenever Xi0 62 Cj . The sum over j in equation (6.3.7) would degenerate into a single non-zero term. Merging the two products over k, and shifting the attribute product within, gives Y Y Y 0 j V~jk ; Tjk ; S; I ))] (�j P(Xijk (6.3.12) P(X 0 ; V~ j T; S; I ) = P(V~ j T; S; I ) [ j Xi0 2Cj
k
68
Cheeseman & Stutz
Y Y 00 j V~jk ; Tjk; S; I )] = P(V~ j T; S; I ) [�jnj P(Xjk j
k
(6.3.13)
00 are sets of statistics, where nj is the number of cases assigned to Cj , and the Xjk corresponding to attribute p.d.f.'s Tjk , obtained from the Xi0 2 Cj . This pure product form cleanly separates the classes with their member instances. Class parameters can be optimized or integrated out, without interaction with the other class's parameters. The same holds for the independent attribute terms within each class. Clearly, for supervised classi cation, the optimization and rating of a model is a relatively straightforward process. Unfortunately, this does not hold for unsupervised classi cation. One could use the mixture assumption directly, applying this known assignment approach to every partitioning of the data into J non-empty subsets. But the number of such partitionings is Stirling's SI(J ) , which approaches J I for small J. This technique is only useful for verifying our approximations with extremely small data and class sets. We are left with approximation. Since equations (6.3.4) and (6.3.7) are easily evaluated for known parameters, the obvious approach is a variation of the EM algorithm of Dempster et al. (1977) and Titterington et al. (1985). Given the set of class distributions Tj , and the current map estimates of the values for �j and V~jk , the normalized class conditional probabilities of equation (6.3.4) provide us with weighted assignments wij in the form of normalized class probabilities: Y ~ ~ wij � PP(Xi~; Xi 2 Cj j V ;~T; S; I ) / �j P(Xik j Xi 2 Cj ; V~jk ; Tjk; S; I ): (6.3.14) j P(Xi ; Xi 2 Cj j V ; T; S; I ) k We can use these instance weightings to construct weighted statistics corresponding to the known class case. For a discrete attribute, these are the class weighted number of instances possessing each discrete value wjkl. For a real valued attribute modeled by a Gaussian, these are the class weighted number, mean, and variance: X X X wj = wij ; mjk = wj?1 wij Xik ; s2jk = wj?1 wij (Xik ? mjk )2 : (6.3.15) i
i
i
Using these statistics as if they represented known assignment statistics permits reestimation of the parameters with the partitioning of equation (6.3.13). This new parameter set then permits reestimation of the normalized probabilities. Cycling between the two reestimation steps carries the current parameter and weight estimates toward a mutually predictive and locally maximal stationary point. Unfortunately, there are usually numerous locally maximal stationary points. And excepting generate-and-test, we know of no method to nd, or even count, these maxima
Bayesian Classi cation (AutoClass): Theory and Results
69
| so we are reduced to search. Because the parameter space is generally too large to allow regular sampling, we generate pseudo-random points in parameter (or weight) space, converge to the local maximum, record the results, and repeat for as long as time allows. Having collected a set of local maxima for model T, and eliminated the (often many) 00 to approximate P(X j T; S; I ) duplicates, we use the local statistics X 00 = fwj ; Xjk g using: Z Y Y 00 00 j V~jk ; Tjk; S; I ))]: P(X j T; S; I ) � dV~ [P(V~ j T; S; I ) (�jwj P(Xjk (6.3.16) j
k
However we cannot use P(X 00 j T; S; I ) as a direct approximation to P(X j T; S; I ). Equivalence between P(X; V j T; S; I ) and P(X 00; V j T; S; I ) holds only when the weights wij 00 are indicators: wij 2 f0; 1g and P wij = 1. As the wij diverge used to compute the Xjk j from indicator values, P(X 00 j T; S; I ) becomes signi cantly less than P(X j T; S; I ). This
is easily seen by computing the ratio of the likelihoods given by the two methods at the map parameters Vb : Q Q P Vjk ; Tjk; S; I ))] [ j (�bj k P(Xik j Xi 2 Cj ; d P(X j Vb ; T; S; I ) i = : (6.3.17) Q Q w 00 j 00 b d P(X j V ; T; S; I ) j (�bj k P(Xjk j Vjk ; Tjk ; S; I )) This ratio is is observed to approach 1 when the weights wij and parameters V~jk are mutually predictive and the weights approach indicator values. As values diverge from either condition, this ratio's value increases drastically. Thus we approximate P(X j T; S; I ) as: P(X j Vb ; T; S; I ) : (6.3.18) P(X j T; S; I )� � P(X 00 j T; S; I ) P(X 00 j Vb ; T; S; I ) This substitution of P(X j T; S; I )� for P(X j T; S; I ) is a gross simpli cation, and currently the weakest point in our development. Mathematically we are claiming that P(X j V~ ; T; S; I ) and P(X 00 j V~ ; T; S; I ), taken as functions of V~ , are everywhere in the same proportion as at the map value Vb . We have no reason to believe this claim. However, we nd that both probabilities fall o� rapidly, in orders of magnitude, as V~ diverges from the Vb . Moreover, the rate of this fall o� is approximately exponential in the number of data. Thus for even moderate3 amounts of data, the only signi cant contributions to either P(X j T; S; I ) or P(X 00 j T; S; I ) come from the region of V~ near Vb , where the proportion is most likely to hold. 3 Moderate, in this context, may be taken to be of order 100 instances per class. This varies with the degree that T and Vb give distinct classes, which may be characterized by the degree to which the wij approach indicator values.
70
Cheeseman & Stutz
The P(X j T; S; I )� de ned above is computed for xed X 00 corresponding to a particular local Vb . For any given p.d.f. form T, we expect repeated EM searches to nd diverse distinct stationary points, with corresponding distinct map parameter sets Vb . How then, can we claim that any one P(X j T; S; I )� represents P(X j T; S; I ), when the latter is supposed to be the integral over the full parameter space V~ and implicitly includes all weightings compatible with the data? Our experience shows that the largest P(X j T; S; I )� can dominate the other peak integrals to a remarkable degree. Ratios between the two largest integrals of 104 to 109 are routine when the number of attribute values, I � K, exceeds a few hundred. With a few million attribute values, the ratio may easily reach e100 � 1044. In such circumstances we feel justi ed in reporting the largest known P(X 0 j T I )� as a reasonable approximation to P(X j TS I ), and in using it as our approximation to P(T j XS I ). But it must be admitted that we have not proven that non-peak regions never make signi cant contribution to P(T j XS I ), nor have we satisfactorily determined the conditions under which our assumptions hold. When one or more subsets of nm class p.d.f.'s Tj have identical functional form, the corresponding blocks of c Vj may be interchanged without altering P(X j T; S; I ). In effect, the probability peak at Vb possesses nm ! mirror images. Thus for any such nm , P(X j T; S; I )� needs to be scaled by nm !. The magnitude of this scaling is usually small relative to that of P(X j T; S; I )� , but may be signi cant when comparing T with very di�erent numbers of classes. Thus we rate the various models T by their best P(X j TS I )� and report on them in terms of the corresponding map parameterizations Vb . If one model's marginal dominates all others, it is our single best choice for classifying the database. Otherwise we report the several that do dominate.
6.3.3 AutoClass Attribute Models
Each class model is a product of conditionally independent probability distributions over singleton and/or covariant subsets of the attributes. For the medical example given in section 6.2.1, blood type is a discrete valued attribute which we model with a Bernoulli distribution while age and weight are both scalar real numbers that we model with a log-Gaussian density. The only hard constraint is that all class models, used in any classi cations that are to be compared, must model the same attribute set. Attributes deemed irrelevant to a particular classi cation cannot simply be ignored, since this would a�ect the marginal probabilities, as is shown below. AutoClass provides basic models for simple discrete (nominal) and several types of numerical data. We have not yet identi ed a satisfactory distribution function for ordered discrete (ordinal) data. In each case we adopt a minimum or near minimum informa-
Bayesian Classi cation (AutoClass): Theory and Results
71
tion prior, the choice being limited among those providing integrable marginals. This limitation has seriously retarded development of the more speci c models, but numerical integration is considered to be too costly for EM convergence. In the following we describe in detail the basic elements of the independent Bernoulli and Gaussian models, and note other attribute probability distributions that we use to assemble the class models.
� Discrete valued attributes (sex, blood-type, : : :) | Bernoulli distributions with
uniform Dirichlet conjugate prior. For the singleton case with Lk possible values, P the parameters are V~jk � fqjk1 : : :qjkLk g, such that 0 � qjkl � 1, Ll k qjkl = 1, where P(Xik = l j Xi 2 Cj ; V~jk ; Tjk; S; I ) � qjkl (6.3.19) L ?(Lk + 1) Yk q L1k (6.3.20) P(qjk1; : : :; qjkLk j Tjk ; S; I ) � [?(1 + L1k )]Lk l=1 jkl w + L1k (6.3.21) qbjkl = jkl wj + 1
For the covariant case, say sex and blood type jointly, we apply the above model to the cross product of individual attribute values. Thus female and type A would form a single value in the cross product. The number of such values, and thus the number of parameters required, is the product of the individual attribute's Lk . However the prior of equation (6.3.20) severely limits the probability of large covariant p.d.f.'s, as discussed in section 6.3.4. � Real valued location attributes (spatial locations) | Gaussian densities with either a uniform or Gaussian prior on the means. We use a Je�reys prior (6.3.24) on a singleton attribute's standard deviation, and the inverse Wishart distribution (Box & Tiao 1973) as the variance prior of covariant attribute subsets. For a single attribute with uniform priors, using the statistics de ned in equation (6.3.15): P(Xik j Xi 2 Cj ; �jk; �jk; Tjk ; S; I )
1 �kmax ? �kmin ; �?1 � ?1 log �kmax ; P(�jk j Tjk ; S; I ) = �jk �kmin P(�jk j Tjk ; S; I ) =
�
?1 p1 e 2 2��jk �bjk = mjk ;
� X ?� �2 ik jk � jk
2 �bjk = s2jk w w+j 1 :
j
;
(6.3.22) (6.3.23) (6.3.24)
72
Cheeseman & Stutz
� Real valued scalar attributes (age, weight) | Log-Gaussian density model obtained by applying the Gaussian model to log(Xik ? mink ). See Aitchison & Brown (1957). � Bounded real valued attributes (probabilities) | Gaussian Log-Odds obtained by applying the Gaussian to log((Xik ? mink )=(maxk ? Xik )) (under development). � Circular or angular real valued attributes | von Mises-Fisher distributions on the
circle and n-sphere (under development) See Mardia et al. (1979). � Integer count valued attributes | Poisson distribution with uniform prior per Loredo (1992). No covariant form has been developed. � Missing values | Discrete valued attribute sets are extended to include \missing" as an additional attribute value, to be modeled as any other value. Numerical attributes use a binary discrete probability qjk for \missing" and 1?qjk for\known", with the standard numerical model conditioned on the \known" side. With the Gaussian model this gives: P(Xik = missing j Xi 2 Cj ; qjk; �jk; �jk; Tjk ; S; I ) � qjk;
(1 ? q ) P(Xik = r j Xi 2 Cj ; qjk; �jk; �jk; Tjk ; S; I ) � p jk e 2��jk
? 21
� r?� �2 jk �jk
(6.3.25) :
(6.3.26)
� Hierarchical models | represent a reorganization of the standard mixture model,
from a at structure, where each class is fully independent, to a tree structure where multiple classes can share one or more model terms. A class is then described by the attribute model nodes along the branch between root and leaf. This makes it possible to avoid duplicating essentially identical attribute distributions common to several classes. The advantage of such hierarchical models lies in eliminating excess parameters, thereby increasing the model posterior. See Hanson et al. (1991) for a full description of our approach. Other approaches are possible: see Boulton & Wallace (1973). � Irrelevant attributes | Irrelevant attributes pose a problem which we have only recently recognized. If an attribute is deemed irrelevant to all classi cation models under consideration, it can simply be deleted from the database. If an attribute is deemed irrelevant to only some of the models, one is tempted to simply eliminate it from consideration by those models, and to model it in the others. This is what we have done in AutoClass, but it is an error. Consider two models V~j ; Tj and V~j 0; Tj0, identical in both form and parameter values except that the latter includes an additional V~jk0 0 ; Tjk0 0 modeling one additional
Bayesian Classi cation (AutoClass): Theory and Results
73
attribute k0. Let Tjk0 0 be any appropriate p.d.f. except a delta function, Then for any instance Xi : 0 P(X~ i j Xi 2 Cj ; V~j ; Tj ; S; I ) > P(X~ i j Xi 2 Cj0 ; V~j ; Tj0; S; I ):
(6.3.27)
This is a simple consequence of the fact that a non-delta p.d.f. cannot predict any value with probability 1. Taken to the limit, we nd that a class model which ignores all attributes will always be more probable than one which models any attributes. Obviously, the results of modeling with di�erent attribute sets are incommensurable. How should we handle irrelevant attributes? For a classi er, an attribute is irrelevant when all classes possess identical p.d.f.'s for that attribute. In the hierarchical model described above, this can be achieved by pushing the attribute model V~jk ; Tjk up to the root node, where it is inherited by all leaves. In an ordinary mixture model the same e�ect can be obtained by using a common Tjk with every V~jk xed at the map values estimated from a single class classi cation model. This will suf ce for the case when all classes within a classi cation ignore the attribute, and allow comparison between classi cations that deem di�erent attribute subsets irrelevant. The case where only some classes within a classi cation ignore an attribute is yet undecided. In principle, our classi cation model should also include a prior distribution P(T j S; I ) on the number of classes present and the individual class model forms Tj . Currently we take this distribution to be uniform and drop it from our calculations. Thus we ignore any prior information on alternate classi cation model probabilities, relying solely on our parameter priors for the Occam factor preventing over tting of the models. We nd this quite su�cient.
6.3.4 The Occam Factor
We have several times mentioned an \Occam Factor", implying that Bayesian parameter priors can somehow prevent the over tting that is a problem with maximum likelihood optimization of any kind of probabilistic model. Consider that every single parameter introduced into a Bayesian model brings its own multiplicative prior to the joint probability, which always lowers the marginal. If a parameter fails to raise the marginal by increasing the direct probability by a greater factor than the prior lowers the marginal, we reject the model incorporating that parameter. In the mixture models used by AutoClass, each class requires a full set of attribute model parameters, each with its own prior. Those priors always favor classi cations with smaller numbers of classes, and do so
74
Cheeseman & Stutz
overwhelmingly, once the number of classes exceeds some small fraction4 of the database size. Similar e�ects limit model complexity within the classes. Simple independent attribute models are usually favored simply because they require fewer parameters than the corresponding covariant models. Ten real valued attributes require 20 parameters for modeling with independent Gaussians, and 55 for the full covariant Gaussian. Ten binary discrete attributes also require 20 parameters for modeling with independent Bernoulli distributions, but 1024 are needed for a fully covariant Bernoulli distribution. One needs a great many very highly covariant instances to raise a fully covariant model's marginal above the independent model's. Both of the foregoing e�ects are con rmed throughout our experience with AutoClass. For data sets of a few hundred to a few thousand instances, class models with large order covariant terms are generally rated far lower than those combining independent and/or small order covariant terms. We have yet to nd a case where the most probable number of classes was not a small fraction of the number of instances classi ed. Nor have we found a case where the most probable number of model parameters was more than a small fraction of the total number of attribute values. Over tting simply does not occur when Bayesian mixture models are correctly applied.
6.3.5 The AutoClass Implementation
AutoClass was written in Lisp, taking full advantage of the extraordinary programming environment provided by the Symbolics Lisp Machine. It has been adapted to operate in most Lisp environments, and a data parallel version exists for star-Lisp on the CM-3. A C translation is in preparation. Some details regarding the computational considerations encountered in implementing AutoClass will be found in Stutz & Cheeseman (1995). A NASA technical report giving fuller details of the mathematics and implementation is in preparation.
6.4 Case Studies 6.4.1 Infrared Astronomical Satellite (IRAS) Data. The rst major test of AutoClass on a large scale real-world database was the application of AutoClass to the IRAS Low Resolution Spectral Atlas. This atlas consisted of 5425 mean spectra of IRAS point sources. Each spectrum consists of 100 \blue" channels in the range 7 to 14 microns, and another 100 \red" channels in the range from 10 to 24 4
Typically of order 1%, but potentially larger for very distinct classes.
Bayesian Classi cation (AutoClass): Theory and Results
75
microns. Of these 200 channels, only 100 contain usable data. These point source spectra covered a wide range of intensities, and showed many di�erent spectral distributions. We applied AutoClass to this spectral database by treating each of the 100 spectral channels (intensities) as an independent normally distributed single real value. The log-normal model is preferable for such scalar data, but several percent of the reported intensity values were negative. Also, adjacent spectral values are expected to be highly correlated, but it was not obvious how to incorporate neighbor correlation information. Thus we knew from the beginning that we were missing important information, but we were curious how well AutoClass would do despite this handicap. Our very rst attempts to apply AutoClass to the spectral data did not produce very good results, as was immediately apparent from visual inspection. Fortunately, inspection also exposed the cause of the problem. The spectra we were given had been \normalized"|in this case normalization meant scaling the spectra so that all had the same peak height. This normalization meant that noisy spectra were arti cially scaled up (or down) depending on whether the noise at the peak was higher or lower than the average. Since all values in a single spectrum were scaled by the same constant, an incorrect scaling constant distorted all spectral values. Also, spectra with a single strong peak were scaled so that the rest of the spectrum was close to the noise level. We solved the \normalization problem" by renormalizing the data ourselves so that area under the all curves is the same. This method of normalization is much less sensitive to noise than the peak normalization method. The experts who provided us with this data tried to make life easy for us by only giving us the brightest spectra from 1/4 of the sky (without telling us about this sampling bias). When we found this out, we requested all the spectra in the atlas to work with. Because this larger atlas included much noisier spectra, we found a new problem|some spectral intensities were negative. A negative intensity, or measurement, is physically impossible, so these values were a mystery. After much investigation, we nally found out that the processing software had subtracted a \background" value from all spectra. This preprocessing, of course, violates the basic maxim that analysis should be performed on the data actually measured, and all \corrections" should be done in the statistical modeling step. Once these problems had been removed, we used AutoClass II to classify all 5425 spectra. The results of this classi cation are presented in Cheeseman et al. (1989), and it revealed many interesting new discoveries. The rst observation is that the AutoClass classes (77 of them) gave a signi cantly di�erent classi cation than that previously provided with the atlas. This earlier IRAS spectral classi cation was based on expected features and human generated criteria based on visual inspection. AutoClass was able to make many subtle distinctions between spectra that super cially look similar, and
76
Cheeseman & Stutz
these distinctions were not previously known. Some of the classes, such as the blackbody emission classes, and the silicate emission classes were known from previous studies, but the ne distinctions within these broad classes were not previously known. The IRAS spectral classi cation also revealed other astronomically signi cant results. For example, by nding which classes the few known carbon stars occured in, we were able to triple the number of known (or suspected) carbon stars. AutoClass also revealed a large number of blackbody stars with a signi cant IR excess, presumably due to dust surrounding the star. Another indirect result of the classi cation is that the average spectral intensities of a class cancel the noise present in single spectra, making ner detail visible. For example, this noise suppression revealed a very weak spectral \bump" at 13 microns in some classes that is completely invisible in the individual spectra. Many of these discoveries are discussed in Goebel et al. (1989). The AutoClass classi cation was su�ciently good, that it revealed problems with the data that had been previously missed. In particular, some of the blackbody sub-classes showed an excess of energy at the blue end of the spectrum. There is no plausible physical mechanism that could produce such a blue excess in blackbody stars, so this result was a mystery. Eventually, we discovered that this excess was the result of incorrect calibration. Originally, Vega (a 10,000 degree star) was chosen as the reference star, but later in the mission the reference star was switched to � Tau (a 4000 degree star). Unfortunately, the software was not altered to re ect this change, thus causing the calibration error. Of course, none of this change information was documented, so it took considerable search for us to nd the cause. Other calibration errors and artifacts of the data processing also gradually came to light as we discussed our results with the domain experts. In particular, we found out that the spectra were often contaminated with cosmic ray \spikes", and that a \ lter" in the software removed these spikes from the data before averaging the di�erent spectra together. Unfortunately, this lter could not tell the di�erence between a strong spectral line and a cosmic ray hit, so it often eliminated perfectly good spectra and yet still passed contaminated spectra. Again the lesson to be drawn from this experience is that the raw observation data should be made available, and e�ects such as cosmic rays and background noise should be statistically modeled|the data itself should not be modi ed!
6.4.2 IRAS Lessons
A major lesson of our IRAS experience is that experts tend to pass on only the minimum information that they think the data analyst needs. They are attempting to be helpful| but in practice they are not treating the analyst as a full partner. We kept nding new unexplained results, and only by confronting the experts with them would they reveal other sources of data, or processing steps they had neglected to mention. Finally, in
Bayesian Classi cation (AutoClass): Theory and Results
77
frustration, we insisted that our experts give us all the data that they had, and all the documentation on the data processing that had been performed instead of feeding it to us piecemeal. Even then we found out about other data (e.g. star variability index), that could have aided the classi cation, well after we had published our classi cation. We believe that a data analyst using tools like AutoClass must become moderately expert in the eld. This is in order to understand all the biases in the data collection; to understand the processing that occured before the data was made available for analysis; to ensure that all the relevant data has been located; and to aid the interpretation process. Another major lesson learned from the IRAS experience is that nding new and interesting results (classes) is not enough|unless some plausible interpretation of these results can be found, they will probably be ignored. This interpretation step often involves follow up data or analysis to test possible hypotheses. As an example, we discovered subtle distinctions in the silicate emission spectra (e.g. classes 1 and 11 in Cheeseman et al. (1989), ) and needed to explain these di�erences. Since the creators of the IRAS atlas had provided visual matches for each point source, we used this data to see how stellar type related to the discovered classes. Also, the average galactic latitude of the classes was signi cantly di�erent, indicating that one class is more distant, and intrinsically brighter. The most likely interpretation of these results is that there are di�erent classes of M-giants, with di�erent galactic distributions, and these classes can be distinguished by subtle di�erences in their infrared spectra. Note that we could do this follow up investigation relatively easily because the IRAS spectral atlas included considerable auxiliary data about each point-source (galactic coordinates, variability, optical identi cation, etc.). Finding the classes in a database is only part of the task|the remaining task is to communicate the class descriptions to the expert. AutoClass generates reports that fully describe the classes, but these can be di�cult to interpret for a novice. In the IRAS classi cation case, we generated spectral plots that displayed the class spectral values graphically. This graphical output is shown in Cheeseman et al. (1989), and is immediately understood by domain experts. We also classi ed the classes (a metaclassi cation) and used these meta-classes to organize the full classi cation. The experts found this meta-classi cation very helpful. We cannot over-emphasize the importance of generating easily understood outputs, but unfortunately, really good outputs tend to be domain speci c.
6.4.3 DNA Intron Data
This project began when we received a database of about 3000 donor and acceptor sites (intron/exon boundaries) from human DNA. In most species, the DNA that codes for a particular protein (a gene) is broken up by the insertion of stretches of DNA (introns)
78
Cheeseman & Stutz
that are spliced out of the corresponding messenger RNA before it is used to produce proteins. The segments of DNA that contribute to the nal RNA are called exons. The beginning of exon/intron boundary is called the donor site, and the corresponding intron/exon end is called the acceptor site. The intron length (between a donor and an acceptor site) can vary from a minimum of about 80 bases, to many thousands of bases. The donor database consisted of an ordered list of the possible bases (A,G,C,T) at the 10 bases before the splice site, and 40 bases of the adjoining intron (and similarly for the acceptor site database). It has been traditionally assumed that in human DNA there is only one general type of donor and acceptor site, because they all use the same splicing machinery. We decided to test this assumption by applying AutoClass to both the donor and acceptor databases separately. Our initial classi cation revealed many classes that describe essentially one unique base sequence per class. In other words, there are splice sites that are practically duplicated many times in human DNA. Further investigation showed that most of these nearly identical sites occured in the same gene, usually in an uninterrupted sequence. When the nearly identical sites occur in di�erent genes, these genes were found to be practically identical as a result of gene duplication. Since duplication within a gene, and duplication of genes themselves is well known in the molecular biology community, these very tight classes were of no interest. In order to eliminate the duplication problem, we pruned the data to eliminate all sequences that had greater than 50% identity. This pruning reduced our data by roughly 30%, and allowed AutoClass to nd 3 classes in the remaining data (for both the donor and acceptor sites). Inspection of these classes showed a very obvious pattern. For the largest class (about 33%) every position in both donors and acceptors was \C rich"| that is, every position had a signi cantly higher probability of having a C than the global average. The other 2 classes (donor and acceptor) were TA rich and G rich respectively. Note that this pattern was discovered even though AutoClass was treating each position independently, indicating a strong causal mechanism producing this uniform base bias. This base bias even extended into the exon region, although the signal was much weaker there. This is surprising, because the choice of bases in an exon is thought to be dictated entirely by its corresponding biological function through the protein it encodes. Having found these clear classes, we entered the next phase of data analysis: trying to interpret the discovered pattern. One question that occured to us was whether the class of donor site was correlated with the class of the corresponding acceptor site. Unfortunately, our original databases did not record the corresponding sites in the separate donor and acceptor databases. Also, the original databases were extracted from a very old version of GenBank, using obscure (and irreproducible) ltering techniques. We were fortunate in
Bayesian Classi cation (AutoClass): Theory and Results
79
nding collaborators in the Stanford University Molecular Biology Lab5 , who extracted all human introns (with anking exons) from the current version of GenBank for us. This gave us a much larger database, and all the auxiliary information we needed to do followup studies. Our followup studies revealed the following: � The class of a donor site was indeed highly correlated with the corresponding acceptor site. For the C-rich class, for example, not only were both the donor and acceptor sites C-rich, but the entire intron between them was C-rich. A similar pattern was observed for the other classes. � The same classes were observed in mouse genes, and where there are corresponding genes in mice and humans, they have the same classes, indicating that whatever created the pattern we observed has persisted for at least 60 million years. � The base-frequency pattern extends into the anking exons, but not as strongly as that observed in the introns. � If one intron is, say, TA rich, then there is a high probability that any neighboring introns will also be TA rich. From these observations, we can reasonably conclude that DNA gene relative base frequency patterns can persist for long stretches (in some cases many thousands of bases). Also, these base frequencies occur in other species and the frequency type is preserved throughout evolution. Recent sequencing of whole chromosomes (from yeast and worms) show similar long stretches of G + C rich (or poor) variation, on both coding and noncoding regions. All of these observations point toward some unknown essential mechanism that operates on DNA and creates/maintains/uses these base frequency patterns. Note that AutoClass, combined with human interpretation and additional testing found this general pattern, even though it extends well beyond the original very restricted database. Unfortunately, these results have not been published, so these discoveries remain unknown to the molecular biology community.
6.4.4 LandSat Data
The largest database that we have applied AutoClass to is a 1024 � 1024 array of LandSat pixels, where each pixel records 7 spectral intensities from a 30m square ground patch. Our test image covers about a 30km square region in Kansas, taken by the LandSat/TM satellite in August 1989. Our goal was to nd classes in this set of over 1 million \cases" (i.e. pixels). This large image data set put such strong computational demands on 5
Our collaborators were Doug Brutlag and Tod Klingler
80
Cheeseman & Stutz
our standard LISP AutoClass (running on a Symbolics machine) that we developed a parallel version of AutoClass (in LISP) to run on a Connection machine, and later on a CM-2. Fortunately, the structure of AutoClass lends itself to parallelization, so that recent parallel versions allow large database processing in reasonable time. Instead of treating each spectral value independently within a class (as we did in early versions of AutoClass), we allowed the values to be fully correlated with each other, with separate correlations for each class. The theory behind this correlated version of AutoClass is presented in Hanson et al. (1991). This model still assumes that the pixels are independent of their neighbors. That is, we do not take into account the spatial correlation of neighboring pixels, even though we know this is a strong source of additional information. We did this only because AutoClass is a general purpose tool that cannot be easily modi ed to t the known structure of a new domain. We are currently investigating methods for integrating spatial correlation information from multiple images. Like other case studies described in this chapter, the results from LandSat data classi cation were improved signi cantly by transforming the data (preprocessing), so that the assumptions built into AutoClass better t the input data. In the case of LandSat pixels, it is well known that the observed intensity of a patch on the ground is a�ected by the ground slope of that patch. This means that if we attempt a classi cation on the given observed intensities, we get di�erent classes for the same ground cover type, depending on their particular ground slopes. For this reason, it is better to use the ratio of spectral intensities for each pixel instead, since the ratio is not a�ected by a common scaling factor, such as the ground slope e�ect. For all pixels, we replaced the given spectral values with the ratio of the spectral value to the sum of all spectral values (for that pixel). Note that this transformation of the data does not destroy information, since the original values can be recovered (to within numerical noise). Since the spectral ratios are strictly positive (i.e. they are scale parameters), we assume that their value distribution is log-normally distributed, so we use Log(spectral ratio) as our input data. Readers may wonder why we rail against preprocessing of data by others, yet do the same thing ourselves. Our answer is twofold. Firstly, we encourage transformations of the data that do not destroy information (reversible transformations), if this makes the transformed data better t the assumptions of the particular data analysis technique being used. Secondly, our major objection is to undocumented preprocessing, especially when the informal data description does not match the data as given. Before we ran AutoClass on our transformed data, we histogramed the Log(spectral ratio) values to see if our log-normal distribution was reasonable. We were surprised to nd that the data values were highly quantized, with large numbers of pixels having exactly the same value. Further investigation revealed that although the original spectral
Bayesian Classi cation (AutoClass): Theory and Results
81
intensity values were recorded at 8-bit accuracy, most pixels were assigned to a much smaller range of intensity bins. That is, although there were 256 possible intensity values, in practice only a very small subset of these values were observed. This is because the camera's dynamic range was selected to record the extreme values of intensity (to avoid saturation e�ects), so that nearly all values occur within a much smaller range. We \dithered" these values by adding small random errors with a standard deviation of 1/2 a bin width, thus \smoothing" the data values. This dithering corrupted the data, but it avoided problems associated with the strong quantization e�ect. The results of classifying all the pixel intensity data, using full correlation between the spectral values in each class description, are presented in Kanefsky et al. (1994). This classi cation found 93 classes in the best classi cation, and these classes were themselves classi ed to produce a meta-classi cation. This meta-classi cation makes the individual classes easier to interpret. By far the greatest aid to interpreting these pixel classes is to threshold the class membership probability so as to assign each pixel to its most probable class, then to plot the 2-D distribution of the resulting classes. For many classes, these 2-D plots immediately suggest an interpretation to the human eye, such as roads, rivers, valley bottoms, valley edges, elds of particular crops, etc. Other classes (with many fewer members) seem to contain pixels with a mixture of basic types. For example, a pixel partially falling on a highway, and partially falling on surrounding grass, results in a mixed pixel. If there are enough of these mixed pixels, with roughly the same mixing proportion, they form a class of their own. Clearly, in the mixed pixel case, the classes are not particularly meaningful, but it is surprising that the majority of classes seem to be composed of pure pixels of a single type. We nd that applying a general purpose classi cation tool like AutoClass can produce interesting and meaningful classes, even when the tool's basic assumptions do not t the data very well. In particular, failing to take neighbor pixel class correlation into account, and the assumption that every pixel belongs to one and only one class, do not t the LandSat pixel data well, yet the results are surprisingly good. A better classi cation of LandSat type data requires a special purpose classi cation tool that takes into account the known properties of the domain.
6.5 Summary of Lessons Learnt The above case studies illustrate a number of lessons learnt in applying AutoClass to real databases. We summarize these lessons as follows: � Data analysis/Knowledge discovery is a process. | Discovery of patterns in data is only the beginning of a cycle of interpretation followed by more testing.
82
Cheeseman & Stutz
� General data mining tools are only good for exploratory analysis. | � � � � � � �
Once the initial patterns have suggested new domain speci c hypotheses, these hypotheses need to be further investigated using tools adapted to the hypotheses. Beware undocumented or irreversible data preprocessing. | Key terms that may indicate information destroying pre-processing include calibrated, corrected, averaged, normalized, adjusted, compressed, and so forth. Beware hidden biases in data collection. | Such bias may dominate the resulting classes, as in the initial Intron classes. Di�culty in extracting data from experts. | Experts tend to supply only the information they think is needed | an analyst must become a mini-expert in the domain to really understand the data. Data transformation to t analysis tool. | These transformations can greatly aid pattern discovery. Try di�erent representations. Try di�erent pattern discovery tools. Visually inspecting the data before use. | This step usually catches gross errors and obvious patterns. Unsupervised classi cation versus supervised classi cation. Discovery of (unsupervised) classes may or may not be of help in predicting a target variable. Domain-speci c display of resulting classes. | What your program outputs is all that the domain expert sees. To make that output useful, it is necessary to provide display and interpretation appropriate to the speci c problem domain.
Acknowledgments We thank Will Taylor, Mathew Self, Robin Hanson, Bob Kanefsky, Jim Kelley, Don Freeman, and Chris Wallace, without whose help AutoClass would not be half so useful as it is today. We are also indebted to too many to mention, for the questions and problem domains that have forced us to extend and re ne our ideas and understanding.
Bibliography Aitchison, J. and Brown, J. A. C. 1957. The Lognormal Distribution. Cambridge: University Press. Boulton, D. M. and Wallace, C. S. 1973. An Information Measure of Hierarchic Classi cation. Computer Journal, 16 (3): 57-63.
Bayesian Classi cation (AutoClass): Theory and Results
83
Box, G. E. P. and Tiao, G. C. 1973. Bayesian Inference in Statistical Analysis. New York: Addison-Wesley. Cheeseman, P., Stutz, J., Self, M., Taylor, W., Goebel, J., Volk, K., and Walker, H. 1989. Automatic Classi cation of Spectra From the Infrared Astronomical Satellite (IRAS), NASA Reference Publication #1217, National Technical Information Service, Spring eld, Virginia. Dempster, A. P., Laird, N. M., and Rubin, D. B. 1977. Maximum likelihood from incomplete data via the EM algorithm. Journal of the Royal Statistical Society, Series B, 39(1): 1{38. Everitt, B. S. and Hand, D. J. 1981. Finite Mixture Distributions. London: Chapman and Hall. Goebel, J., Volk, K., Walker, H,. Gerbault, F., Cheeseman, P., Self, M., Stutz, J., and Taylor, W. 1989. A Bayesian classi cation of the IRAS LRS Atlas. Astronomy and Astrophysics 222, L5-L8. Hanson, R., Stutz, J., and Cheeseman, P. 1991. Bayesian Classi cation with Correlation and Inheritance. In 12th International Joint Conference on Arti cial Intelligence, 692{698. San Mateo, Calif.: Morgan Kaufmann. Kanefsky, B., Stutz, J., and Cheeseman, P. 1994. An Improved Automatic Classi cation of a Landsat/TM Image From Kansas (FIFE). Technical Report, FIA-94-01, NASA Ames Research Center, Mo�et Field, California. Loredo, T. 1992. The Promise of Bayesian Inference for Astrophysics. In Statistical Challenges in Modern Astronomy, eds E. Feigelson and G. Babu. New York: Springer-Verlag. Mardia, K. V., Kent, J. T., and Bibby, J. M. 1979. Multiavariant Analysis. New York: Academic Press. Stutz, J. and Cheeseman, P. 1994. AutoClass | a Bayesian Approach to Classi cation. In Maximum Entropy and Bayesian Methods, Cambridge, 1994, eds. J. Skilling and S. Sibisi. Dordrecht, The Netherlands: Kluwer Academic Publishers. Forthcoming. Titterington, D. M., Smith, A. F. M., and Makov, U. E. 1985. Statistical Analysis of Finite Mixture Distributions. New York: John Wiley & Sons.