IEEE TRANS. CIRCUITS SYST. VIDEO TECHNOL.
1
Bayesian Integration of Face and Low-level Cues for Foveated Video Coding Giuseppe Boccignone, Member, IEEE, Angelo Marcelli, Member, IEEE, Paolo Napoletano, Member, IEEE, Gianluca Di Fiore, Giovanni Iacovoni and Salvatore Morsa
Abstract—We present a Bayesian model that allows to automatically generate fixations/foveations and that can be suitably exploited for compression purposes. The twofold aim of this work is to investigate how the exploitation of high-level perceptual cues provided by human faces occurring in the video can enhance the compression process without reducing the perceived quality of the video and to validate such assumption with an extensive and principled experimental protocol. To such end, the model integrates top-down and bottom-up cues to choose the fixation point on a video frame: at the highest level, a fixation is driven by prior information and by relevant objects, namely human faces, within the scene; at the same time, local saliency together with novel and abrupt visual events contribute by triggering lower level control. The performance of the resulting video compression system has been evaluated with respect to both the perceived quality of foveated video clips and the compression gain with an extensive evaluation campaign, which has eventually involved 200 subjects. Index Terms—Foveated video coding, foveation filtering, image coding, face detection, video quality measurement.
I. I NTRODUCTION
T
HE idea of taking advantage of foveation mechanisms for video compression has gained some currency in recent years and foveated video coding has become an appealing research area (for an in-depth review see, for instance, [1], [2] and [3]). The rationale behind such research effort is intuitively simple. When looking at a scene in the real world, a human observer moves his eyes three to four times each second (saccades), to bring the fovea, the central area of the retina, to fixate different regions of interest, and such information is integrated across subsequent fixations in order ”to get the full picture” [4], [5]. Most important, the region around the point of fixation is projected into the fovea and sampled with the highest density and perceived with the highest contrast sensitivity, both decreasing toward periphery. In other terms, there exists redundant high-frequency information in the peripheral region, which is discarded by our visual system. Thus, given a point of fixation (or focus-of-attention, FOA), if an image is artificially created by removing the undetectable frequencies of the original image, it appears, under the same viewing conditions, much like the original [6]. G. Boccignone, A. Marcelli, and P. Napoletano are with the Natural Computation Lab at the Dipartimento di Ingegneria del’Informazione e Ingegneria Elettrica, Universit´a di Salerno, via Melillo, 1, 84084 Fisciano (SA), Italy. G. Di Fiore, G. Iacovoni, and S. Morsa are with the CoRiTel Lab, Universit´a di Salerno, via Melillo, 1, 84084 Fisciano (SA), Italy. Copyright (c) 2008 IEEE. Personal use of this material is permitted. However, permission to use this material for any other purposes must be obtained from the IEEE by sending an email to
[email protected].
A great deal of work has been carried over by Bovik et al. to provide a principled framework to exploit FOAs for achieving high compression efficiency [1], [7], [8], [2], [9]. All these proposals take for granted the positions of the FOAs. Very recently, an interesting technique has been proposed by Itti [3] that partially overcomes this hallmark by adopting a neurobiological model of visual attention to detect the FOAs. Itti’s model, however, basically relies upon bottom-up processing of visual information, which may be a poor model of human observer’s behavior, when relevant objects (such as people, faces, etc) are part of the observed scene, thus resulting in lower perceived quality of the video compressed through foveation. In this paper we introduce the following novelties with respect to the state-of-the-art of foveated video coding: 1) the Bayesian integration of low level cues with high level perceptual cues provided by faces to enhance the compression process; 2) the validation of such approach with an extensive and systematic experimental procedure based on subjective evaluation. Bayesian foveation. The approach we propose, different from Bovik’s and akin to Itti’s approach, relies on a foveation model in order to automatically determine the FOA. However, in contrast to Itti, our model does not rely on bare bottomup mechanisms, but attempts to account for the cooperation/competition between bottom-up/spatial-based and topdown/object-based cues. Indeed, the integration of bottomup vs. top-down information, or space-based vs. object-based cues, is essential to answer the fundamental question of attentive vision [10], [11] [12]: Where is the next potential target of gaze shifts? Further, such integration could be a significant advantage for applications where a good deal of prior information is available to the encoder [2]. It has been shown that eye movements on dynamic natural scenes cluster in only a small number of regions with high saliency and that the variability across multiple presentations is lower than across multiple subjects [13]. For instance, Stelmach et al. [14] recorded 24 subjects viewing 15 forty-five second clips to determine if viewing behavior can be incorporated into video coding schemes. They found that there was substantial agreement among subjects in terms of where they looked; in another experiment [15], recorded eye movements of 8 subjects were used to determine a predicted gaze position. Tosi et al. [16] recorded the eye movements of 10 subjects watching a variety of clips and reported that, qualitatively, individual differences in scanpaths were relatively small. A recent and accurate study by Goldstein
IEEE TRANS. CIRCUITS SYST. VIDEO TECHNOL.
et al. [17] provides evidence that, in contrast to static images, people watching videos tends to look at the same things, independent of age and gender; further, taking into account a single region of interest might be appropriate for varied audiences in many applications. To overcome some limitations of past proposals, we present a foveation model that exploits a Bayesian framework to integrate different cues for determining the foveation point on each frame. Bayesian techniques are the subject of growing interest in the computer vision community [18]. However, to the best of our knowledge they have not been used for foveated coding purposes. The model controls FOA setting at different levels: at the highest, perceptual level, the choice is driven by prior information available and the presence of relevant objects; meanwhile, spatial saliency of the scene due to color, texture, motion, combined with novel and abrupt visual events contribute by triggering low level control. In this work, human faces have been chosen to stand for high level perceptual cues, among other possible categories of objects, either for their biological relevance per se [19], and for the interest they share among different applications such as videoconferencing [2]. Nevertheless, the model is amenable to embed other categories, or to take into account more sophisticated and subtle mechanisms such as contextual priming [20]. Further, we assume that a single FOA is located on each frame. This choice is motivated on the one hand by consistency with biological vision constraints, such as eye motor control and fixation point persistence. Also, as discussed above, taking into account a single FOA is consistent with eye-tracked behaviors [17] and appropriate for handling different tasks and applications. On the other hand, such choice opens up the possibility for exploiting the model in real-time video coding applications, such as videoconference recorded by an active camera where multiple FOAs are not only unlikely but unfeasible. Model validation and performance evaluation via subjective evaluation protocol. The proposed approach is first challenged by directly comparing the automatically generated scanpath to a ”reference” one. This comparison has been performed by measuring the distance between the positions of the FOAs found by our model with respect to the reference ones. The ”reference” scanpath has been obtained by a suitable merge of the scanpaths of 30 human observers as recorded by an eye-tracking device. Such a validation procedure is a challenging task, since eye movements depend on many factors, often involving high cognitive level of understanding the semantic and affective contents of the scene [4], [10]. Moreover, different observers exhibit different eye movement idiosyncrasies, depending on personal preferences, culture, age, neuromuscular ability and so on [4], [5]. Second, the performance of the video compression system is evaluated with respect to the perceived quality of foveated video clips. Such quality measure is obtained through the standard MOS procedure [21] during a large measurement campaign involving 100 subjects. Third, the improvement in the perceived quality of compressed video clips due to the use of faces versus pure bottom-
2
up cues is measured by following the standard ACR protocol III-C [21] during a campaign involving 60 subjects. Eventually, the compression gain has been evaluated by varying the quantization parameter of the MPEG codecs. The gain due to foveation is measured by comparing the size of foveated vs. unfoveated compressed files, with special emphasis on the cases when, due to the setting of the quantization parameter, the foveated and unfoveated video clips exhibit similar perceived quality. Note that Bovik suggested some measures of quality tailored to meet foveated coding requirements, and successfully used them to develop algorithms for rate control optimization, motion estimation enhancement, error-resiliency. These measures, however, have never been compared systematically against the quality perceived by human observers. On the other hand, Itti measures the quality of his video compressing algorithm only indirectly, by measuring the correspondence between the scanpaths of human observers and those provided by the model, and implicitly assuming that the higher the correspondence the higher the perceived quality of the video. II. T HE FOVEATION MODEL OA We want to estimate, at time t, the target position xF t in terms of the maximum posterior probability (MAP rule) of focusing a location xt (in image coordinates xt = (xt , yt )), given the observed features zt (xt ) and the presence of objects of interest in the scene labeled by O: OA xF = arg max p(xt |zt , O). t xt
(1)
The set of labels O can index any category of objects, but in the work presented here, as previously discussed, it will indicate the specific category of human faces. The observed features can be generally partitioned into low level features O and object dependent features, zt (xt ) = {zlow t (xt ), zt (xt )} (in the following, to simplify notation, we will omit spatial are vectors dependency on xt ). Low level features zlow t encoding color, texture, motion, contrast measures, etc.; since dealing with faces, object-based features zO t , relate to skin, eye, nose and mouth properties. The posterior density p(xt |zt , O) can be written as p(xt |zt , O) =
p(xt , O|zt ) , p(O|zt )
(2)
where indeed the joint distribution p(xt , O|zt ) accounts for high level information of spatial relevance of a location xt when an object O is present. Perceptual effects on the choice of the fixation point, can be made explicit by further developing p(xt , O|zt ), through Bayes rule: p(xt , O|zt ) =
p(zt |xt , O)p(xt , O) . p(zt )
(3)
O The likelihood term, by using the fact that zt = {zlow t , zt }, can be written as: O O low low p(zlow t , zt |xt , O) = p(zt |zt , xt , O)p(zt |xt , O).
(4)
The first term represents the likelihood of object dependent features, while the second term accounts for the likelihood
IEEE TRANS. CIRCUITS SYST. VIDEO TECHNOL.
of observing specific low-level features (e.g. color) when an object of interest is present in the scene. Since here we are considering faces, the latter models the likelihood of observing skin colored regions, as provided by skin detection, and the former validates the candidate skin regions as representing faces, on the basis of specific face features such as eyes, nose etc. The prior p(xt , O) can be developed as
3
1) Saliency: From a color video sequence, early visual features such as color opponents red/green and blue/yellow, intensity and orientation (4 orientations via Gabor band-pass filtering) are computed in a set of feature maps based on retinal input and represented using 4-level pyramids (see [22], for implementation details). Then, center-surround operations, are implemented as differences between fine and coarser scales for a given feature. One feature type encodes for on/off image p(xt , O) = p(xt |O)p(O), (5) intensity contrast, two encode for red/green and blue/yellow double-opponent channels and four encode for local orienwhere p(xt |O) models the behavior of an ideal observer tation contrast. The contrast pyramids for intensity, color, gazing at location xt when an object of interest of type O is and orientation are summed across scales into three separate present, while p(O) is simply the prior probability that objects conspicuity maps [22], obtaining the vector of contrast features of type O may occur in the scene. zcontr . t low O The normalizing term p(zt ) = p(zt , zt ) is simplified as Motion features encode q motion activity in terms of lofollows: motion cal speed zt = vx2 + vy2 where velocity components O low low O low O (6) (vx , vy ) are obtained by using Anandan’s optical flow alp(zt , zt ) = p(zt |zt )p(zt ) ≃ p(zt ), gorithm [23], based on a pyramidal coarse-to-fine matching by assuming that features zlow are conditionally independent performed on the intensity channel of the original color frame. from object dependent features zO and by granting uniform A coarse estimate of the displacement field obtained from pairs −1 can be thought of, of lower resolution images are used to obtain more accurate probability to zO . This way p(zlow t ) in the same vein of Torralba [11], as low-level saliency estimates at the next (finer) level. information biasing top-down information as provided by Due to sub-sampling of low resolution images, the match p(zt |xt , O)p(xt , O). template size can be kept constant for all stages of computaGoing back to Eq. 2, we let the term p(O|zt ) account for tion, thus eliminating the dependence of the largest resolvable the probability that an object is present when certain features displacement on the size of match template. In the present are observed. We will shape this simply as an ”alerting” work, the search area at each level is kept constant at 3 × 3 term: when observed features indicate that some novel event pixels and the match template size at 5 × 5 pixels for all is occurring, then, in the absence of knowledge, attention levels of computation. The algorithm has been implemented may be deployed to such event. In this perspective, we let using simple thresholding based on the confidence level of an such probability depend only on low level cues available, i.e., estimated displacement vector [23]. p(O|zlow t ). Then, contrast and motion features are combined into the Eventually, by rewriting Eq.1 using Eqs. 2, 3, 4, 5 and 6, vector zlow and converted to densities p(zlow F OA t t ) by fitting as: we can estimate gaze fixation xt a multivariate Gaussian to their distribution in the image, low low low low , Σlow ), where µlow , Σlow represent the mean p(zO t |zt , xt , O)p(zt |xt , O)p(xt |O)p(O) N (zt ; µ OA xF ≃ arg max . t low features in the vector and the covariance matrix of the zlow xt p(O|zlow t t )p(zt ) (7) frame, respectively. In this way, as discussed in [11], the Eq. 7 straightforwardly shows that FOA is set by weighting saliency of a point is proportional to p(zt )−1 , being large perceptual cues (likelihoods and priors in the numerator) with when the feature is unexpected, in agreement with Shannon’s spatiotemporal low-level cues (denominator), and thus chosen definition of information. in terms of cooperation/competition between object-based and It is worth noting that here, differently from [11], the dimenspatial-based attention. sionality of zlow is low with respect to the number of samples t Note that if no perceptual information is available (uniform (number of frame pixels) and the parameters µlow , Σlow are distributions at the numerator), the FOA is selected on the obtained via classic maximum-likelihood estimates. In order basis of low-level cues; clearly, if also novel events are not to check the stability of this simple approximation we also −1 OA , namely, experimented with Bayesian maximum-likelihood estimation considered, then xF ≃ arg maxxt p(zlow t (xt )) t the FOA is selected as the most salient point, just like in the of µlow , Σlow , and a more general approximations of p(zlow t ) model proposed by Itti et al. [22], [3]. via a Gaussian-mixture model. The former provided similar In the following we provide details on the terms of Eq. 7. results to classic maximum-likelihood, while the second, as expected, performed better in terms of pdf approximation, but only a slight improvement was noticed in terms of salient A. Low level constraints: saliency and novelties point locations and from the standpoint of the final FOA In order to model densities describing low-level informa- location. However, this improvement could be achieved only low when the correct number of mixture components was available, tion, namely saliency p(zlow t ) and novelties p(O|zt ), a low set of low level features zt must be extracted, namely but since such number is not evident for saliency distribution zlow = {zcontr , zmotion , znew }, contrast, motion, and novelty on generic frames, then iterative model selection must be used, t t t t but this is computationally unfeasible on a per frame basis. features, respectively.
IEEE TRANS. CIRCUITS SYST. VIDEO TECHNOL.
4
Eventually, a single multivariate Gaussian was chosen as the most convenient trade-off. 2) Novelties: The distribution p(O|zlow t ) is used to represent the probability that an object is present, given observed low level features. At this level, in the absence of other information, a new object is more likely to occur where novelties new in the scene occur, i.e. p(O|zlow ). Thus, if an t ) ≃ p(O|zt object moves, appears/disappears, or some previously present object changes in brightness, then the novelty features znew t bring this information into the process. Novelty features znew are obtained at the lowest level of the t image intensity Gaussian pyramid as the difference between three subsequent frames zint ti , i = n−1, n, n+1 by first obtainint ing two difference frames as δzti = |zint ti+1 −zti |, i = n−1, n; new then, the novelty map is obtained as ztn = φ(δztn , δztn−1 ) where φ(·), is a suitable combination function, namely a normalized sum. Note also that for the purpose of encoding attention as triggered by events (e.g., pop-in or pop-out) we need not to distinguish between added and deleted information. Similarly to saliency features, novelty features are mapped to probabilities by fitting an univariate Gaussian (znew is t actually a scalar field) to their distribution in the image ; µnew , σ new ). N (znew t B. Perceptual analysis: detecting the presence of faces As previously discussed, top-down control of the fixation point is provided by the presence of faces. In a nutshell, the strategy we follow to detect faces is a coarse-to-fine strategy: 1) evaluate whether skin-like regions are present within the frame, so as to determine a preliminary spatial domain for faces; 2) restrict the domain to skin regions where eyes are likely to occur and determine the bounding boxes of candidate faces; 3) for each candidate evaluate its likelihood of actually being a face by considering cues related to skin distribution, textural symmetry and shape. The process is summarized in Fig. 1 in terms of intermediate results. More formally, turning back to Eq. 7, top-down information is related to the likelihood of observing skin regions p(zlow t |xt , O) together with the likelihood that face features be low observed in a skin region p(zO t |zt , xt , O), where the joint likelihood is weighted by prior information p(xt |O)p(O). 1) Finding skin regions: The skin likelihood p(zcol t |xt , O) is determined by using only color information, i.e. zcol t , the latter being a vector in the opponent color space, and modeled at each point xt , as a mixture of Gaussians: p(zcol t |xt , O) =
K X
k=1
col col αk N (zcol t (xt ); µk , Σk );
(8)
weights αk represent the mixing coefficients and col col N (zcol t ; µk , Σk ) is a multivariate Gaussian function col of zt . Note that, we can consider the covariance matrices Σcol being diagonal because of the choice of the opponent k color space. The parameters and the mixing coefficients αk are learned via the DEM algorithm [24], a variant of the well known Expectation-Maximization algorithm. To this end we follow
(a)
(b)
(d)
(c)
(e)
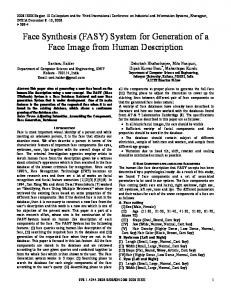
Fig. 1. Face detection steps: (a) the original image; (b) the skin map; (c) candidate eyes; (d) the resulting candidate face; (e) the final likelihood.
the procedure described by Jones and Rehg [25], and we assume K = 16 fixed. When the skin likelihood function is available, the segmentation of the frame to produce a skin map is straightforward [25]. The skin map is then exploited to compute the face likelihood. 2) Locating candidate face regions: Under the assumption that multiple faces could occur in the viewed scene, it is advantageous to determine a support set of regions where candidate faces may be located. The skin map provides a preliminary set, which however may embed non face regions. To further restrict the domain, we take into account structural face cues, namely the presence of eyes. Eye detection is performed by taking into account symmetry properties and grey level variations. The suitability of symmetry operators to detect eyes and facial features has been demonstrated since Reisfeld’s work [26]. Here we use the Discrete Symmetry Transform (DST, [27]) which for eye detection has provided results comparable with [26], while being computationally more efficient. Candidate eye points are marked if DST (xt ) > τ where τ = µDST + 3σDST , is an adaptive threshold relying upon average and standard deviation, µDST , σDST respectively, of the frame DST; correspondingly, a symmetry map is obtained. Then, by taking into account grey level variations as in [28], an eye analogue map is derived, which is eventually combined with the symmetry map through an AND operation, obtaining a global eye map. Eventually, the support domain of regions that are likely to belong to faces is obtained by combining skin and eye maps, through simple geometrical conditions followed by an AND operation; then, the face bounding region, denoted RF , is computed and a list of candidate faces produced. Faces already detected are masked to avoid multiple detection of the same faces. 3) Face likelihood: Once the list of face bounding relow gions is available, the joint likelihood p(zO t |zt , xt , O) = skin tex shape low p(zt , zt , zt |zt , xt , O) of each candidate face is estimated by taking into account the contributions of face appearance cues such as skin distribution, texture and shape,
IEEE TRANS. CIRCUITS SYST. VIDEO TECHNOL.
5
through the following factorization: shape p(zskin , ztex |xt , zlow (9) t t , zt t , O) = shape skin low low low p(zt |xt , zt , O)p(ztex |x , z , O)p(z |x , z , O). t t t t t t
In order to compute skin likelihood p(zskin |xt , zlow t t , O), the skin occupancy ratio in the candidate face box RF is calculated, rskin = nskin /|RF |, where nskin is the number of points in the skin map occurring in the face box, and |RF | the area of the box. Clearly, the skin likelihood should grow proportional to skin occupancy, which we formalize in the following density: −β p(zskin |xt , zlow t t , O) = 1 − e
′
rskin
.
(10)
′
Here the β parameter plays the double role of upper limiting p(zskin |xt , zlow t t , O), and thus its contribution to the overall face likelihood (Eq. 9), while controlling the non-linearity of ′ the density function: a low β (e.g., 0.1) provides a linear behavior but with limited contribution; higher values determine a non linear growing likelihood function slowly saturating near ′ the upper limit of 1. In our experiments, we used β = 2.0, which constrains the likelihood within the range [0, 0.8]. To estimate the texture contribution to face likelihood, low namely p(ztex t |xt , zt , O), the textural symmetry of the two cheek regions (areas below eyes and at the side of nose, referring to the eye map) is used as in [29]. It is characterized |V lef t −V right | through the ratio Rtex = Ylef t Yright of the grey level VY +VY variance VY of right and left cheeks, obtained from the top level of the orientation pyramid. Note that optimal symmetry should correspond to Rtex = 0. Texture symmetry is accounted for by the likelihood function 1 low . (11) p(ztex ′′ t |xt , zt , O) = 1 − −β Rtex 1+e The rationale behind this model is twofold: i) to limit the contribution of texture cues to the joint likelihood (Eq. 9) with respect to shape and skin cues, because texture features are more sensitive to noise in video streams than shape and low skin ones (here, p(ztex t |xt , zt , O) ≤ 0.5); ii) to control the steepness of likelihood decrease, which should be taken into account to reduce the influence of spectacles and skin tone. ′′ The latter issue is controlled by the value of the β parameter, higher values providing a steeper decrease; in our experiments ′′ we found that β = 0.8 provides reliable results. Eventually, shape likelihood p(zshape |xt , zlow t t , O) encodes structural knowledge about faces, related to eyes and mouth as provided by chromatic information and prior knowledge of their relative location. For each candidate face we evaluate eyes and mouth appearance based on features derived from chromatic information [30], and eventually determine their likelihood with respect to a reference binary template t(·) with support RT . Formally: p(zshape |xt , zlow t t , O) =
mouth |xt , zlow |xt , zlow p(zleye , zreye t , O), t t t , O)p(zt
(12)
mouth where, p(zleye , zreye |xt , zlow |xt , zlow t t t , O) and p(zt t , O) denote the joint probability of observing left and right eye
features and the probability of observing mouth features with reference to the template t(·), respectively; the appearance of eyes and mouth relies upon chromatic features zlow [30]. t Eye likelihood p(zleye , zreye |xt , zlow t t t , O) is obtained as 2
(d +d +d ) − l 2σr2 A 1 eye e , (13) 2πσeye P P where dl = xt ∈Al |e(xt ) − t(xt )|, dr = xt ∈Ar |e(xt ) − t(xt )|, and Al , Ar ⊆ RT are the regions of left and right eyes in the template t, respectively, and dA is the difference between the areas covered by each eye. The binary eye map e(·) is derived from the observation that high blue-yellow and low red-green values are found around the eyes [30]. In a similar way, mouth likelihood is obtained as
p(zleye , zreye |xt , zlow t t t , O) = √
2
− (d2m ) 1 2σ mouth , √ e p(ztmouth |xt , zlow , O) = (14) t 2πσmouth P with dm = xt ∈Am |m(xt ) − t(xt )|, where Am ⊆ RT and m(·) is the binary mouth map, computed under the assumption that the color of mouth regions contains stronger red component and weaker blue component than other facial regions (cfr. [30] for details). Once p(zt |xt , O) has been computed for each candidate face, the face is validated if p(zt |xt , O) > Tf ace, where Tf ace is a threshold that has been experimentally determined via ROC analysis. It is worth noting that when information on peculiar face cues such as eyes, nose, mouth is not available, or unreliable due to small scale of faces with respect to the global scene, then perceptual cues will be mostly provided in the form of skin information. 4) Prior information: The term p(xt |O) models the behavior of an ideal observer gazing at point xt when an object of interest is present within the scene. From a general standpoint, eye tracking experiments show that observers are likely to be more attracted by objects positioned at the center of the view field [17] (which would be modeled by density p(xt )). Beyond such general issue, we observed in eye-tracking experiments that when multiple faces occur within the scene, in the absence of either a given task or strong biases (one running person as opposed to people standing still within the viewed scene), observers a priori deploy attention to centrally or near centrally placed faces with respect to peripheral ones, and that such behavior attenuates in time due to a progressive loss of interest (habituation factor). We model this effect through a Gaussian centered on the object at xc,t , whose variance increases for increasing distance of the object from the center of the frame x0,t ; the habituation factor is taken as exp(−λt) with λ = 0.5. Thus,
p(xt |O) = e(−(xt −xc,t )
2
/(xc,t −x0,t )2 ) (−λt)
e
.
(15)
Note that, the habituation factor implicitly provides at the object level a kind of inhibition of return [22]. In the context of this paper, since we are considering faces, the prior probability p(O) that these are present within the observed scene is simply a constant (e.g., p(O) = 1 for the kind of videos we are dealing with in which faces are always present). A result of the face detection module on a multiple face image is shown in Fig. 2.
IEEE TRANS. CIRCUITS SYST. VIDEO TECHNOL.
6
Fig. 2. Face detection result for a scene with multiple faces: on the left, the original picture overlapped with face bounding boxes; the right picture represents the final likelihood as a grey level map.
C. Exploiting foveation for adaptive coding The basic idea is to partition each video frame in smaller regions, using the model to locate the FOA, and then increase the compression rate for increasing distance of the considered region from the FOA. For easy integration and better performance, we have implemented an add-on to existing coders, rather than designing a brand new compression algorithm. The foveation process is thus conceived as a ”filtering” process applied to the frames of the video sequence; the filtered frames are then compressed through the MPEG-4 baseline, a DCT-based block coder, to provide the final compressed sequence. OA Recall that for each frame t a unique FOA xF = t F OA F OA (xt , yt ) is set. Then the maximum normalized frequency detectable by the human eye, say fc (xt ), at a generic point xt = (xt ; yt ) of the frame can be calculated as [9] (see [31] for an in-depth discussion) fc (xt ) = 1 + χ · tan−1
√
1 OA )2 +(y −y F OA )2 (xt −xF t t t V
,
(16)
where V is the viewing distance, and χ = 13.75 is a constant; distance and coordinate measurements are in units of pixels. Thus, if the image is low-pass filtered with a cut-off frequency equal to fc , the human observer does not appreciate any quality degradation. In other terms, the ideal foveation of an image would consist of locally band-limiting the image at coordinates (xt , yt ) to fc (xt , yt ). Unfortunately, the straightforward use of Eq. 16 bears a high computational cost since the maximum detectable frequency fc must be calculated for each point. To gain efficiency, we exploit the approximation proposed in [9] in which only eight values of the maximum detectable frequency fc (xt ) are allowed. As a consequence the image is partitioned in eight regions k = 1, · · · , 8, each having constant maximum detectable frequency fˆck ; in other terms, once a fixation point has been determined, the continuous, exponential decrease of the maximum detectable frequency fc from fixation to periphery is approximated through a stepwise decreasing function represented by the ordered set {fˆck }8k=1 (see [9] for implementation details). The filtering process is applied to the luminance component only, which mostly affects the compression ratio. The filtered frames are eventually provided as input to the video coder. III. E XPERIMENTAL RESULTS In this section we describe the experimental work carried on for i) evaluating the performance of the face detection module, ii) comparing the model with human observers, iii) assessing
the quality of the model compressed video sequence, and iv) measuring the effects of top-down and bottom-up cues on the perceived quality of the compressed sequence. Eventually, we report the compression gain for various configurations of the system. 1) Data set: The modules related to face processing have been tested on a face database including 220 examples from the World Wide Web, H263 and MPEG4 videos. The database contains color images taken under varying lighting conditions and backgrounds. They contained either single and multiple (2 to 20) faces varying in position, scale and orientation (frontal, near-frontal and half-profile views). All the remaining experiments have been carried out on a data set of 10 videos including two kinds of clips: outdoor clips recorded in our campus, with natural statistics similar to the outdoor video used in the subjective quality evaluation procedure; indoor clips, recorded by us or publicly available, showing people acting, moving and talking in laboratory/office environment. They range in duration from 10 to 16 seconds and have different format, CIF to 800 × 600 1 . A. Face detection To test the algorithm, the database was divided into a training set of 100 images (60 single face and 40 multiple faces) used for training and tuning the face detection modules, and a test set of 120 images (60 single and 60 multiple) used for performance evaluation. The two sets have similar statistics in terms of skin color, position, scale and orientation of faces. The algorithm achieved 86.66% (52/60) of correct recognition rate in case of images of single faces. In 68.33% (41/60) of the images with multiple faces, all the faces were correctly recognized, while some of them but not all were correctly recognized in 18.33% (11/60) of the cases. The main source of error in case of images with single face is the presence of skin-like background, while in case of images containing many faces, the main source of error is their reduced size. B. Comparing model’s behavior with human observers’ behavior This first experiment was aimed at comparing model generated scanpaths with those eye-tracked from human observers. In the sequel we will present the results of the experiments on two video clips, both of them lasting about 13 seconds, with 30 fps, totaling 380 frames. All the frames are of P type, with one I-type frame (i.e. without any reference to any previous frames) every 60 frames. They have been chosen after performing the experiments on the whole video set because they are representative of the different behaviors exhibited by the system across all the videos. In particular, they represent how the system reacts to increasing levels of complexity of the scene, and highlight the role played by bottom-up and top-down cues for controlling the gaze shift. It is also worth noting that they do not represent the cases when the proposed system exhibits its best performance. 1 The video sequences can be viewed on the Natural Computation laboratory page: http://nclab.diiie.unisa.it/research.html
IEEE TRANS. CIRCUITS SYST. VIDEO TECHNOL.
In the first one, the One man walking clip, there is a person walking towards the camera in an empty corridor. In the last frames of the video a person appears in the top right part of the background. Nothing else is relevant. Thus, the gaze shift is mostly driven by face perceptual cues, and only at the end bottom-up modules may compete with top-down ones because of the sudden appearance of the person in the background. The second sequence, Two men walking, introduces one more stimulus in the scene with respect to the previous clip. It was recorded in the same environment as the first one, but there is another person that appears on the scene, shoulder to the camera, and walks towards the main subject. Thus, topdown controls the gaze shift most of the time, but when the person enters the scene and moves away, bottom-up processes triggered by novelty and motion compete with object-based cues in attracting the attention of the observer. 1) Building a reference scanpath: The actual scanpath depends on the eye-motor skill of the observers in such a way that even when two observers attended at the same target, during the saccade their eyes may move at different speeds and/or may follow different trajectories, ending up in different points around the object/region representing the ideal target. Hence, albeit looking at the same objects in the same temporal order, their actual scanpaths can be different. Thus, two problems need to be solved to assess the performance of the model: finding a measure of similarity flexible enough to accommodate for a kind of inexact matching between scanpaths, and define the scanpath to whom the scanpath generated by the model should be compared. To solve the first problem, we assume in this study that two scanpaths are similar when their FOAs are spatially and temporally close. The similarity S between two scanpaths is then computed as follows: 1. Perform a temporal scanning of the two scanpaths and extract the frames in which both the observers have a fixation (note that a FOA lasts about 300 msec, which correspond to a few frames); 2. For each frame, calculate the distance d between the FOAs of the two subjects; 3. Increment the number of successes each time d is smaller than a given threshold Td . The similarity S is expressed as the ratio between the number of successes and the number of frames extracted in the first step. Apparently, such straightforward definition does not penalize temporal mismatches in fixations between two observers; clearly, this issue could be addressed by weighting S with the ratio between the number of frames corresponding to the fixations of both observers, and the largest among the number of frames corresponding to the fixations of each observer. However, we have not exploited the latter option because during the experiments to validate the reference scanpath we found evidence that such scaling factor was very similar among different pairs of observers. As with regards to the second problem, we tackled it by defining a ”reference” scanpath, which was compared against the scanpath of our model. Intuitively, such reference scanpath (reference, in the sequel) should include the FOAs common to many observers, while leaving out the FOAs that are observer-specific. The algorithm for computing the reference is the following: 1. For each frame, compute the distances
7
between the FOAs of each pair of observers. If one or both the observers do not have a FOA on that frame set this distance to a very high value; 2. Cluster the FOAs whose distances are smaller than a given threshold Td ; 3. Discard the clusters whose FOAs are common to a set of observers whose number is smaller than a given threshold Tn ; 4. Select the largest cluster among the existent ones; 5. Locate a FOA in correspondence of its center of mass. 2) Subjects: The experiment involved 30 subjects, 13 males and 17 females. All the subjects were students of the school of engineering at our university, aged 19 to 26, with normal vision. None of them was aware of the specific purpose of the experiments. 3) Test environment and experiment design: The subjects seated in front of a 17” LCD monitor at about 60 cm distance. The two videos were presented with a resolution of 800 × 600 at their real pixel size. This setting was adopted to avoid that most of the relevant information in the scene fell within a single foveation. The lighting conditions were of constant artificial light. Under these conditions, the radius R of the foveated region where no filtering occurs is approximately 80 pixels. No specific instructions were provided to the subjects: they were just told to look at the two video clips for what they believed was interesting. Their scanpaths were recorded by using an ASL504 eye-tracking system, coupled with a magnetic head-tracker to avoid restraining the subject head while looking at the clips. The recorded scanpaths were then processed as described before for obtaining the reference used to evaluate our model. 4) Results: The plots in Fig. 3 and Fig. 4 describe quantitatively the results of the experiment for each video clip. The leftmost plots show the distance in pixel d between the FOAs of the reference and those generated by our model, as a function of time. The plot on the top refers to the case when only the bottom-up module is active, while the one on the bottom represents the system behavior when both bottomup and top-down modules are switched on. The rightmost plot reports the similarity S between the reference and those generated by our model, when the top-down channel is turned off and on. These plots were calculated for different values of Td , the threshold used to decide whether different FOAs belong to the same cluster. For selecting the value of Td , we observe that, as mentioned before, in the given viewing condition the fovea corresponds to a circular spot whose radius is about 80 pixels. Accordingly, we have assumed that two observers look at the same spot when their FOAs overlap, at least partially. Thus, Td ranges in the interval [60, 100]. The plots confirm the plausibility of our assumption, in that the similarity S is not heavily influenced by the actual value of Td . Therefore we have set Td = 80, for all the remaining experiments. For the One man walking, the top-left plot (Fig. 3) shows that in case of bottom-up alone, d is larger than Td most of the time, because human observers keep the gaze on the face all the time, while the model is constantly driven by conspicuity and motion, and only occasionally the FOAs of the two are close. This behavior is also highlighted by the peak appearing
IEEE TRANS. CIRCUITS SYST. VIDEO TECHNOL.
after approximately 12 seconds: the model is triggered by the novelty of the person appearing in the background, while the reference observer seems not to note it. On the contrary, the plot at the bottom show that after the face is detected, roughly 9 seconds after the beginning, the simulated FOAs and those of the reference coincide. It is worth noting that, in this case, the model, much like the human observer, is insensitive to the pop-up due to the person appearing in the background. This behavior is reflected in the similarity plot. Apparently, S is only slightly improved when the top-down module is active, but, as noted above, the face detection works only for about 4 seconds. If only the last 6 seconds of the sequence are considered, S jumps to 80% when face detection is on. A similar behavior is observed in the case of the Two men walking clip. Human observers keep the gaze on the face of the main subject, without being distracted by the subject moving away from the camera. The pure bottom-up model, on the contrary, is triggered by novelty and motion, so as to initially focus on the subject moving away from the camera, who is much bigger in size, and then switching to the one approaching the camera when it becomes larger than the other one. Thus, only in this last part of the video there is some overlap between the FOAs of the model with the reference ones, although the former are never located on the face. The behavior of the top-down module is similar for the first half of the clip, but when the face is detected, the FOAs generated by the model almost completely overlap with the reference ones. In this case, however, the similarity plot doesn’t show any difference between the two cases because the distances between the FOA of the pure bottom-up model and the reference ones are smaller than the threshold Td . To gain a better insight of the behavior of the model and of the similarity measure in the latter case, Fig. 5 presents some results obtained on the video clip. In particular, it is worth noting that, when the size of the two subjects becomes almost the same, the distance between the FOAs generated by pure bottom-up model and those of the reference becomes smaller than Td , although the actual FOAs do not overlap. C. Foveated compression performance evaluation (DMOS) This experiment is aimed at evaluating both the quality of the proposed compression technique and the compression gain. We will present the results of these experiments on three video clips, CIF format 4 : 2 : 0. They have been chosen after performing the experiment on the whole video set because they are representative of the system behavior across all the videos. In particular, two of them (Akiyo and News) have been selected because largely used in the literature and therefore should allow a better comparison between our method and those proposed by other authors. Each clip lasts 10 seconds, with 30 fps, totaling 300 frames. All frames are of P -type, with one I-type frame every 60 frames. The first sequence is the Akiyo clip (A), where both the background and foreground are quite static since it is a shot of studio TV news where the speaker’s face is viewed frontally. Nothing else is relevant in the scene. Thus the gaze shift is driven mostly by face perceptual cues.
8
The second sequence is the Homemade clip (H), specifically recorded for the experiments. The clip shows an outdoor closeup of a young man talking to the camera. During the shot a car enters the field of view, somehow animating the background. The car moves from right to left, being hidden when passing behind the head of the young man. Thus, top-down controls the gaze shift most of the time, but when the car enters the scene and moves around, bottom-up processes triggered by novelty and motion compete with object-based cues in attracting the attention of the observer. An even more complex sequence is the third one, News (N). This clip is richer in stimuli, in that there are two speakers in the foreground (”head and shoulders”), and the background is animated by two ballet dancers whose face sizes are however very small compared to those of the speakers. Thus, gaze shift control results from two levels of competition: the competition between the faces of the two speakers, and the one between top down and bottom-up cues. A fourth video sequence, the well known Mother and Daughter clip, (Mother for short, M) has been used as placebo during the experiments reported in the following. 1) Test method and experiment design: The quality evaluation has been estimated following the protocol reported in the Recommendation P.910 of ITU-T [21]. This protocol, called DCR, Degradation Category Rating, implies the presentation of pairs of video sequences: the first stimulus presented in each pair is the reference, (in our case the original video), while the second stimulus is the source under test (in our case the foveated video). Each video is presented for 10 seconds, with 2 seconds of black screen between the first and the second sequence. After the reproduction of the pair, there are 10 seconds for the observer to rate the quality of the second video with regards to the first one. The following five-level scale for rating the impairment has been used: Imperceptible; Perceptible but not annoying; Slightly annoying; Annoying; Very annoying. 2) Source signals: As mentioned before, the purpose of this experiment was to evaluate the perceived degradation of the MPEG-4 encoded video sequences due to the foveation filtering process. Each pair of video clips required by the DCR protocol was made by an MPEG-4 video sequence encoded with a variable quantization coefficient qˆ followed by the same video clip filtered by foveation and MPEG-4 encoded with the same quantization coefficient qˆ. In the following, we will denote by M q(n) and F M q(n) respectively, the first and the second video clip of each pair. Eventually, the placebo and its identical replica has been added to the source signal, to evaluate the reliability of the test. To appraise the influence of the MPEG coding on the quality perceived by the subjects, every pair but the placebo one has been encoded with qˆ = 2, 3, 6, 10, 15. The placebo has been encoded with qˆ = 6, regardless of the quantization factor of the other stimulus pairs. In order to reduce the stress on subjects, this experiment has been performed by showing to each subject a sequence containing only three video clips and the placebo one, so as have the same number of observers for each video and for each quantization parameter. Thus, for each session, we have n = 1, 2, 3.
IEEE TRANS. CIRCUITS SYST. VIDEO TECHNOL.
(a)
9
(b)
(c)
Fig. 3. One man walking. Distance d between the FOAs, (a) and (b); similarity S between simulated and reference scanpath, (c), with/without face detection.
(a)
(b)
(c)
Fig. 4. Two men walking. Distance d between the FOAs, (a) and (b); similarity S between simulated and reference scanpath, (c), with/without face detection.
Fig. 5. Model generated scanpaths with and without face detection compared with the reference on an excerpt of Two men walking. Crosses show the FOAs of the reference, circles represent the FOAs obtained using the full model and triangles those generated by the model when face detection is turned off.
3) Subjects: The test involved 100 voluntary subjects, 53 females and 47 males. All of them were Italian, with the following characteristics: i) age inclusive between 18 and 40 years; ii) 72% were undergraduate students and the remaining 28% graduate; iii) 59% were students from humanistic schools, while the remainder were from scientific schools; nearly all the graduates, had instead a scientific degree; iv) none of the subjects had any precedent knowledge on the theories inherent the test as well as on the purpose of the experiment. 4) Instruction to subject and training session: Before starting the test, the subjects were told that they would have seen four video clip pairs, and that their task would have been to rate the quality of the second video clip of each pair in comparison to the first one. To this purpose, they were provided with a form containing the following instructions (in Italian): ”For each video clip that will be presented on the screen look at what you believe are the most interesting things happening. Rate the difference between the second clip of the pair with respect to the first one by using the rating scale reported in the form. Please, fill the form with your age, sex high-school degree, university degree (if any) and the school you are attending at the university. When ready, click on start to begin the session”. 5) Tests environment: All the experimental session took place in a computer room with 30 workstations. Each work-
station was equipped as follows: i) a PC with a CPU Intel Pentium IV 2.60 GHz, 1 GB RAM, a video card ALL-INWONDERS 9200 SERIES, and a Monitor PHILIPS 170B4; ii) Microsoft Windows 2000 - Service Pack 4 operating system; iii) OptiPixPlus software to play the video: this software is very light and permits the reduction of the bar on the screen. As regards viewing conditions, every viewer seated at a distance of 75 cm from the monitor; the video size was of 352 × 288 pixels (CIF Format). This viewing distance was chosen so as to simulate the typical viewing distance in case of a PDA, which is the target device for the application. In particular, we have considered that: i) the typical viewing distance for a PDA screen is about 45 cm; ii) a PDA HP iPAQ H5550 series has a screen size of 8 × 6 cm; iii) on the PHILIPS Monitor with a resolution of 800 × 600 pixels, the dimension of a CIF image is 15 × 12 cm. Table I reports the actual value of the parameters that specify the viewing conditions. 6) Test procedure: As already mentioned, 4 video pairs were shown to every viewer: the first three of the type Mq(i), FMq(i), the fourth one, the placebo, of the type Mq(4), Mq(4). To avoid any possible bias, the order of presentation of the first three pairs was differently shuffled for each viewer, as it will be explained in the next subsection, but all the pairs shown to a viewer were encoded with the same value for qˆ.
IEEE TRANS. CIRCUITS SYST. VIDEO TECHNOL.
10
TABLE I V IEWING CONDITIONS .
TABLE III I NFLUENCE OF STIMULUS ORDER ON THE MOS RESULTS . NH, AH, MH, DENOTE News/Homemade, Akiyo/Homemade, Mother/Homemade
Parameter
Setting
Viewing distance (Note 1)
75 cm
Peak luminance of the screen
130 cd/m
Ratio of luminance of inactive screen to peak luminance
0.04
Ratio of the luminance of the screen, when displaying only black level in a completely dark room, to that that corresponding to peak white
0.1
Ratio of luminance of background behind picture monitor to peak luminance of picture (Note 3)
10 lux
TABLE II DCR MOS RESULTS . H
N
M
avg
std
avg
std
avg
std
avg
std
2
4.30
0.86
3.35
1.09
2.05
0.94
4.05
1.15
3
4.40
0.68
3.10
0.85
1.65
0.75
4.40
0.82
6
4.15
0.67
3.35
0.99
1.80
0.77
4.60
0.60
10
4.20
0.77
3.60
1.19
2.50
0.76
4.25
0.79
15
4.15
0.75
3.65
0.99
2.50
0.95
4.70
0.47
Thus, recalling that we have used 5 different values of qˆ, for any given qˆ we had 20 subjects evaluating each of the four pairs. 7) Results: The quantitative results of the experiment are reported in table II and in Fig. 6. In the table, each row refers to a different value of the quantization coefficient qˆ and reports the average score and the standard deviation for each video sequence, respectively. The scores were obtained by assigning 5 points to the best quality (imperceptible), down to 1 point assigned to the worst one (very annoying). The data in the table allow for either general comments about the behavior of the subjects independently on the stimulus, and for more specific remarks.
Fig. 6.
NH
AH
MH
avg
std
avg
std
avg
std
avg
std
2
3.50
0.26
4.13
0.41
2.50
0.23
2.25
0.20
3
4.00
0.32
3.25
0.47
2.50
0.23
2.50
0.23
6
3.88
0.50
3.25
0.44
2.50
0.21
2.50
0.21
10
4.13
0.48
3.38
0.50
3.00
0.32
3.25
0.18
15
4.50
0.23
4.00
0.32
2.50
0.23
3.25
0.20
D65
Background room illumination (Note 3)
A
First
0.15
Chromaticity of background (Note 4)
q
q
DCR MOS Result (the y axis represents the perceived quality).
First of all, the data on the video Mother undoubtedly suggests that the subjects who participate to the experiment were not biased: they consistently rated the quality of the placebo video sequence as the best one. On the other hand, the standard deviation is unexpectedly high, indicating that, depending on the video clip, the rating varies from 1 to 4
or from 2 to 5, and such a behavior seems in contrast with the previous observation on the reliability of the test. Actually, this behavior can be explained by the data reported in table III. They show, for different values of the quantization coefficient qˆ, the rating for the video Homemade depending on the first video of the sequence. As table shows, when the video is the first in the sequence, or when the first video of the sequence is News, whose quality is worst, Homemade receives a higher score than in the cases when the first video of the sequence is either Akiyo or Mother, whose quality is better. Independently of the order, moreover, the standard deviation is much smaller than in the previous cases, as expected. Similar data have been obtained for the other video clips. As a whole, they suggest that the first stimulus is often used by the subject for a personal tuning of the DMOS scale, and such a tuning strongly affects the evaluations made later. D. Comparison with pure bottom-up cues This experiment was aimed at evaluating the improvement in the perceived quality of compressed video sequence due to the use of top-down cues as opposed to pure low level cues. The experiment has been performed for all the 10 video clips of our data set, but, as before and for the same reasons, we will show the results on the same video clips used in the previous section. 1) Test method and experiment design: The comparison has been carried on by following the ACR (Absolute Category Rating) protocol III-C. As in the previous experiment, a five-level scale was used for rating: Excellent; Good; Fair; Unsatisfactory; Poor. 2) Source signals: For each of the 3 video clips, the sequence of stimuli required by the ACR protocol was made of 3 video sequences, all of them MPEG-4 encoded with qˆ = 6. The first one was the original sequence, the second one was filtered by the FOAs detected by using only bottom-up cues, the third and last filtered by using the full model. After this sequence, a placebo one, made of 3 identical replica of the clip Mother was shown to each subject to evaluate the reliability of the test. 3) Subjects: For this experiments, we involved 60 subjects. Their characteristics were similar to those employed in the previous experiment, but none of them was involved in both. 4) Instruction to viewers and training session: Before starting the test, the subjects were told that they would have seen 6 video clips, and that their task would have been to rate the
IEEE TRANS. CIRCUITS SYST. VIDEO TECHNOL.
11
TABLE IV ACR MOS RESULTS . BU avg Mother
3.88
BU+TD std
avg
std
3.88
Original avg
std
3.88
Akiyo
1.86
0.73
3.57
0.87
3.71
0.78
Homemade
1.86
0.66
2.86
0.66
3.86
0.66
News
2.05
0.87
1.81
0.87
4.43
0.60
quality of each of them. To this purpose, they were provided with a form containing the following instructions (in Italian): For each video clip that will be presented on the screen look at what you believe are the most interesting things happening and rate its quality by using the scale reported in the form. Please, fill the form with your age, sex high-school degree, university degree (if any) and the school you are attending at the university. When ready, click on start to begin the session. 5) Test environment: The test environment was the same used in the previous experiment. 6) Test procedure: To every viewer 6 video sequences were shown. The first 3 were randomly shuffled among different viewers in such a way to have 20 viewers for each of the 3 video clips used in the experiments, while the placebo was shown to all of them. 7) Results: The quantitative results of the experiment are reported in table IV, in terms of the average score and the standard deviation for each video sequence. The scores were obtained by assigning 5 points to the best quality (excellent), down to 1 point assigned to the worst one (unbearable), and averaging them among the 20 viewers to which each clip was shown. Note that the first row of the table, reporting the score for the original placebo, is meant just to provide the upper limit to the score assigned by the viewers. The data on the “Original” clips confirm the reliability of the test, as well as the absence of any bias among the subjects, in that the quality of the unfiltered sequences is consistently better than in case of the filtered ones. The data in the second and in the third row show that including top-down face-based cues significantly improved the quality of the video sequence with respect to those processed only by bottom-up cues. The results confirm that the perceived quality of the video sequence increases as far as the foveation provided by the system resembles that of the subjects. Eventually, the data on the fourth row, show that when the top-down cues are less reliable, the perceived quality only slightly decreases. Overall, the comparison between the data in the “BU+TD” column and in the “Original” column indicates that the gain in the perceived video quality when object-based cues are properly exploited is much bigger than when they are misleading, as for the video News. Those trends are better illustrated in Fig. 7. E. Compression gain Table V reports the file sizes obtained by encoding the original sequence and the filtered one as explained in Section 3, for the five different values of the quantization parameter qˆ. The compression gain for a given qˆ is eventually expressed,
Fig. 7.
ACR MOS Result (the y axis represents the perceived quality).
in percentage, as the ratio Cqˆ = ((O − F )/O) ∗ 100, where O is the file size of the original video sequence and F the file size of the filtered one. The data show that, as expected, the compression gain due to foveation decreases for increasing quantization factor. They also suggest that for a specific video, when the target bit-rate is below some value, the foveation process itself will be ineffective because the gain is too small. Eventually, the data provide evidence that the video sequence Homemade exhibits the highest compression rate since having a great deal of high frequency details due to the camera flickering. The bolded entries in table V refer to cases when, due to the setting of the quantization parameter, the difference δ between the perceived quality of the original and foveated sequence is the smallest. It is worth noting that δ = 0.12 in case of the Akiyo clip and δ = 0.97 in case of the Homemade one. Since those values are smaller than the standard deviations reported in table II, it is reasonable to claim that the reported compression gains, namely 26.88 and 36.22 respectively, were achieved without reducing the perceived quality of the video. This seems not to be the case for the News clip, since there δ = 1.87, more than twice bigger than the standard deviation. Nonetheless, the compression gain of 12.85 is still meaningful because, during another DMOS experiment, performed under the same conditions as before with qˆ = 10, in which 20 viewers were shown only this sequence, 6 viewers rated the difference as perceptible, 10 as slightly annoying and only 4 of them rated it as very annoying. F. Computational complexity As regards the efficiency of the method, consider that each frame in the video sequence is a color image having spatial support on the lattice Ω ⊆ Z 2 , and denote |Ω| the lattice dimension (number of samples points in Ω) The complexity of bottom-up processing relates to pyramid computation, static/dynamic saliency and the detection of novelties. Multi-resolution pyramid is an O(|Ω|) method for computing a sampled scale space. For what concerns motion analysis, we implemented Anandan’s, correlation based algorithm, but used the sum of absolute differences (SAD) instead of the SSD for efficiency reasons. Considering a patch radius P and a search radius R a straightforward implementation would require O(|Ω|P 2 R2 ) pixel comparisons, but since there
IEEE TRANS. CIRCUITS SYST. VIDEO TECHNOL.
B IT- RATE (K BPS ) AND FILE
SIZE
12
TABLE V (KB) ARE REPORTED FOR BOTH O = O RIGINAL AND F = F OVEATED , AND THEN C =
Akiyo q 2 3 6 10 15
O 683 430 158 84 56
833.82 525.26 192.81 102.01 67.94
F 500 319 126 71 50
609.69 388.78 153.77 86.17 61.09
C (%) 26.88 25.98 20.24 15.53 10.08
O 1200 754 214 108 68
Homemade F
1464.93 920.11 260.74 131.86 83.31
are redundant comparisons one can reduce to O(|Ω|R2 ) by storing intermediate results (which however increases memory bandwidth). Novelty features znew are obtained via frame t difference, thus their computation is linear in the lattice dimension. Since it is calculated at the lowest level of the image intensity Gaussian pyramid, namely at scale 4, a reduction factor 1 : 16 is achieved with respect to |Ω|, thus the time complexity of this step is given by |Ω|/16 time units. Thus, the complexity of bottom analysis is O(|Ω|R2 ). Top-down analysis involves the preliminary skin detection, the formation of a candidate face list, and face likelihood computation. Skin detection relies upon a Gaussian mixture density classifier, which is significantly expensive along the training phase of skin and non-skin mixture models. However, after training, classification only requires all Gaussians to be evaluated in computing the probability of a single color value, followed by comparison between values, which can be done in constant time; thus, skin classification is O(|Ω|); note that classification time can be further reduced by using look-up tables; clearly, this solution increases memory requirements that otherwise only require storage of the pdf floating point parameters ( ≃ 1 Kbyte). The result of this step is a skin map with spatial support in some regions of Ω, say Υ ⊂ Ω. The DST has a complexity O(|Ω|r2 ), r being the radius of the circle around the point in which symmetry is evaluated. Meanwhile, the eye analogue map is obtained at the highest resolution level of the image intensity Gaussian pyramid, that is the original intensity channel of the frame zint (·) and is calculated by checking if pixel values zint (x) satisfy a number of constraints, all based on the computation of an averaging function over a window of dimensions (hx , hy ) and centered on x ∈ Ω; by factorizing the summation over the window into a row summation followed by a column summation [28], averaging can be computed in O(Ω) time for all x, no matter the window dimension. Thus the computational complexity of candidate face box placement is determined by the DST step, and can be accomplished in O(|Ω|r2 ) time. Assume a number of NF candidate faces in the observed frame, and that each candidate face box RF ⊂ Ω, has dimension |RF |. In order to assess the reliability of a candidate face, note that skin distribution and its corresponding likelihood is linear in the candidate face support, O(|RF |); since each cheek area has approximately |RF |/6 dimension, the computation of the |Rtex | ratio and related likelihood function (Eq. 11) is O(|RF |/3); the operations to find the eye map and the mouth map are both linear in the number of pixels of the face support |RF |, while comparison with template t is O(max(|Al |, |Ar |)) and O(|Am |), for eyes and mouth,
575 365 136 77 55
702 445.51 166.29 93.98 67.22
COMPRESSION GAIN
News C (%) 52.00 51.58 36.22 28.72 19.32
O 1290 830 342 187 123
1575.03 1013.48 417.53 228.7 150.23
947 630 278 163 115
F
C (%)
1156.33 768.96 338.84 199.32 140.45
26.58 24.13 18.85 12.85 6.50
respectively, with {Al , Ar , Am } ⊂ RF Thus, for a given frame, face likelihood computation is O(NF |RF |). As a final remark, foveation coding is assumed equivalent to filtering an image and its computational complexity is almost the same as that for separable 2-D FIR filtering of video frames [9], if performed in the spatial domain and much faster in the DCT domain. For instance, in terms of overhead relative to the uniform resolution baseline H.263 encoder, spatial domain foveation approximately introduces a 27% overhead, and DCT domain foveation a 1.5% overhead [31]. Summing up, we can expect that most of the time per frame will be spent in the optical flow stage, for what concerns the bottom-up computation; it is worth noting, that although pyramid construction is linear in time with the number of pixels, it requires a sufficient memory bandwidth, with special reference to the overcomplete representation of oriented pyramids (see [22], and [32] for detailed discussion). At the same time the DST dominates the top-down computation; also, note that face likelihood algorithms will have higher efficiency, either in space and time, since only performing on a sparse representation of the frame (face boxes) (NF ≤ 5). This is experimentally confirmed from the results obtained and reported in Table VI showing the average processing time per frame on a PC with a CPU Intel Pentium IV 2.40 GHz, 1 GB RAM. It is worth noting that the current prototype has been implemented using the Java programming language, running in Windows XP operating system, without any specific optimization. Clearly, for time critical applications, the bottlenecks of the proposed method, could be easily reduced by resorting to existing hardware implementation of pyramidal representations ( [33]) and more efficient realizations of the optical-flow scheme, such as real-time optimization [34] or the multiscale algorithm with complexity O(N ) proposed by Liu et al. [35]. Also the DST can gain significant speed-up if a fast version is considered [27]. IV. D ISCUSSION AND CONCLUSION We have proposed an approach to video compression that relies on a foveation model in order to automatically determine the fixation points. The model does not rely on purely bottom-up mechanisms, but attempts to account for the cooperation/competition between bottom-up/spatial-based and top-down/object-based cues, namely the presence of human faces in video. Once a FOA is located on a frame, this can be partitioned in sub-regions so to increase the compression rate as the distance between each considered region and the FOA increases. The integration of bottom-up and top-down information has been conceived within a Bayesian framework. The elegant
IEEE TRANS. CIRCUITS SYST. VIDEO TECHNOL.
13
TABLE VI AVERAGE FRAME PROCESSING TIME . Processing levels Sub Steps
Bottom up Contrast Motion
Novelties
Top down Skin detection
Eye detection
Face likelihood
Elapsed time (ms)
26
25
15
115
70
130
work of Torralba [11] shares with the work presented here the approach of solving cue integration from ”first principles”, which in a Bayesian framework amounts to the extensive use of Bayes’ rule to merge physical information with contextual information. In a similar way, we define low-level saliency in terms of Shannon’s information (inverse probability −1 p(zlow ), although we take into account a wider set of lowt ) level cues, like color and motion and novelty features, since dealing with temporal information; also, due to the dynamics of the scene, habituation factors are modeled. Beyond the fact that [11] does not address the problem of video and video coding, one major difference is in the use of contextual features; here we do not take into account neither scene context (thus avoiding the controversial use of global features), nor scene constraints on objects (for us a face can either appear in outdoor natural scene or in indoor environments). For what concerns the specific issue of exploiting face cues for video coding, Daly et al. [36] have developed methods that adapt quantization in video coding according to human visual sensitivity, under the assumption that the viewer will most likely gaze at human faces. However, they strictly address video phone and video conferencing applications and this way they are able to assume that faces can be obtained by simple frame difference, while we avoid such restrictions and allow other moving objects to be present in the scene. They also exploit one foveation point, though their method similarly to the one proposed here could in principle be extended to multiple points. Yang and Robertson [37], more similarly to the work presented here, exploit a face detection technique based on color and structural features, which improves over [36]; however they do not address the foveation problem and handle multiple faces in the framework of multiple region of interest coding. The model has been validated by directly comparing its scanpath to a ”reference” one, obtained by a suitable merge of the scanpaths of human observers provided by an eye-tracker. Such a validation procedure was a demanding task, since eye movements depend on many factors, often involving cognitive evaluation of the scene. Moreover, different observers exhibit different eye movements idiosyncrasies. The experiments have shown that integrating top-down face cues with bottomup/spatial based information leads to a model whose scanpaths are very similar to those of human observers and that this is independent on the semantic content of the video clip. The performance of the video compression system, evaluated with respect to the perceived quality of the foveated videos, allows for the following observations. The high score attained by Akiyo is due to its simplicity: as already noted, face perceptual processing is the only one which comes into play: the compression gain can be achieved without compromising
quality. For what concerns the Homemade sequence, most of the time the FOA is placed in the center of the speaking head and it mimics the observer’s behavior until the car enters the scene. At this point the low-level processes are suddenly activated. However, the saliency of the moving car is still lower than that of the face, and thus the model keeps the gaze on the face. As time passes by, the habituation factor reduces the relevance of the face and eventually the moving car becomes the most relevant object in the scene: at this point the model shifts the FOA towards the car, which is not likely to correspond to an actual observer gaze. The poor score attained by News mainly depends on both the strong bias towards faces and the reduced size of the dancers, which leads to weak bottom-up cues. Accordingly, the FOAs move from one speaker’s head to the other’s, only relying on face placement and on habituation. On the contrary, as it is shown in Fig. 8, human observers focus on the dancers and pay attention to the speakers only occasionally. This is an interesting example of how human observers’ behavior is biased by cognitive assumptions (relying upon the fact that speaker’s faces are unlikely to undergo a sudden change in TV news context), henceforth dynamically adapting the loss of interest factor. Modeling such a behavior is clearly beyond the purpose of this paper. The pure bottom-up model is dominated by motion and therefore keeps the gaze constantly on the dancers, very similarly to human observers. The unsatisfactory performance on News, indicates some directions for further investigation. For instance, performance could be improved in a combined video-audio stream by placing the FOA on the head of the person who is actually speaking, through a suitable lip movement detector. Also, a more sophisticated model of eye motor control could be developed so to simulate the persistence of the FOA, which for a human observer is about 0.3 sec. This means that a FOA should persist for at least 7-8 frames, assuming that the video is captured at 30 fps. In our current model, on the contrary, we locate one FOA on each frame and this leads to a much higher frequency of saccadic movements with respect to those of human observers. While this high frequency of saccades does not introduce any artifact in static or slowly moving scenes, it may become one of the sources of the ”loss of synchronism” between the model and the human observers, which is one of the factors in determining the unsatisfactory performance - in terms of perceived quality - in the case at hand. Eventually, to improve the perceived quality and obtain a less ”blocky” foveation, the pyramidal coding technique proposed in [38] could be used in place of [9]. A distinctive aspect of this study is quality evaluation through the standard DMOS procedure during a measurement campaign involving 100 subjects. Such extensive campaign has
IEEE TRANS. CIRCUITS SYST. VIDEO TECHNOL.
14
Fig. 8. Scanpaths generated by the model and by exploiting low-level/spatial-based cues alone compared with the reference on the News clip. Crosses show the FOAs of the reference, circles represent the FOAs obtained using the full model and triangles those generated by the bottom-up model.
shown that integrated foveation represents an effective way to further improve the compression gain of existing MPEG4 encoders without compromising the quality of the video. The comparison of the results achieved in the experiments indicates that exploitation of top-down cues is always a good choice, since the gain in the perceived quality due to consistent exploitation of perceptual cues is much higher than the loss that may occur when such cues are unreliable or poorly handled. ACKNOWLEDGMENTS The authors are grateful to the Referees and Associate Editor, for their enlightening and valuable comments. R EFERENCES [1] Z. Wang and A. C. Bovik, “Embedded foveation image coding,” IEEE Trans. Image Processing, vol. 10, no. 10, pp. 1397–1410, 2001. [2] Z. Wang, L. Lu, and A. C. Bovik, “Foveation scalable video coding with automatic fixation selection,” IEEE Trans. Image Processing, vol. 12, pp. 1–12, 2003. [3] L. Itti, “Automatic foveation for video compression using a neurobiological model of visual attention,” IEEE Trans. Image Processing, vol. 13, no. 10, pp. 1304–1318, October 2004. [4] A. Yarbus, Eye Movements and Vision. New York: Plenum Press, 1967. [5] D. Noton and L. Stark, “Scanpaths in eye movements during pattern perception,” Science, vol. 171, no. 968, pp. 308–311, 1971. [6] S. Lee, M. S. Pattichis, and A. C. Bovik, “Foveated video quality assessment,” IEEE Trans. Multimedia, vol. 4, pp. 129–132, 2002. [7] L. Sanghoon and A. C. Bovik, “Fast algorithms for foveated video processing,” IEEE Trans. Circuits Syst. Video Technol., vol. 13, no. 2, pp. 149–162, Feb. 2003. [8] S. Lee, M. S. Pattichis, and A. C. Bovik, “Foveated video compression with optimal rate control,” IEEE Trans. Image Processing, vol. 10, p. 977992, July 2001. [9] H. R. Sheikh, S. Liu, B. L. Evans, and A. C. Bovik, “Real-time foveation techniques for h.263 video encoding in software,” in Proc. IEEE International Conference on Acoustic, Speech, and Signal Processing (ICASSP’01), vol. 3, Salt Lake City, USA, May 2001, pp. 1781–1784. [10] D. A. Chernyak and L. W. Stark, “Top–down guided eye movements,” IEEE Trans. Syst., Man, Cybern. B, vol. 31, pp. 514–522, 2001. [11] A. Torralba, “Modeling global scene factors in attention,” J. Opt. Soc. Am. A, vol. 20, no. 7, pp. 1407–1418, 2003. [12] Y. Sun and R. Fisher, “Object-based visual attention for computer vision,” Artificial Intelligence, vol. 146, pp. 77–123, 2003. [13] M. Dorr, M. Bohme, T. Martinetz, K. Gegenfurtner, and E. Barth, “Variability of eye movements on natural videos,” in Proc. 8th Tubingen Perception Conference, Tubingen, Germany, Feb. 2005, p. 162. [14] L. Stelmach, W. Tam, and P. Hearty, “Static and dynamic spatial resolution in image coding: An investigation of eye movements,” in Proceedings of SPIE, ser. Human Vision, Visual Processing and Digital Display II. Bellingham, WA: SPIE, 1991, vol. 1453, pp. 147–152. [15] L. Stelmach and W. Tam, “Static and dynamic spatial resolution in image coding: An investigation of eye movements,” in Proceedings of SPIE, ser. Human Vision, Visual Processing and Digital Display V, B. Rogowitz and J. Allebach, Eds. Bellingham, WA: SPIE, 1994, vol. 2179, pp. 90–98.
[16] V. Tosi, L. Mecacci, and E. Pasquali, “Scanning eye movements made when viewing film: preliminary observations,” Int. Journal of Neuroscience, vol. 92, no. 1-2, pp. 47–52, 1997. [17] R. B. Goldstein, R. Woods, and E. Peli, “Where people look when watching movies: Do all viewers look at the same place?” Computers in Biology and Medicine, vol. 37, no. 7, pp. 957–964, 2007. [18] A. Yuille and D. Kersten, “Vision as bayesian inference: analysis by synthesis?” Trends Cogn. Sci., vol. 10, no. 7, pp. 301–308, 2006. [19] N. Kanwisherand and M. Moscovitch, “The cognitiveneuroscience of face processing: an introduction,” Cognitive Neuropsychology, vol. 17, p. 111, 2000. [20] A. Torralba, “Contextual priming for object detection,” Int. J. of Computer Vision, vol. 53, pp. 153–167, 2003. [21] ITU-T Recommendation P.910: Subjective video quality assessment methods for multimedia applications, International Telecommunication Union Std., 1996. [22] L. Itti, C. Koch, and E. Niebur, “A model of saliency-based visual attention for rapid scene analysis,” IEEE Trans. Pattern Anal. Machine Intell., vol. 20, pp. 1254–1259, 1998. [23] P. Anandan, “A computational framework and an algorithm for the measurment of visual motion,” Int. J. of Computer Vision, vol. 2, pp. 283–310, 1989. [24] G. Boccignone, M. Ferraro, and P. Napoletano, “Diffused expectation maximisation for image segmentation,” Electron. Lett., vol. 40, no. 18, pp. 1107–1108, 2004. [25] M. Jones and J. Rehg, “Statistical color models with application to skin detection,” Int. J. of Computer Vision, vol. 46, no. 1, pp. 81–96, 2002. [26] D. Reisfeld, H. Wolfson, and Y. Yeshurun, “Context-free attentional operators: the generalized symmetry transform,” Int. J. Comput. Vision, vol. 14, no. 2, pp. 119–130, 1995. [27] V. D. Ges´u and C. Valenti, “Symmetry operators in computer vision,” Vistas in astronomy, vol. 40, no. 4, pp. 461–468, 1996. [28] Z. Zhou and J. Wu, “Efficient face candidate selector for face detection,” Pattern Recognition, vol. 36, no. 5, pp. 1175–1186, 2003. [29] W. Huang and R. Mariani, “Face detection and precise eyes location,” in Proc. 15th Int. Conference on Pattern Recognition (ICPR’00), vol. 4. IEEE Computer Soc. Press, Sep. 2000, pp. 722–727. [30] R. Hsu, M. Abdel-Mottaleb, and A. Jain, “Face detection in color images,” IEEE Trans. Pattern Anal. Machine Intell., vol. 24, no. 5, pp. 696–706, 2002. [31] H. R. Sheikh, B. L. Evans, and A. C. Bovik, “Real-time foveation techniques for low bit rate video coding,” Journal of Real-Time Imaging, vol. 9, no. 1, pp. 27–40, Feb. 2003. [32] H. Greenspan, S. Belongie, R. Goodman, P. Perona, S. Rakshit, and C. Anderson, “Overcomplete steerable pyramid filters and rotation invariance,” in Proc. IEEE CVPR, Seattle, Jun. 1994, pp. 222–228. [33] P. Burt, “A pyramid-based front-end processor for dynamic vision applications,” Proc. of the IEEE, vol. 90, no. 7, pp. 1188–1200, 2002. [34] T. Camus, “Real-time quantized optical flow,” The J. of Real-Time Imaging, vol. 3, pp. 71–86, 1997. [35] H. Liu, R. Chellappa, and A. Rosenfeld, “Fast two-frame multiscale dense optical flow estimation using discrete wavelet filters,” J. Opt. Soc. Am. A, vol. 20, no. 8, pp. 1505–1515, 2003. [36] S. Daly, K. E. Matthews, and J. Ribas-Corbera, “Face-based visuallyoptimized image sequence coding,” in Proc. IEEE ICIP ’98, vol. 3, Nagoya, Japan, Oct. 1998, pp. 443–447. [37] L. Yang and M. Robertson, “Multiple-face tracking system for general region-of-interest videocoding,” in Proc. IEEE ICIP 2000, 2000, pp. 347–350. [38] W. S. Geisler and J. S. Perry, “A real-time foveated system for lowbandwidth video communication,” in Proc. SPIE, vol. 3299, 1998, pp. 294–305.