intervals are chosen to be sufficiently small so that mul- tiple intakes are unlikely .... The shaded bars represent the 90% credible interval (5% to. 95%) for those ...
Radiation Protection Dosimetry Vol. 98, No. 2, pp. 191–198 (2002) Nuclear Technology Publishing
BAYESIAN INTERNAL DOSIMETRY CALCULATIONS USING MARKOV CHAIN MONTE CARLO G. Miller, H. F. Martz, T. T. Little and R. Guilmette Los Alamos National Laboratory Los Alamos, NM 87545, USA Received June 13 2001, amended October 4 2001, accepted October 22 2001 Abstract — A new numerical method for solving the inverse problem of internal dosimetry is described. The new method uses Markov Chain Monte Carlo and the Metropolis algorithm. Multiple intake amounts, biokinetic types, and times of intake are determined from bioassay data by integrating over the Bayesian posterior distribution. The method appears definitive, but its application requires a large amount of computing time.
INTRODUCTION Internal dosimetry is concerned with the problem of determining the radiation dose to workers caused by forms of radiation that cannot be measured directly (as with a dosimetry badge). If, for example, the ␣-emitting nuclide 239Pu is inhaled, it will impart radiation dose to the lungs, and after dissolving will be absorbed to blood and deposited in the bone and liver, imparting dose to these organs. Monitoring for exposure to 239Pu is done by making bioassay measurements (for example, urine, faecal, lung count, etc.). The measurements are interpreted using biokinetic models that describe how 239Pu is transported through the body. The biokinetic models describe how a unit amount of material taken into the body in a certain way (for example, inhalation) will later in time appear in various bioassay compartments (for example, the lungs, urinary excretion) and how radiation dose will be accumulated in the course of time in the different body organs and tissues. Standard biokinetic models have been proposed by the International Commission on Radiation Protection (ICRP) (e.g., ICRP publications 30, 54, 66, and 78) (1–5). Given a set of agreed-upon biokinetic models, the inverse problem of internal dosimetry is to use the bioassay measurements to infer if and when intakes may have occurred and the magnitude of the resultant radiation dose to the worker. In using intake-based biokinetic models a determination of the time and amount of intakes and an assessment of the 50 y effective whole body dose to the worker (the CEDE) associated with each intake is required. The process obviously entails considerable uncertainty, so quantitatively assessing uncertainty is also of great importance. The authors have been pursuing a Bayesian statistical approach to this problem(6–11). The present work
Contact author E-mail: guthrie얀lanl.gov 191
describes a method that extends the previous work and appears to be definitive. FORMULATION OF THE PROBLEM In the problem of internal dosimetry there are M bioassay data yj taken at times tj for j = 1,M. From these data the determination of N possible intakes with amounts i, biokinetic types li, times of intake ti, for i = 1,N is sought. The intake times are ordered, so that t1 ⬍ t2 ⬍ . . .tN. The domain of time ti is the time interval ⌬ti. That is, ti is in the interval ⌬ti. The intervals ⌬ti cover the time domain of all possible intakes in a nonoverlapping and ordered way. The time intervals are often chosen to be the times between successive bioassay measurements, in which case N = M − 1. The time intervals are chosen to be sufficiently small so that multiple intakes are unlikely in any interval. Using the notation Y ⬅ 兵y1,y2,. . .yM其
(1)
⌶ ⬅ 兵1,l1,t1,. . .N,lN,tN其,
(2)
the problem is to determine the parameters ⌶ from the data Y. Using Bayes’ theorem, the probability distribution of ⌶ given Y can be immediately written down as P(⌶兩Y) ⬀ P(Y兩⌶)P(⌶)
(3)
that is, the probability of particular values of the parameters given the data is proportional to the probability of the measured values of the data given the parameters (the likelihood function) times the prior probability of the parameter values. The calculational problem is then to integrate (or sum) over the full detailed posterior probability distribution function in order to determine the marginal probability distribution of quantities of interest. The multi-dimensional integration problem is well suited to the Markov Chain Monte Carlo Method (12) using the Metropolis algorithm (see Appendix 1) (13).
G. MILLER, H. F. MARTZ, T. T. LITTLE and R. GUILMETTE
The likelihood function P(Y兩⌶) is of the form
冢冘 M
P(Y兩⌶) ⬀ exp
ᏸj(⌶)
j=1
冣
(4)
because of the assumed independence of the M measurements, where ᏸj(⌶) is the log-likelihood function for the jth measurement. The prior probability distribution P(⌶) is taken to be of the form
写 N
P(⌶)d⌶ =
P(i) di P(li)P(ti) dti
(5)
i=1
The prior probability distribution of biokinetic types l is a discrete probability distribution over 兵l1,l2,. . .,lni其, usually uniform except that the ICRP-recommended default model is given a higher probability. The prior probability distribution for i and ti depends on whether or not a known incident has occurred in the intake time interval ⌬ti. Two cases are considered, an incident reported in the time interval (incident) and no report of an incident (non-incident). Incident The prior probability distribution over intake time P(ti) is assumed to be ) P(ti) = ␦(ti − t(inc) i
(6)
where ␦(.) is the delta function, and t is the known time of the incident. The prior probability distribution over intake amount i is assumed to be a broad lognormal (standard deviation of the log of i equal to 3) with median determined by incident indicators (for example, nose swipe results, air monitor readings) as discussed in Reference 11. (inc) i
Non-incident If no incident has occurred in the intake interval ⌬ti, the prior probability distribution of intake time ti is assumed to be uniform in the interval ⌬ti, and the distribution of intake amount i is assumed to be given by the following (a special case of the gamma distribution), P(i) di =
冉 冊
i ␣i⌬ti i (max) i
␣i⌬ti
(7)
which has been called the ‘alpha distribution’ (11). The specifies the maximum intake allowed parameter (max) i and otherwise is unimportant. The parameter ␣i, which can be interpreted as the ‘intake’ probability per unit time in the ith time interval, is meant to be determined empirically using population averages. Using Los Alamos plutonium historical data from 1980 to the present ␣ was found to be very small, 0.001 y−1 or 192
less (11). The smallness of ␣ shows that the internal dosimetry problem for non-incident-related intakes is a ‘needle-in-the-haystack’ problem of detecting very rare events. In such cases Bayesian methods avoid an inordinate number of false positives. The likelihood function P(Y兩⌶) gives the probability of measuring data values Y given parameters ⌶, considered as a function of ⌶. In this paper it is assumed that the Gaussian approximation for the likelihood function is applicable. In this case ᏸj(⌶) = −
冉
2 1 (yj − (l) j ) + log(2j) 2 2 j
冊
(8)
Here yj is the measurement value, (l) j is the calculated value based on the parameters, in particular the biokinetic type l, and j is the uncertainty standard deviation associated with the jth measurement. The calculated value is given by
冘 N
(l) j =
if(l) (tj − ti)
(9)
i=1
where i is the magnitude of the ith intake, f(l)(t) is the biokinetic retention fraction for biokinetic type l at time t after the intake, and tj and ti are the times of the jth measurement and the ith intake. Note that f(l) (tj − ti) = 0 for tj ⬍ ti. The uncertainty j is composed of measurement uncertainty (m) and a multiplicative factor unj certainty (f) (for example, for a lung count, the j measurement uncertainty would be the counting statistics uncertainty, while the multiplicative factor uncertainty would be the estimated uncertainty of the calibration factor, which is mostly associated with chest wall absorption uncertainty). 2 (f) (l) 2 2j = ((m) j ) + (j j )
(10)
NUMERICAL ALGORITHM Using the Metropolis algorithm (13) a Markov chain of the parameter values ⌶ is generated that has as its stationary distribution the joint posterior distribution (a multivariate distribution, because ⌶ is a vector) of Equation 3 (see Appendix 1) (12). A Markov chain is a sequence of random variables ⌶k such that ⌶k+1 depends on ⌶ and does not depend further on the history of the chain. Given such a chain it is possible to effectively integrate over the posterior distribution by using the relation
冕
1 f(⌶) P (⌶兩Y) d⌶ → Nk
冘 Nk
f(⌶k)
(11)
k=1
for Nk → ⬁, where f(.) is an arbitrary function of ⌶. The three parameters (i,li,ti) of intake i as the ith component of the intake vector ⌶ are lumped together and these components are chain updated one by one. The intake components are selected for updating probabilistically, with probability given by
BAYESIAN INTERNAL DOSIMETRY CALCULATIONS
Pi ⬀ Max(CEDEi, CEDEmin)
(12) th
that is, the attention given to the i component is proportional to the current CEDE associated with the ith intake. However, for CEDEs below the lower limit CEDEmin, all components are given equal attention. The lower limit CEDEmin is usually chosen to be 0.1 mSv (0.01 rem). The components ⌶i are updated using a probabilistic random walk scheme, where with some given probability (a parameter of the code) the new value is selected within a small neighbourhood of the current value (random walk), or, with the complement of that probability, the new value is generated from the entire domain. The chain has a starting value ⌶0 that influences to some extent average values obtained from Equation 11 for finite numbers of trials Nk. The pseudo-random numbers used to generate the chain also have a seed value that determines the sequence. Our approach to convergence of results is to compare results from two chains with different random number seeds, one starting from the minimum allowed value of ⌶ and the other starting from the maximum allowed value. A code validation test case is described in Appendix 2. EXAMPLE USING ACTUAL DATA In Figure 1 are shown actual Los Alamos urine data for 238Pu urine excretion from a single individual over a number of years. The error bars represent plus or minus one standard deviation of the measurement uncertainty. In addition, it is known that this person was involved in an incident on 31 October 1980. The incident classification indicates a relatively low probability of an inhalation intake resulting from the incident. This
case was discussed in Reference 14 as example 3, and the data are available in the file BIOASSAY.333 downloadable from the Los Alamos web site (15) (in the software package BayesII). In interpreting these data, the ‘wing-9 accident’ biokinetic model (9) was used in addition to the six standard ICRP 30 biokinetic models (class W and class Y, 0.2, 1.0, and 5.0 m AMAD particle size). In Figure 2 is shown the urine excretion data together with the calculated expected value. The median of the log-normal prior for the 1980 incident was chosen to be 37 Bq (1 nCi). There is actually only one ‘positive’ intake, using the definition of ‘positive’ P(CEDE ⬎ 1 mSv (0.1 rem)兩data) ⬎ 0.95.
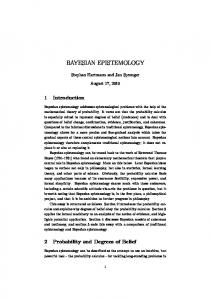
The most probable biokinetic type for this intake is the special wing-9 type (IEE) with 55% probability. In Figure 3 are shown the year-by-year CEDEs lumping together all intakes occurring in a given year. The square symbols represent the magnitude of the expected CEDE for each year while the shaded bars show the 90% credible interval (5% to 95%) for those cases where the upper limit exceeds 1 mSv (0.1 rem). For 1981, the authors do not have confidence that the CEDE exceeds 1 mSv since the lower credible limit does not exceed 1 mSv. The total expected CEDE for all years is 520 mSv (52 rem) with 5% and 95% credible limits of 410 to 620 mSv. The error bars in Figure 2 are larger than those in Figure 1 because they include multiplicative uncertainty in addition to measurement uncertainty. The quantity (f) in Equation 10 was assumed to have the value 0.3, which is the value normally assigned for simulated 24 h urine samples. 16 14
14
12 Urine excretion (mBq.d-1)
12 Urine excretion (mBq.d-1)
(13)
10 8 6 4
10 8 6 4 2
2
0
0
-2
-2
-4
1980
1985
1990
1995
1985
1990
1995
Year
Year
Figure 1. Actual
1980
Figure 2. Urine data (䊏) and calculated expected value (——) of urine excretion.
238
Pu urine excretion data. 193
G. MILLER, H. F. MARTZ, T. T. LITTLE and R. GUILMETTE
In Figure 3 note that in some cases the expected value of CEDE exceeds 1 mSv while the 95% limit does not. This is possible for distributions mostly concentrated at small values but having a tail extending to large values. If the incident information is not used to analyse the data, a very similar year-by-year intake scenario is calculated, as shown in Figure 4. However, when the incident information is not used, no single intake is
‘positive’ (but the sum of all intakes in 1980 is ‘positive’). The prior probability parameter ␣ representing a worker’s intake probability per unit time for non-incident situations was assumed to be 0.001 per year in the foregoing (acute intake situation). If the example data are analysed assuming a value of ␣ 100 times larger (chronic intake situation), the results shown in Figures 5 and 6 are obtained. Many more intakes are now possible, although no individual intake is actually ‘positive’. That is, it seems likely that many intakes have occurred, but it is not possible to identify with certainty the times of these intakes. The total CEDE from all intakes is well determined by the data in all of these cases. For example, Figure 7 shows the result assuming the normal small value of ␣ without using the incident information.
1000
CEDE (mSv)
100
10
DISCUSSION
1
0.1
0.01 1980
1985
1990
1995
Year
Figure 3. Calculated year-by-year expectation value of CEDEs. The shaded bars represent the 90% credible interval (5% to 95%) for those cases where the upper limit exceeds 1 mSv.
The Markov Chain algorithm appears to provide a definitive solution of the inverse problem of internal dosimetry, that of calculating the intake scenario given the bioassay data and an agreed-upon set of biokinetic models. By a definitive solution is meant an exact solution of the problem without simplifying assumptions. The Bayesian method allows the question of interest (‘what is the dose?’) to be addressed directly and the uncertainties to be quantified. The quantitative assessment of uncertainty, which is based on calculation of the probability distribution of intake parameters given 16 14
1000
12 Urine excretion (mBq.d-1)
100
CEDE (mSv)
10
1
10 8 6 4 2
0.1
0 0.01
-2 1980
1985
1990
1995
1980
1985
1990
1995
Year
Year
Figure 4. Calculated year-by-year expectation value of CEDEs when prior information about incident is not used. The shaded bars represent the 90% credible interval (5% to 95%) for those cases where the upper limit exceeds 1 mSv. 194
Figure 5. Urine data (䊏) and calculated expected value (——) of urine excretion when prior probability of intake per unit time 100 times larger than normal is assumed (␣ → 100 ⫻ ␣). Larger ␣ corresponds to a chronic rather than acute intake situation.
BAYESIAN INTERNAL DOSIMETRY CALCULATIONS
the data — an inherently Bayesian entity — is not possible using non-Bayesian methods. Not surprisingly, it is simply not possible to identify the times of intakes with certainty in many cases, although other quantities, such as annual dose or total CEDE are usually relatively well determined by the data. The drawback of this method is that it requires a large
amount of computer time. A rule of thumb for convergence is at least 1 million to 10 million chain iterations per possible intake, which translates to a 1 to 10 hour run for a case such the example discussed here (about 50 possible intakes) using a 1 GHz Pentium processor. Population studies involving thousands of cases, such as those carried out to determine the prior parameter ␣ (11) are then not practical on a desktop workstation. Future plans at Los Alamos include the use of massively parallel supercomputers to carry out such studies.
100
CEDE (mSv)
APPENDIX 1 Markov Chain Monte Carlo using the Metropolis–Hasting Algorithm
10
Suppose statistical inference about a parameter (possibly vector valued) ⌶ is required. The information (or lack of information) about the distribution of ⌶ = 兵1,2,. . .,n其 as P(⌶) (prior distribution) is characterised. Data are collected and represented by the likelihood or P(Y兩⌶). In any Bayesian analysis, inference on the parameters depends on the calculated posterior distribution
1
0.1 1980
1985
1990
1995
Year
Figure 6. Calculated year-by-year expectation value of CEDEs when prior probability of intake 100 times larger is assumed. The shaded bars represent the 90% credible interval (5% to 95%) for those cases where the upper limit exceeds 1 mSv. Many more intakes are now possible, but the intake dates are not identified with certainty.
P(⌶)P(Y兩⌶) 兰⌶ P(⌶)P(Y兩⌶) d⌶
(14)
In many situations, use of the posterior distribution given by Equation 14 requires numerical calculation. Monte Carlo integration evaluates the expectation value of an arbitrary function f(.) of ⌶, E[f(⌶)], by drawing samples 兵⌶k, k = 0,. . .,Nk其 from the posterior distribution and then approximating 1 E[f(⌶)] ⬇ Nk
1.0
冘 Nk
f(⌶k)
(15)
k=0
So the population mean of f(⌶) is estimated by a sample mean. Markov Chain Monte Carlo method is a powerful tool in such cases. The following description of the Metropolis–Hastings algorithm (13,16) closely follows that given in Reference 12. Using the Metropolis–Hastings algorithm, for each state k, the next state ⌶k+1 is chosen by first sampling a candidate point ⌶′ from a proposal distribution q(.兩⌶k). Note that the proposal distribution may depend on the current point ⌶k. The candidate point ⌶′ is then accepted with probability ␣(⌶k,⌶′) where
0.8 Prob (CEDE