Bayesian Joint Modeling of Bone Mineral Density And Repeated Time-To-Fracture Event For Multiscale Bone Systems Model Extension Elodie L. Plan*, Kyle T. Baron, Marc R. Gastonguay, Jonathan L. French, William R. Gillespie, and Matthew M. Riggs Background
Results
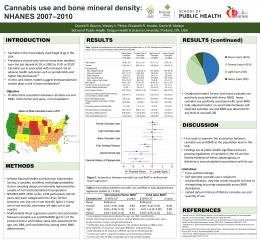
· Physiologically-based multiscale systems (PBMS) model describes cellular mechanisms and bone dynamics in bone-related diseases.[1,2] · Fracture rate considered as most meaningful endpoint affected by disease progression and drug [3] intervention.
Evaluation w.r.t. NHANES data
Objectives To develop a model simultaneously characterizing bone mineral density (BMD) and fracture risk based on time since final menstrual period (FMP).
0
10 20 30 40 50 60
FMPage (yr) : (20,42]
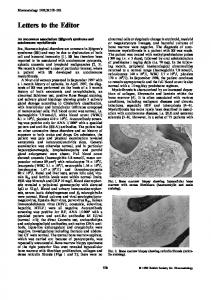
BMD: Retrospective prediction, from examination time to FMP, through fracture time point(s).
FMPage (yr) : (42,64] ●
1.4
●
● ●
●
BMD (g cm2)
●
Structural parameter estimates: b = 0.84, str = −1.66, spo = −0.85, sfi = −0.34 (close to reported literature values[5] ).
1.2
● ●
●
●
●● ● ● ●
●
●
● ●● ● ●
●
●
● ●
● ●
●
● ●●
●
●● ● ●●
● ●●
● ●
● ●
●
● ●
●
● ●
● ● ● ●
● ●
● ●
● ●●
●
● ●● ● ● ● ● ● ●● ● ● ● ● ●● ●● ● ● ● ●● ● ● ● ● ● ● ● ● ● ● ● ● ●● ●●● ●●● ● ● ● ● ● ● ● ●● ● ● ● ● ● ● ● ● ● ● ●● ● ● ● ● ●● ● ● ● ● ● ● ● ● ● ● ●● ● ● ● ●● ● ● ● ●●●●● ● ● ●●●● ●●● ● ● ● ● ● ● ● ● ●● ● ● ●● ● ● ● ● ●●● ● ● ● ● ● ●● ●●● ● ● ● ● ● ● ● ● ●●● ● ● ● ●● ● ● ● ●●●●● ● ● ● ● ● ●●● ● ●● ● ● ●●●● ● ●● ● ● ● ● ● ● ●● ● ● ● ●●● ● ● ● ●●● ● ● ● ● ● ● ● ● ● ●●● ● ● ●● ●● ● ● ● ● ● ● ●●● ● ●● ● ●●● ●●●●● ● ●● ● ● ● ● ● ● ● ● ● ● ● ● ● ● ● ● ●● ● ●● ● ● ●●●● ● ● ●●● ●● ● ●●● ● ● ●●●● ● ● ● ●●● ●● ● ● ● ● ● ● ● ● ●● ● ● ●●● ● ● ●● ● ● ● ●● ●● ● ● ●● ●●● ● ● ●● ●●● ● ● ● ● ● ● ● ● ● ● ● ● ●●● ●●●●● ● ● ● ● ● ●● ● ● ● ● ● ● ● ● ● ●● ● ●● ●● ● ● ● ● ●● ● ● ● ● ● ● ● ● ● ●● ●●● ●● ● ● ●● ● ● ● ● ● ●● ● ●● ● ● ● ● ● ● ● ● ● ●● ● ● ●● ● ●● ● ● ● ● ●
0.8
●
0
●
● ●
●
●
●
● ●
●
● ● ● ● ● ● ● ● ● ● ● ● ● ● ● ●● ●● ● ●●● ●● ●● ● ● ●● ● ● ● ● ● ● ● ● ●● ● ●● ● ● ● ●● ● ● ● ● ● ● ● ●●● ● ● ● ●● ● ● ● ● ● ● ● ●●● ● ● ● ● ● ● ● ● ● ●● ● ●● ●●● ● ●●● ●●● ● ● ● ● ● ● ●● ●● ●● ● ●●●● ● ● ● ● ● ● ● ● ●● ● ● ● ●●●● ● ●● ● ●● ●●● ● ●●●●●● ● ●● ● ● ●●●●●● ● ● ● ●●● ●●●● ● ● ●● ●● ● ●● ●● ● ●● ● ● ● ●●● ● ●● ●● ●● ●● ●● ●●● ●●●● ● ● ● ● ●●●●● ●●● ● ● ● ● ● ● ● ● ● ●● ●●●●● ● ● ●●● ●● ●● ● ●● ● ● ● ● ● ● ● ● ● ● ●●●● ●●● ●●● ● ●● ● ● ●●● ● ● ● ● ● ● ● ● ● ●● ● ● ●●●●● ●●● ● ● ●●● ●● ● ●● ●●● ●● ● ●●●● ●● ● ● ● ● ● ● ●●●● ● ● ●● ●●● ●●● ● ●●●● ●● ● ● ●● ● ●● ●● ● ●●● ●●● ●● ●●● ● ● ● ●●● ●● ● ●●●●● ●● ● ● ● ● ●●● ●● ●● ● ● ● ●●●● ● ● ●●●● ● ● ● ●●●● ● ●●●● ● ● ● ● ●● ●●●● ●●●● ●●●●● ● ●● ●●●●● ●● ● ●●● ● ●● ● ● ● ● ● ● ● ● ● ● ● ● ● ● ● ●●● ●●● ●● ●● ● ●● ● ●● ●● ● ● ●●● ● ●● ● ● ● ● ●● ● ●●● ● ● ● ● ●●● ●● ●●●●● ●● ● ● ●● ●● ●●●● ●●● ● ● ●● ●●● ●● ●●● ●● ●● ●●●● ● ●● ●●●● ●●● ● ●● ● ● ● ● ●●●● ●●●●●●● ● ● ●● ● ● ● ● ● ●● ● ● ● ● ● ● ●● ● ●●●●●●● ●● ● ●●● ● ● ●●● ● ● ●●●● ●● ●● ●● ● ●●●● ● ● ●● ● ●● ●●●● ● ● ● ● ● ● ● ● ● ● ●●●●● ● ● ● ● ● ●● ●●● ● ●●● ● ●● ●● ● ● ● ● ● ●● ●● ● ●●● ● ● ●● ●● ●●●● ● ●●●● ● ● ●● ● ● ●●● ● ●● ● ● ● ● ● ● ●●●● ● ● ●●●●● ● ● ● ● ● ● ● ● ● ● ● ● ● ● ● ● ● ● ● ● ● ● ●● ● ● ●● ●● ● ● ●● ● ● ●● ● ● ● ●● ● ● ● ● ● ● ● ● ● ● ● ● ● ● ● ● ● ●
● ●
● ●● ● ●● ● ● ●
●
●
0.4
Random effect included as residual variability: σ = 0.131 (95% credible interval (CI) 0.127–0.136).
● ●
●●
1.0
●
●
●
0.6
Centered covariate effects added on all parameters.
●
●
●
●
●
●
●
●
10 20 30 40 50 60 Time since FMP (yr)
Fig. 3: Posterior predictive distributions obtained from BMD fit
10
20
30
40
50
0.10
Fracture hazard
0.06
θh ×(1+θBM D ×(BMD(t)−BMD))
θh = −5.5 (95%CI −5.49 – −5.54), θBM D = 1.5 (95%CI 1.49–1.52) h(t) accumulates from t 0 = FMP. ∆DIC(Mconst ant −M var y ing ) = 30
0.02
0.04
(BMD = 0.8 g/cm2 , α = 1)
0.6
0.08
1.0
60
h(t) = e
0.4
0.00
0.2 0.0
Fracture hazard
0.06 0.04 0.02 0.00 0
0.8
Proportion of fracture−free women
0.10 0.08
1.0 0.8 0.6 0.4 0.2 0.0
Proportion of fracture−free women
Fracture risk: Time-varying hazard reflects increase due to time-dependent BMD decline in final model.
0
10
Time since FMP (yr)
20
30
40
50
60
F M Page and time indirect covariates with dynamically predicted BMD vs. direct with observed BMD.
Time since FMP (yr)
Fig. 4: Simulation with constant hazard
Fig. 5: Simulation with final model
Simulation with PBMS model 20
40
60
80
TGF β (%)
Fracture (count)
5
●
4
●
3 ●
1
●
●
●
● ●
BMD (g cm2) : (0.736,1.1]
BMD (g cm2) : (1.1,1.46]
●
● ● ●● ●●
●●
●●●● ● ● ● ●●●
●●● ●
●
●●●●● ● ●● ● ●●●●●●●●●●●●●● ●● ●● ● ●● ● ●●●●● ●● ●●● ●● ●●●●●●●●● ●● ● ●● ●
40
60
●
●
●
●
● ●●
● ● ● ●● ●● ●● ●●● ●●●● ●● ●● ● ●● ●●●● ●● ●●●●●●●●●●●●● ●●● ●●●●●●● ● ●
80
●●●● ●●
20
●
●● ●
● ● ●● ●●●●●●● ●● ●●● ● ●●
40
60
●
80
Age (yr)
250 200
130
150
120 20
40
0.005 0.010 0.015 0.020 0.025 100
60
Fracture hazard
80
Age (yr)
Fig. 6: Estrogen, bone remodeling factors and markers, calcium, BMD and fracture risk time-courses for 100 ♀ with FMP at 50 yr (SD 8) 0
Piecewise BMD model predictions resembled those based on the mechanistic model[2] reflecting the estrogen loss effect on a series of bone markers.
●
●●●●●●●●●●●●●● ●● ●● ●● ●●● ●● ●●●● ●● ●● ●● ●● ● ●● ● ●● ● ●● ● ●● ● ●●● ●● ● ●● ● ●● ● ●● ● ●● ● ●● ● ●● ● ●● ●● ●● ● ●●●●●●●●●●●●●●●●●●●●●●●● ●
0.60 0.65 0.70 0.75 0.80 100
85
0
80
PBMS model extended to reflect changes in expected fracture-free time driven by bone markers.
●●
●●●●●●●●●●●●●●●● ●● ●●●●●●● ●● ●●● ● ●● ●● ●●● ●● ●● ● ●● ● ●● ● ●● ● ●● ● ●● ● ●●●● ●● ●● ●● ●●●●●●●●●●●●●●●●●●●●●●●●●
20
80
60
●
●
2
0
●
60
40
80
Developed model spans several magnitudes in time and space: slow changes in survival can be predicted from more rapid changes in bone markers.
10
BMD (g cm2)
20
30
40
50
60
Survival (probability)
0.0 0.2 0.4 0.6 0.8 1.0
BMD (g cm2) : (0.375,0.736]
40
20
BMD (g cm2)
Value 0.0 0.2 0.4 0.6 0.8 1.0
20
2.26 2.28 2.30 2.32 2.34
· 2005-2008 NHANES demographics, dual energy X-ray absorptiometry, body measures, osteoporosis, and reproductive health datasets. · 1605 postmenopausal ♀ of 63 (95% interpercentiles (IP) 27–85) yr mean age and 45 (95% IP 26–57) yr mean FMP age; 1 femoral neck BMD measure and 0–5 (204 total) fracture events each.
Calcium concentration (mmol)
60
Osteoblasts (%)
110
90
40
[4]
Value
20
Data
100 150 200 250 300 350
Methods
Osteoclasts (%)
40
TGF βactive (%) 140
100
60
95
80 100
Estrogen (%)
Fig. 1: Multiscale bone systems model extension to fracture risk
20
0
10
20
30
40
50 60 Time since FMP (yr)
Fig. 7: BMD and probability to not experience fractures for 100 ♀ with BMD of 0.8 g/cm2 (SD 0.04) at FMP
Fig. 2: Number of fractures since FMP per observed BMD strata
Conclusions
Models
BMD: Piecewise linear model from literature[5] BMD(t) = b + str × t −1,2yr + spo × t 2,5yr + sfi × t 5,∞yr Included covariates: BMI, ethnicity, and F M Pa ge . FractureRrisk: Repeated time-to-event model −(
tj
h(u)du)α
[6,7]
S(t) = e Investigated covariates: observed BMD, BMD(t), F M Pa ge , and time (α6=1, Weibull distribution). t j−1
Software
WinBUGS, BlackBox[8] , R (deSolve, mrgSim).
· Simultaneous modeling of BMD time-course and repeated time-to-fracture events from publicly available data enabled the characterization of the fracture risk in > 1500 postmenopausal ♀. · Next steps include, among others, testing drug effects from previously explored therapeutics, performing external evaluation with estrogen therapy, and including uncertainty in deterministic model. · This model will be made available in the data and model library ™.
References [1] Peterson MC and Riggs MM. Bone, 2010. [2] Riggs MM et al. Measurement and Kinetics of In Vivo Drug Effects: Advances in Simultaneous PKPD Modeling. The Netherlands, 2010. [3] Food and Drug Administration (FDA). Background Document for Meeting of Advisory Committee for Reproductive Health Drugs and Drug Safety and Risk Management Advisory Committee, 2011. [4] Centers for Disease Control and Prevention (CDC). National Center for Health Statistics (NCHS). National Health and Nutrition Examination Survey Data (NHANES).
[5] Greendale GA et al. J Bone Miner Res, 2012. [6] Garnett C & Holford NHG. 5th International Symposium on Measurement and Kinetics of In Vivo Drug Effects. The Netherlands, 2006. [7] Cox EH et al. J Pharmacokinet Biopharm, 1999. [8] BUGSModelLibrary, PKPD Model Library for WinBUGS, Metrum Institute.
*
[email protected]