Bayesian Multivariate Poisson Lognormal Models for Crash Severity Modeling and Site Ranking Jonathan Aguero-Valverde and Paul P. Jovanis safety analysts may arbitrarily choose outcome levels for inclusion in a study (e.g., fatal and injury crashes only). It can be argued that crash counts are fundamentally multivariate in nature because unobservables or omitted variables are shared across levels of crash severity. Crash investigations have commonly found that a difference of mere microseconds may differentiate a crash that causes severe injury from one that causes property damage only (PDO). These small differences in the evolution of crash outcomes lead to the notion that there are potentially strong correlations across outcome levels: correlations that are not recognized when counts are aggregated or when separate models are estimated for each outcome level. Hierarchical Bayesian models have the flexibility to assess this correlation. The purpose of this research is to use properly formulated hierarchical Bayesian models to explore the nature of the correlations across levels of crash-outcome severity and then to assess the implications of these new model formulations in common safety analyses, specifically the identification of sites with promise (SWiPs) (1). Concerning model formulation, separate univariate models of interrelated outcomes (such as crash severity counts) may ignore information shared in those unobservables common to the outcomes. Neglecting to include correlation structures for these multivariate outcomes may distort estimates of variance components and regression coefficients (2) and result in reduced efficiency and possibly biased parameter estimates. In addition, crash counts are frequently characterized by low sample mean values (3) due to the relatively low frequency of crashes. Therefore, crash data often exhibit excess zeroes compared to those expected under a Poisson process (4, 5). Even after adjusting for extra-Poisson variation in the data by including a gamma- or lognormal-distributed random effect term in the model, analysis of data sets with low sample mean values often results in crash frequency estimates with low precision (i.e., high standard deviation). Estimation precision in data sets presenting low sample mean values may benefit by pooling strength in terms of the underlying multivariate distributions (2). This is particularly critical in cases that involve the most severe (but also most infrequent) crashes: those that involve fatalities, major injuries, or incapacitating injuries. Because the final objective of any highway safety analysis is to reduce the frequency and severity of crashes, it follows that obtaining the most precise estimates of crash frequency at the highest severity levels is highly desirable. One of the most important tasks in highway safety analysis is the identification of locations or sites that might be in need of engineering improvements, to reduce the number of crashes. The extensive literature on the subject of identifying SWiPs includes a series of papers by Hauer (1) and Hauer et al. (6, 7). The latest paper in the
Traditionally, highway safety analyses have used univariate Poisson or negative binomial distributions to model crash counts for different levels of crash severity. Because unobservables or omitted variables are shared across severity levels, however, crash counts are multivariate in nature. This research uses full Bayes multivariate Poisson lognormal models to estimate the expected crash frequency for different levels of crash severity and then compares those estimates to independent or univariate Poisson lognormal estimates. The multivariate Poisson lognormal model fits better than the univariate model and improves the precision in crash-frequency estimates. The covariances and correlations among crash severities are high (correlations range from 0.47 to 0.97), with the highest values found between contiguous severity levels. Considering this correlation between severity levels improves the precision of the expected number of crashes. The multivariate estimates are used with cost data from the Pennsylvania Department of Transportation to develop the expected crash cost (and excess expected cost) per segment, which is then used to rank sites for safety improvements. The multivariate-based top-ranked segments are found to have consistently higher costs and excess costs than the univariate estimates, which is due to higher multivariate estimates of fatalities and major injuries (due to the random effects parameter). These higher estimated frequencies, in turn, produce different rankings for the multivariate and independent models. The finding of a high correlation between contiguous severity levels is consistent with some of the literature, but additional tests of multivariate models are recommended. The improved precision has important implications for the identification of sites with promise (SWiPs), because one formulation includes the standard deviation of crash frequencies for similar sites as part of the assessment of SWiPs.
Traditionally, highway safety analyses have used univariate Poisson or negative binomial distributions to model crash counts for different levels of crash severity. The counts are often treated as a whole, combining crashes of different severities of outcome. Alternatively,
J. Aguero-Valverde, Programa de Investigación en Desarrollo Urbano Sostenible, Universidad de Costa Rica, Los Profesores, Calle B, No. 11, Mercedes, San Pedro, San José, 11503, Costa Rica. P. P. Jovanis, Department of Civil and Environmental Engineering and Pennsylvania Transportation Institute, Pennsylvania State University, 212 Sackett Building, University Park, PA 16802-1408. Corresponding author: J. Aguero-Valverde,
[email protected]. Transportation Research Record: Journal of the Transportation Research Board, No. 2136, Transportation Research Board of the National Academies, Washington, D.C., 2009, pp. 82–91. DOI: 10.3141/2136-10
82
Aguero-Valverde and Jovanis
series (7 ) suggests the use of severity-weighted models of crash frequency as the most cost-effective way to select sites for engineering improvements. In addition, Tarko and Kanodia (8) have suggested the use of an “index of crash cost,” which is the sum of the expected cost of the excess crash frequency at each severity level divided by the expected variance of the estimate. In line with these suggestions, this paper discusses the application of multivariate models in the estimation of total expected crash cost and the excess crash cost, while ranking candidate sites for engineering improvements. Note that the approach suggested by Tarko and Kanodia (8) uses an estimate of the variance, highlighting the importance of the variable in safety analyses. In summary, this research seeks to estimate and better understand the implications of correlations that are present across severity of crash outcomes. The specific modeling tool used to conduct this assessment is a full Bayes hierarchical model specifically formulated for this purpose. The approach estimates and compares two sets of models with identical specifications: one set estimated with the assumption of independence across outcomes, the second set with correlations estimated across outcomes as an explicit part of the model formulation (a nonindependence assumption). Both model parameter estimates and their variances are discussed. Finally, these two models are used in the development of SWiPs, highlighting the advantages of using the Bayesian formulation. This paper is organized as follows. First, there is a review of the literature concerning application of hierarchical models to similar safety problems. Next, the statistical methodology is reviewed and the data set is described. The paper concludes with a discussion of results, conclusions, and recommendations for future research.
LITERATURE REVIEW Until recently, crash-frequency models for different severities were estimated using independent univariate Poisson, negative binomial (or Poisson–gamma), and zero-inflated Poisson distributions. Tanaru (9) proposed a multivariate Poisson lognormal model for modeling crash severities at the link level (road sections between two major junctions). Full Bayes hierarchical models were estimated with four levels of severity: fatality or serious injury from crashes involving one vehicle, fatality or serious injury from crashes involving more than one vehicle, slight injury from crashes involving one vehicle, and slight injury from crashes involving more than one vehicle. The expected crash frequency for each severity level was used to produce rankings of sites; therefore, four different rankings were produced. No covariates were included in this analysis. All the entries in the covariance matrix were found to be significantly different from zero, but the author did not report the correlation. Simultaneous negative binomial models of outcomes from crashes involving fatalities or injuries were proposed by Ladrón de Guevara et al. (10) to account for shared omitted variables and measurement errors. The authors were interested in forecasting crashes at the planning level; the unit of study was the traffic analysis zone. The authors found a high and significant correlation (ρ = 0.85) between fatal-crash and injury-crash outcomes. Miaou and Song (11) used Bayesian generalized linear mixed models with multivariate spatial random effects to rank sites by crash cost rate. Three crash severities were analyzed at the county level: fatal, incapacitating injury, and nonincapacitating injury. The authors were mainly interested in ranking criteria and did not discuss correlation structures.
83
Bijleveld (12) proposed a method to estimate the covariances between crash and injury counts from within the accident data, using individual accident information on the relevant outcomes such as the number of victims and fatalities. This method, however, estimates only covariances within an observation and ignores covariances between observations. Song et al. (13) further explored the issue of multivariate spatial models. Instead of analyzing correlated severities, the authors studied correlated crash types: intersection crash, intersection-related crash, driveway-access crash, and nonintersection crash. The authors found that the model with correlated spatial random effects fit the data better than did the model with independent random effects. Although summary statistics of the correlation coefficients between the responses were not provided, plots of the posterior distribution of the coefficients indicated significant correlations ranging from 0.3 to 0.6. Ma and Kockelman (14) used multivariate Poisson regression within a Bayesian framework to estimate the number of victims per road segment in five different severity classes: fatal, disabling injury, nondisabling injury, possible injury, and noninjury. The model did not allow for extra-Poisson variation in the data and restricted the covariances for the five different severity levels to be identical and positive. Park and Lord (15) extended the Bayesian multivariate Poisson specification to include extra-Poisson variation and relaxed the covariance specification to allow for different covariances among severity levels by including a lognormal random effect. The authors analyzed crash counts for three-legged unsignalized intersections and five severity levels: fatal, incapacitating injury, nonincapacitating injury, minor injury, and PDO. The posterior means of the correlation matrix indicated high correlations between different crash severities (from 0.69 to 0.85). Ma et al. (16) also used a Bayesian multivariate Poisson lognormal specification to model crash counts at the road-segment level. However, the correlations found by the authors—ranging from 0.01 to 0.43—were significantly lower than the correlations found in Park and Lord (15). The literature review reveals that several authors have explored the analysis of crash outcomes and crash types in an integrated modeling structure, most often using hierarchical Bayes approaches. However, these analyses stopped short of quantifying the effect of those multivariate structures on the precision of the estimates of crash frequency and the implications of those estimation differences on the safety analyses used as examples in those analyses. This research conducts those studies, building on this aforementioned foundational literature.
METHODOLOGY Full Bayesian methods have been gaining popularity as the approach of choice when modeling multiple levels and incorporating random effects or complicated dependence structures, such as correlated errors (17). Around 1990, the “Markov chain Monte Carlo revolution” took place, when methods like the Gibbs sampler and the Metropolis algorithm were coupled with faster computing to enable evaluation of the complicated integrals that are usually found in Bayesian methods. Markov chain Monte Carlo, also known as Markov chain simulation, is a general method based on drawing values of the parameters of interest from approximate distributions and then correcting those draws to better approximate the target posterior distribution (18). Details about Markov chain simulations are beyond the scope of
84
Transportation Research Record 2136
this paper; interested readers can refer to Gelman et al. (18) and Congdon (19) for more on this topic. For the full Bayes multivariate Poisson lognormal models assessed in this research, the response variable is the number of persons injured by severity level. In this analysis, the count of crashes is used for PDO crashes since that type of crash does not involve injuries. The number of persons injured is Poisson distributed: yijt ~ Poisson ( θijt )
where
Σ−1 = symmetric positive definite matrix (also known as the precision matrix), R = scale matrix = ⎡ 0.1 ⎢ 0.005 ⎢ 0.005 ⎢ ⎢ 0.005 ⎢⎣ 0.005
(1)
where yijt is the observed number of persons injured in segment i of the severity type j at time t (in years), and θijt is the expected Poisson rate for segment i of the severity type j at time t. The Poisson rate is modeled as a function of the covariates following a lognormal distribution, as shown is Equation 2: K
log ( θijt ) = β 0 j + ∑ β jk X ijtk + vij
(2)
k =1
0.005 0.1 0.005 0.005 0.005
0.005 0.005 0.1 0.005 0.005
0.005 0.005 0.005 0..1 0.005
0.005 ⎤ 0.0 005 ⎥ 0.005 ⎥⎥ 0.005 ⎥ 0.1 ⎥⎦
and n = degrees of freedom = 5. The values of R and n were recommended by Gelman et al. (18) and Carlin and Louis (20) to produce a noninformative prior for the precision matrix, analogous to the noninformative gamma distribution for the prior of the univariate precision shown in Equation 5. When sites are ranked, the cost of the crash can be used. Two indexes are used: total crash cost and excess crash cost. Total crash cost is defined by 5
where β0j = intercept for severity j, βjk = coefficient for k covariate and severity j, Xijtk = value of the k covariate for segment i of the severity type j at time t, and vij = random effects for each severity type. These random effects capture the extra-Poisson heterogeneity among segments. At the second stage, the coefficients (βjk), including the intercepts, are modeled by using noninformative normal priors: βjk ~ N ( 0, 1000 )
cost it = ∑ cost j θijt
(8)
j =1
where costj is the cost associated with an injury of severity type j. Excess crash cost is defined by 5
δ − cost it = ∑ cost j δ ijt
(9)
j =1
where δijt is the expected excess injury frequency for segment i of the severity type j at time t, defined as [Aguero-Valverde and Jovanis (21)]:
(3) K
Now it can be assumed that the random effects for each severity type are independent and therefore have the following prior distributions: vij ~ N ( 0, τ −j 1 )
j = 1, . . . , 5
(4)
δ ijt = e
β0 j +
∑ β jk Xijtk
k =1
(e
vi
− 1)
(10)
DATA DESCRIPTION
with a mean of 10 and a variance of 10,000. This specification is equivalent to the univariate Poisson lognormal specification for each severity level, but it offers the advantage of being directly comparable with the multivariate specification. For the multivariate model, correlated priors in the random effects vector are estimated using multivariate normal priors (15, 16):
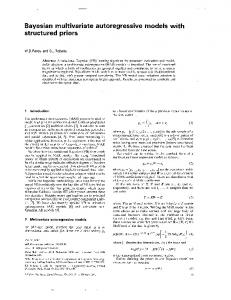
The crash data for the models were aggregated by year at the road segment level and for state-maintained rural two-lane roads within District 2-0 of the Pennsylvania Department of Transportation (PennDOT). Figure 1 is a map of the District 2-0, including all statemaintained roads and rural two-lane roads in that region. The analysis included a total of 6,353 rural two-lane segments. Average crash cost data for the five levels of outcome severity used by PennDOT (for all of Pennsylvania) were obtained from the 2006 Pennsylvania Crash Facts and Statistics Book (22). A relational database was assembled with information from two different data sources: crash data and road inventory. All data were collected for calendar years 2003 to 2006.
v i ~ MN ( μ i , Σ )
Crash Data
where τj is the inverse of the variance (also known as precision). The precision has a gamma prior: τ j ~ gamma ( 0.01, 0.001)
j = 1, . . . , 5
(5)
(6)
where µi is a vector of zeroes µi = (0, 0, 0, 0, 0) and Σ is the variance– covariance matrix with a hyperprior defined by
∑
−1
~ Wishart ( R, n )
(7)
Crash data were obtained from the PennDOT Crash Reporting System. The data includes reportable crashes for road-segment locations only (i.e., those segments that do not include an intersection or ramp junction). Five severity levels are coded into the data: deaths, major injuries, moderate injuries, minor injuries, and PDO.
Aguero-Valverde and Jovanis
FIGURE 1
85
PennDOT District 2-0 roads.
A special location code was created for each crash by concatenating the county, route, and segment numbers in a single variable, creating a unique location identification for each road segment. Then crashes were summarized by location code and year.
Road Inventory Road data were obtained from the Pennsylvania Road Management System (RMS) for the study period. The Pennsylvania RMS includes data for each road segment such as county code (each county in Pennsylvania has a unique numeric identification code), State route number, road-segment number and length, average daily traffic (ADT), lane width, travel lane count, posted speed limit, and functional class. These data were joined with a digital map of roads in the state, obtained from Pennsylvania State University (23), which allowed researchers to map crash locations. Summary statistics for the data are shown in Table 1.
RESULTS Models were estimated using the open source software OpenBUGS (24). For the models, 1,000 iterations were discarded as burn-in, and the 20,000 iterations that followed were used to obtain summary statistics of the posterior distribution of parameters. Convergence was
assessed by visual inspection of the Markov chains for the parameters. Furthermore, the number of iterations was selected so that the Monte Carlo error for each parameter in the model would be less than 10% of the value of the standard deviation of that parameter. Table 2 presents the estimates for the independent and multivariate Poisson lognormal random effects models. Because the issue of primary interest is the differences and similarities between the two different modeling approaches, the following discussion of model fit and coefficient significance is focused in this direction. The goodness-of-fit measures commonly used in full Bayesian statistics are presented in the table: the posterior mean of the deviance and the deviance information criterion (DIC) (25). The deviance is estimated in the same way for frequentist and Bayesian statistics while the DIC is the Bayesian equivalent of the Akaike information criterion. As in the case of their frequentist counterparts, the deviance and the DIC quantify the relative goodness-of-fit of the models; therefore, they are useful for comparing models. In comparing the overall fit of the two models, it is clear from the summary statistics (which appear just after the PDO model table at the bottom of the right-hand column in Table 2) that the multivariate model better fits the data, as measured by the DIC. Although the multivariate model has a DIC more than 500 points lower than the independent model’s DIC, the multivariate model’s posterior deviance (Dbar) is only 57 points higher than that with the independent model. Furthermore, once the correlated random effects are included in the model, the effective number of parameters (pD) drops significantly,
86
TABLE 1
Transportation Research Record 2136
Summary Statistics of the Data by Segment and Year
Variable
Mean
SE
Min.
Max.
Deaths Major injuries Moderate injuries Minor injuries PDO crashes Average daily traffic (ADT) Length (mi) Lane width