Today's environmental engineer faces many uncertainties in designing systems to address environmental con- cerns. Uncertainties arising from a lack of ...
F E A T U R E
Bayesian Statistics in Environmental Engineering Planning James D. Englehardt, P.E., and Ted W. Simon
Tin designing systems to address environmental conoday’s environmental engineer faces many uncertainties
cerns. Uncertainties arising from a lack of information may range from population forecasts to the projected benefits of technologies designed to reduce global warming impacts to remedial levels for hazardous waste posing the RIGOROUS ASSESSMENT OF RISK BASED least amount of risk. Variabilities include such parameters as wastewater flows and concentrations. Quantitative asON THE INFORMATION AVAILABLE. sessments of uncertainty and variability using such methods as Bayesian statistics are more convincing than those using rules of thumb and other, less-formal arguments. While quantitative analysis cannot replace hard choices, quantitative methods should be able to exploit limited information and indicate the information content of the result. For example, suppose we know that John will carry his umbrella if it is raining. Also, we know that John is carrying his umbrella. What can we say about whether it is raining? Most reasonable people would suppose that it might be raining if John is carrying his umbrella. That is, although we cannot conclude that it is raining, we can infer that it is likely to be raining. Traditional statistical methods cannot be used in such situations, where numerical data are limited. The idea of rigorously inferring a conclusion from incomplete evidence dates back to an essay by the Reverend Thomas Bayes that was first published in 1764. Pierre-Simon Laplace conceived the idea independently and advanced it later in that century. It was not until the 20th century, however, that Bayesian inference found application in engineering. Engineering applications of Bayesian methods have for the most part been confined to probabilistic risk asJames D. Englehardt is an associate sessment, particularly in nuclear safety studies following the 1979 Three Mile professor at the University of Miami in Island nuclear disaster. Today, risk assessments are used in all fields of engiCoral Gables, Florida. Ted W. Simon is a neering, and Bayesian methods are attracting interest. Bayesian methods make toxicologist in Atlanta with Region 4 of it possible to formally incorporate professional judgment into risk assessments. the U.S. Environmental Protection Predictive Bayesian methods allow rigorously conservative risk assessments Agency. This work was produced by the sec based on limited information, with the assessments becoming progressively ond author in his private capacity. It has less conservative as more information becomes available.
BAYESIAN INFERENCE CAN PROVIDE A
not undergone administrative review and does not reflect the opinions or policies of the U.S. Environmental Pro tection Agency or any other agency of the federal government.
INFORMATION-RESPONSIVE
PROBABILITY DISTRIBUTIONS
A traditional probability distribution can be obtained only if there are more than, say, 30 data points available. Then, the form of the probability JOURNAL OF MANAGEMENT IN ENGINEERING / SEPTEMBER/OCTOBER 2000 / 21
F E A T U R E
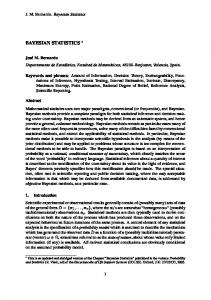
distribution (for example, normal) and the parameters tribution describing available information concerning of the distribution (for example, mean and standard grades based on the five available grades (labeled deviation) can be found. If more data become availBayesian, 5 data). The distribution is broader than the able, the parameters of the distribution can be revised. normal, reflecting the uncertainty in parameters caused However, the distribution will not change shape signifby the lack of information. icantly or progressively to indicate the higher level of If subjective information regarding the parameter information. values can be brought to bear on the problem, it too can Bayesian inference is also known as inverse probabilbe expressed in the form of prior probability distribuity, because it is a formal approach for inferring the distions and integrated into the final probability distributribution from which limited data have come. If no data tion. Figure 1 shows the distribution reflecting the five are available, the resulting distribution depends solely on available grades, as well as a low-to-moderate level of the analyst’s professional judgment. If limited data are subjective information on the average and standard deavailable, they can be integrated rigorously with the anaviation of the grades that agrees with the data lyst’s subjective professional judgment as a basis for deci(“Bayesian, 5 data and subjective information”). Howevsion or inference. Predictive Bayesian methods produce er, someone familiar with the grading policy may estidistributions that evolve in shape in response to informamate that the standard deviation of the grade distribution, aptly indicating a higher risk when information is tion would be closer to 10 than to the value of 6 indicatless available. Bayesian methods, therefore, offer a way ed by the five available grades. In that case, the analyst to find the probability that an outcome or outcomes will may express low-to-moderate confidence that the stanoccur again, even for new processes and policies and for dard deviation for all student grades is 10, as is also rare events. shown in figure 1 (“Bayesian, 5 data and contradictory The basic Bayesian approach is useful if there is a subjective information”). theoretical or empirical reason that a particular probaAlthough risk can be measured in many ways, a prebility distribution will apply to the variable of interest. dictive Bayesian distribution based on limited informaFor example, student grades may tend to be normally tion generally represents a conservative risk estimate. distributed. If only 5 grades are known out of a class of That is, assessed risk is generally higher if less is known, 50, a traditional probability distribution cannot be obbecause the distributions have more weight in the tails. tained. However, a predictive Bayesian distribution can For example, in figure 1 prior to complete information on be obtained. This will be broader than the normal distribution and will narrow progressively as knowledge of more grades is obtained and included. If the five grades average 83 percent with a standard deviation of 6 percent, the normal distribution will be as shown in figure 1. This distribution is not valid for five data points because the mean and standard deviation are insufficiently known. The Bayesian assessor says that if not enough data are available to assess the mean and standard deviation of a normal distribution, at least probability distributions can be assigned to the parameters themselves. If the uncertainty described by the distributions of the mean and standard deviation is integrated into the normal distribution, a broader distribution is obtained, one that expresses the analyst’s subjective knowledge in an objective way. Information theory supports the idea that the most objective distribution will be the broadest one that fits the available data. FIG 1. PREDICTIVE BAYESIAN GRADE DISTRIBUTIONS TAKE THESE FORMS GIVEN Figure 1 shows the predictive Bayesian dis- DIFFERENT LEVELS OF DATA AND SUBJECTIVE INFORMATION. 22 / JOURNAL OF MANAGEMENT IN ENGINEERING / SEPTEMBER/OCTOBER 2000
F E A T U R E
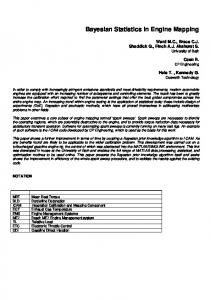
approach is needed. Two examples where Bayesian analysis allowed cumulative losses to be assessed involved evaluation of proposed revisions to the South Florida Building Codeafter Hurricane Andrew and the development of a model to predict oil spill consequences deriving from proposed changes in the oil transportation network in the Gulf of Mexico. In both cases historical data were available on the frequency and sizes FIG 2. THIS MAP OF THE GULF OF MEXICO SHOWS NUMBERED SHORELINE SEGMENTS FOR WHICH of past incidents (hurriOIL SPILL IMPACTS HAVE BEEN ASSESSED USING THE BAYESIAN OIL SPILL RISK ASSESSMENT MODEL canes and oil spills). HowOSHEAM. ever, data reflecting the proposed risk-reduction changes were not. Bayesian analysis of the proposed revithe grades assigned, there is a higher assessed risk of a sions to the South Florida Building Codeindicated that the student receiving a low grade. stricter code was justified on purely economic grounds, even before considering the avoidance of deaths and hurriASSESSING LOSSES OVER A FUTURE PERIOD cane traumas. Environmental engineers are often concerned with preThe Oil Spill Hazard and Exposure Assessment venting environmental and monetary losses. Many losses, Model (OSHEAM), which was developed for the U.S. such as oil spill damages, occur in random episodes. Coast Guard, contains information on oil tanker routes, Random discrete losses can be predicted probabilistically using the predictive Bayesian compound Poisson model. The apOIL SPILL IMPACTS IN THE GULF OF MEXICO AS PREDICTED BY THE OSHEAM proach takes advantage of the fact that the number of times a loss will Shoreline Mean Shoreline Mean Shoreline Mean Shoreline Mean be experienced over a Segment (100 bbl) Segment (100 bbl) Segment (100 bbl) Segment (100 bbl) planning period has a Poisson distribution, 1.00 8.56 15.00 16.15 29.00 45.24 43.00 11.82 known from theory. 2.00 8.25 16.00 39.99 30.00 27.53 44.00 16.85 The sizes of individual 3.00 13.54 17.00 32.25 31.00 23.15 45.00 9.91 losses often have a 4.00 13.31 18.00 19.02 32.00 11.13 46.00 11.62 Pareto distribution, also 5.00 15.75 19.00 37.30 33.00 10.00 47.00 4.35 known from theory and 6.00 19.18 20.00 8.47 34.00 5.47 48.00 7.12 experience. However, it 7.00 24.20 21.00 3.76 35.00 4.93 49.00 9.00 is often desired to pre8.00 34.97 22.00 2.70 36.00 5.00 50.00 7.70 dict risks associated 9.00 33.14 23.00 4.80 37.00 6.80 51.00 5.11 with a new process or 10.00 47.78 24.00 8.18 38.00 5.22 52.00 1.61 policy for which data 11.00 35.66 25.00 5.22 39.00 6.18 53.00 1.88 are not available to 12.00 50.54 26.00 5.22 40.00 6.27 55.00 10.76 13.00 34.74 27.00 8.09 41.00 7.54 specify the parameters 14.00 28.28 28.00 6.67 42.00 6.97 of the distributions. In these cases a Bayesian JOURNAL OF MANAGEMENT IN ENGINEERING / SEPTEMBER/OCTOBER 2000 / 23
F E A T U R E
pipelines, and platforms throughout the Gulf of Mexico, along with oil volumes transported annually and oil spill transport modeling results developed by the Minerals Management Service (MMS). The model accepts data from the Marine Spill Information System (MSIS) database, which is maintained by the National Response Center. Analysts can enter subjective estimates of reductions in oil spill sizes and frequencies expected from proposed procedural changes, as well as their level of confidence in the estimates. For example, to evaluate the use of a new coupling for loading and off-loading, the assessor may estimate a 20 percent reduction in the number of spills, with low confidence. All such input is specified for appropriate one-degree longitude by onedegree latitude grid cells across the Gulf of Mexico or for particular tanker routes, pipelines, or platforms. The model integrates this information with historical data for each grid cell, transportation network characteristics, and oil spill transport probabilities from each grid cell to each shoreline segment and computes onshore oil spill volumes. Oil spill volumes predicted to affect 53 shoreline segments defined by the MMS (figure 2) in a preliminary example analysis are shown in the accompanying table. The reasons for the relatively high oil spill impacts along portions of the Florida panhandle are not yet known.
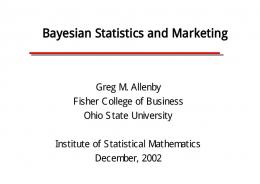
*Assumes that a laboratory-related environmental liability, of average size $10 million, is a 100-year event, with low confidence. **Ten-year costs for which there is a 5 percent probability of exceedance.
FIG. 3. THE 10-YEAR
TANGIBLE COST, EXPECTED TOTAL
COST OF TANGIBLES AND INTANGIBLES , AND INTERNAL ANALYSIS, THE CURRENT
EVALUATING
SUSTAINABILITY
Management policies and technical processes proposed to reduce environmental impacts and costs can have randomly occurring benefits and costs over a planning period. If the environmental damage that has been avoided can be expressed in monetary terms, then the predictive Bayesian compound Poisson model can be used to predict the net present value (NPV) of the proposed policy or process over an appropriate planning period. If the assessment considers the broad array of environmental and monetary benefits and costs, along with resource depletion, and fairly assigns value to future benefits, it may then become an assessment of sustainability. An example of a predictive Bayesian sustainability analysis is the one conducted for the South Florida Water Management District. The district is responsible for a large part of the current effort to restore the Everglades. To support this effort, along with other water management activities, the district operates a chemical analysis laboratory. In 1997, when the study was carried out, approximately 50 percent of the water analyses were performed internally, with the balance contracted to private and other government laboratories. The district’s governing board requested an evaluation of the economic desirability of other arrangements, including conducting all
5 PERCENT 100 PERCENT DISTRIBUTION, AND 100
EXCEEDANCE TOTAL COST ARE SHOWN FOR PERCENT CONTRACT ANALYSIS.
analyses by external contract. In addition to tangible benefits and costs, intangible liabilities were of concern to the district. Closing the laboratory could eliminate liabilities associated with workers’ compensation claims, which were self-insured by the district. Of greater significance, however, was that additional legal liabilities associated with Everglades restoration could be incurred as a result of the lack of in-house chemical analysis expertise and the lack of access to laboratory analysts by restoration project managers. It was assumed that a quality assurance (QA) program would continue to maintain the quality of chemical analyses. However, projected increases in turnaround time, a lower level of institutional expertise, and reduced access to laboratory analysts by project managers were seen as increasing the risk of legal environmental settlements against the district. Expert testimony during legal proceedings has focused on establishing the technical credibility of laboratory personnel. Knowledge of and familiarity with data and analysis procedures would presumably be more difficult to establish if the district’s laboratory were closed. Intangible costs were assessed as follows. An estimate of $10 million for any potential legal liability was de-
24 / JOURNAL OF MANAGEMENT IN ENGINEERING / SEPTEMBER/OCTOBER 2000
F E A T U R E
termined based on current research and restoration costs. This value was used to specify a predictive Bayesian probability distribution for the size of any single liability. The frequency of such liabilities was more uncertain and more difficult to evaluate. In the analysis, the average frequency of occurrence of additional liabilities related to lab closure was assumed to vary from once in 10 years to once in 1,000 years. That is, a settlement of $10 million average size, which could have been avoided as a result of in-house chemical analysis experience and expertise, was considered to be, respectively, a 1,000year, 100-year, and 10-year event to perform a sensitivity analysis on the estimate of the frequency of liabilities. Assessed costs and economic risks from the perspective of the district are summarized in figure 3. The analysis indicated that, even for a 100-year return period for lab-related environmental liabilities, the expected total cost was lowest for the existing arrangement. Economic risk was described by a loss function that included the cost of running the lab, the cost of supplemental contract work, and the cost of any incurred liabilities. Risk was greatest when all the analytical work was performed under a contract arrangement. ASSESSING
UNCERTAIN EXPOSURE
concentrations for a generalized grid of facilities separated by an average of 405 m, based on dry cleaner locations in Miami, are shown in figure 4. VALUE-OF-INFORMATION
TECHNIQUES
Remedial decisions at Superfund sites and other hazardous waste facilities are determined by a baseline risk assessment, part of the remedial process mandated by the National Contingency Plan for Oil and Hazardous Substance, the Superfund law. Risk is most often determined as the result of a model with single values for inputs and a single risk value for an output, with little or no attempt by the risk assessor to acknowledge or estimate uncertainty. When assessing risks from contaminated soil, the concentration term is often the most uncertain. At many sites samples are taken from the most contaminated areas only. A hypothetical receptor in a risk assessment will probably not move about the site in a pattern similar to the one used for environmental sampling. The easiest assumption regarding movements is that this hypothetical receptor moves about the site at random and contacts all areas equally. The receptor does not contact or “sample” the environmental medium in the same temporal or spatial distribution as the environmental sampling team, and this lack of correspondence is a source of uncertainty. The correspondence between the receptor’s concentration and that determined by sampling and analysis is a function of both the completeness of site characterization
Previous examples have described the use of Bayesian methods to account for uncertainty deriving from information limitations in risk assessments. However, natural variability can be accounted for as well. For example, Gaussian plume air quality models are widely used to predict air concentrations. The models account for turbulence over periods of a few minutes or, under constant weather conditions, up to one hour. An analytical, predictive Bayesian version of the basic Gaussian plume model can be used to account for longer-term variability in wind speed, direction, and turbulence. The model is a stochastic Gaussian plume air quality model of chronic concentrations that can accept real-time or historical data to obtain revised concentration estimates for a particular time period of interest. Studies carried out in Miami of the ambient concentrations of perchloroethylene surrounding dry cleaners and of tire particulates in residential areas near roadways were assessed using the predictive FIG. 4. AMBIENT PERCHLOROETHYLENE CONCENTRATIONS ARE SHOWN SURROUNDING Bayesian model just mentioned. The DRY CLEANERS HAVING THE AVERAGE SPACING AND PERCHLOROETHYLENE CONSUMPTION predicted average perchloroethylene FOUND IN MIAMI IN 1995.
JOURNAL OF MANAGEMENT IN ENGINEERING / SEPTEMBER/OCTOBER 2000 / 25
F E A T U R E
and the behavior of the receptor. Lack of knowledge inherent in both factors accounts for the irreducible uncertainty in the concentration term. An exposure unit is the area contacted by a receptor within the time frame of interest. When soil contamination is unevenly distributed within an exposure unit and receptors move freely over time and contact soil at random, the chronic average intake of chemical tends to converge to the spatially weighted average—the receptors are eventually exposed to the same areas for the same amount of time. Environmental sample locations that determine the nature and extent of contamination may not be ideal or even appropriate to characterize the long-term average soil concentration a receptor contacts. Because the average soil concentration in an exposure unit is the appropriate concentration term, environmental samples from the most contaminated areas of the site only will tend to skew the concentration term and the estimated risk upward. The risk assessment may suggest a level of remediation for the site that is excessively conservative. Bayesian methods and value-of-information (VOI) techniques can be used to assess the value of obtaining more soil samples to reduce the uncertainty in the concentration term. This can be done by specifying a loss function. Put in words, a loss function expresses the lack of utility (often expressed in monetary terms) of a particular decision given a particular situation. A loss function that combines the costs of overremediation or underremediation is used to assess the expected value of information (EVOI). To determine the level of remediation, one defines the range of possible actions and evaluates the loss function associated with each decision. This approach has been pioneered by Maxine E. Dakins of the University of Idaho and Mitchell Small of Carnegie-Mellon University. Let’s consider the cleanup of a transformer dump site in a VOI framework. Several parts of the site are heavily contaminated with polychlorinated biphenyls (PCBs). PCBs tend to adsorb to soil and do not migrate. Hence, even though the site is old, PCBs are found in a patchy spatial distribution in site soils. The site occupies 20 acres. PCBs are found only in surface soil. A bulldozer used for site remediation cannot remove less than 2 ft of soil. Excavating a cubic yard of contaminated soil and disposing of it costs $500. Hence, remediating the entire site would cost $32.67 million. A residential developer wishes to purchase the site and has offered $20 million, but only if the site can be cleaned up to residential standards. AR is the area of the site to be remediated, and A C is the correct but unknown area to be remediated. The approximate loss function is given by
L(A R |AC) = $500AR – $20 million
AR
L(A R |AC) = $500A R + $20 million
AR < A C
AC
where L(A R |A C) is the loss based on A R given A C. If enough soil is removed to restore the site to residential use, the loss function will be the difference between the cost of remediation and the proceeds from the sale of the land. If the site is underremediated, the loss function will be the cost of remediation plus the cost of losing the sale. Using the loss function, the value of each environmental sample can be assessed. Of course one wishes to collect the samples that will minimize the loss function. The loss function shown above is quite simple. One could also incorporate the costs of sampling and analysis. When additional sampling is proposed, the expected value of sample information (EVSI) can be determined using the appropriate loss function. Field analytical techniques for PCBs have been developed. These techniques use immunological methods that are more uncertain than conventional laboratory analysis. These methods are, however, much less costly. Field analysis enables an engineer to decide whether to remediate portions of the site while still in the field. Ideally, one could surmise that a mix of conventional analyses and field analyses would minimize the loss function. One can incorporate the value of many additional field samples versus the uncertainty associated with those samples into the loss function and determine the optimum strategy. At hazardous waste sites there are expected losses for both excessive and insufficient conservatism. Defining a loss function makes the penalties for any decision explicit and enables decision makers to balance competing penalties and arrive at the optimal remedial decision. THE
FUTURE OF
BAYESIAN
METHODS
Developed primarily during the latter half of the 20th century, Bayesian methods are still finding their way into engineering applications. With regulatory emphasis on risk increasing, along with the political will to reduce the cost of environmental protection, Bayesian methods are expected to see wider use. They will allow assessment of risks for new and untested processes and policies. In addition, they can provide the basis for streamlined and data-responsive stochastic analyses of exposure factors, ambient pollutant concentrations, and any other quantity of interest that can be expressed in terms of its probability. The great utility of these methods has not yet been fully tapped in the field of environmental engineering.
26 / JOURNAL OF MANAGEMENT IN ENGINEERING / SEPTEMBER/OCTOBER 2000