Hindawi Publishing Corporation Shock and Vibration Volume 2016, Article ID 4805383, 13 pages http://dx.doi.org/10.1155/2016/4805383
Research Article Bearing Fault Diagnosis Using a Novel Classifier Ensemble Based on Lifting Wavelet Packet Transforms and Sample Entropy Lei Zhang, Long Zhang, Junfeng Hu, and Guoliang Xiong School of Mechatronics Engineering, East China Jiaotong University, Nanchang 330013, China Correspondence should be addressed to Long Zhang;
[email protected] Received 21 October 2015; Revised 25 January 2016; Accepted 27 January 2016 Academic Editor: Konstantinos N. Gyftakis Copyright © 2016 Lei Zhang et al. This is an open access article distributed under the Creative Commons Attribution License, which permits unrestricted use, distribution, and reproduction in any medium, provided the original work is properly cited. In order to improve the fault detection accuracy for rolling bearings, an automated fault diagnosis system is presented based on lifting wavelet packet transform (LWPT), sample entropy (SampEn), and classifier ensemble. Bearing vibration signals are firstly decomposed into different frequency subbands through a three-level LWPT, resulting in a total of 8 frequency-band signals throughout the third layers of the LWPT decomposition tree. The SampEns of all the 8 components are then calculated as feature vectors. Such a feature extraction paradigm is expected to depict complexity, irregularity, and nonstationarity of bearing vibrations. Moreover, a novel classifier ensemble is proposed to alleviate the effect of initial parameters on the performance of member classifiers and to improve classification effectiveness. Experiments were conducted on electric motor bearings considering various set of fault categories and fault severity levels. Experimental results demonstrate the proposed diagnosis system can effectively improve bearing fault recognition accuracy and stability in comparison with diagnosis methods based on a single classifier.
1. Introduction Rolling element bearings are among the most critical components in various machines, and their faults are the main causes of breakdowns in rotating machinery. It was reported that rolling bearing faults accommodate 45–55% of asynchronous motor failures. A variety of fault diagnosis methods have been developed and exploited effectively to detect bearing faults at an early stage for the purpose of keeping machinery performing at its best and avoid unplanned downtime and economical loss. In order for the large machines used in current industry to operate in a safe and efficient mode, a number of sensors of which the number might be up to several thousands are employed to collect dynamical signals [1, 2]. The amount of signals to be processed is such vast that it must resort to automated fault diagnosis systems instead of manual analysis. Vibrations emitted from industry machinery like asynchronous motors usually contain signatures of multiple resources and are affected by operation parameters including speed and load. Accordingly, bearing fault diagnosis is not a trivial task in terms of signal
processing and fault identification. As an antecedent step of machine prognostics and health management (PHM), it needs to not only find the faulty bearings but also locate faulty components, as different fault location follows different fault development mode. As such, the objective of the present work is to identify bearing health condition and locate faulty bearing components with emphases on feature extraction and faulty component recognition. When local faults such as cracks, pitting, and indentions occur to bearings, the fault signature is represented by repeating impulses in vibrations. The interval and intensity of impulses vary with speed or load fluctuation and slipping between bearing parts. As such, bearing vibrations could be considered to be nonstationary. Various methods have been employed to deal with the nonstationary characteristics of vibration signals for fault diagnosis of rolling bearings [3, 4]. For nonstationary signals, it is desired to examine how their energies vary with time and frequency. Such a demand impels the development of time-frequency or timescale signal processing methods, among which wavelet packet transform (WPT) has proven effective in feature extraction
2 and been exploited for fault diagnosis of rolling bearings [5]. Selection of wavelet basis has a significant effect on the results of wavelet transform. During the past decades, many methods for constructing wavelet basis have been proposed, providing a rich variety of wavelet function for fault diagnosis in practice. These traditional wavelet functions were normally constructed by Fourier transform in the frequency domain, and hence the traditional wavelet transform was also known as the first-generation wavelet transform [6]. The WPT of a vibration signal results in a set of frequency-band signals locating in independent frequency bands by means of orthogonal or biorthogonal wavelet packet basis. The frequencyband signals are multiscale representation of original signals and able to highlight the information related to health condition of machinery. As frequency-band signals have the same length as original signal, it is therefore necessary to extract some features to represent each frequency-band signal and eventually result in a feature vector of original signals. The energies of each frequency-band signal at the bottom layer of the WPT decomposition tree are extracted as feature vector to depict bearing vibrations in [7]. Reference [8] extracts the standard deviations (STD) of the WPT coefficients as features for gear vibrations, where the experimental results indicate the STD can lead the neural networks to converge more rapidly than the aforementioned energy features. Although feature extraction methods based on WPT preprocessing have reported considerable success in those works, more attention is deserved to be paid on the nonlinear information due to factors such as discontinuous stiffness, damping, surface friction, and impacts in defective bearings. The nonlinearity enriched by the presence of faults will render the traditional extraction methods based on the assumption of linear system less effective [9]. As such, it is important to extract nonlinear features for bearing fault diagnosis. With the development of the nonlinear theory, a lot of nonlinear dynamic parameters have found applications in fault diagnosis. Those nonlinear dynamic parameters, taking fractal dimension (FrD), for example, effectively describe the irregularity and complexity of the vibration signals and reflect the change in mechanical systems’ health condition. Reference [10] decomposes vibration signals by WPT and utilizes FrD as a parameter to depict the irregularity and complexity of each frequency-band signal. The combined use of WPT and FrD can characterize not only the nonstationarity but also the irregularity and complexity of vibration signals. In order to further improve the application of the WPT and nonlinear dynamic parameters, two items deserve more attention. On the one hand, the aforementioned feature extraction methods are all based on the first-generation wavelet packet transform preprocessing. However, WPT has limited number of wavelet functions and the adaptive construction of wavelet basis is difficult in practice. Lifting wavelet packet transform (LWPT) proposed by Sweldens, also known as the second-generation wavelet packet transform, is an alternative scheme for building wavelet function which was constructed by means of the lifting scheme. The wavelet function construction is no longer based on Fourier transform but is obtained completely in time domain [11]. Lifting wavelet packet transform therefore has a deal of
Shock and Vibration merits over the traditional WPT, including the flexibility of wavelet function construction and less computational effort and memory. As such, the LWPT is positively appreciated in mechanical fault diagnosis. On the other hand, the calculation of some nonlinear dynamic parameters like fractal dimension (FrD) requires a long noise-free data set which is not beneficial for online diagnosis and difficult to obtain particularly under nonstationary conditions. Due to such shortcomings, approximate entropy (ApEn) is proposed to assess regularity of time series by means of statistical methods and applied to dealing with physiological signals and vibration signals [12]. Sample entropy (SampEn) proposed by Richman and Moorman is a modified version of ApEn [13, 14]. In comparison with ApEn, SampEn is less dependent on data quantity and at certain extent robust to noises. Therefore, SampEn can exactly reflect the complexity and irregularity of signals with wide applications in biomedical signal processing [15, 16]. Motivated by the similarities between mechanical vibration signals and biomedical signals, SampEn is expected to effectively describe the complexity and irregularity of bearing vibrations. For these reasons, the present study investigates the joint use of LWPT and SampEn for feature extraction of bearings fault diagnosis. In order to reduce manual intervention and human subjectivity, signals are analyzed in an automatic fashion in the form of intelligent diagnosis [17]. In recent years, artificial neural networks (ANNs) have been widely used in intelligent fault diagnosis to conduct pattern classification. The performance of a single neural network is usually affected by initial parameters like weights and node number in middle layer, and thus its recognition accuracy is unstable [18]. Aimed at such a dilemma, many methods of the multiple classifier fusion have been applied in the field of pattern recognition. Multiple classifiers fusion harnesses the advantages of different neural networks and avoids the shortcomings of a single neural network. Reference [19] utilizes the multiclassifier fusion which consists of seven different classifiers and combined by majority voting scheme (MVS) to classify four different patterns, which can acquire significantly higher classification accuracy than a single neural network. When more than one class wins the highest number of votes, classification decision was solved by comparing the sum of the posterior probability of each class. Reference [20] exploits the result from the highest rate of the member of multiclassifier in order to solve the problem that more than one class gets the highest number of votes. All of the above multiclassifier fusion can effectively improve the recognition accuracy in comparison with the diagnosis method based on a single classifier. However, these aforementioned methods not only employ a large number of classifiers which will increase computation burden and decrease recognition accuracy but also failed to fully resolve the problem that MVS become invalid when more than one classification wins the highest number of votes. For these reasons, the present study investigates a multiclassifier fusion algorithm using the form of binary tree for fault classification, where a multiclassification issue turns into a series of binary classification problems. Based on the aforementioned discussions, a new approach is proposed for efficient bearing fault diagnosis by
Shock and Vibration
3
xe (k)
x(n)
Split
a(k)
P
In the prediction step, using the adjacent 𝑀 even samples to predict one odd sample (M is an even number) and the resulting error 𝑑 = {𝑑(𝑘), 𝑘 = 0, 1, . . . , ⌊𝑁/2⌋ − 1} is defined as the detail coefficients of the wavelet transform. The processing of prediction is as follows:
U 𝑀
𝑑 (𝑘) = 𝑥𝑜 (𝑘) − ∑ 𝑝𝑖 𝑥𝑒 (𝑘 − xo (k)
d(k)
𝑖=1
𝑀 + 𝑖) , 2
(2)
𝑁 𝑘 = 0, . . . , ⌊ ⌋ − 1, 2 Split
Predict
Update
Figure 1: Decomposition steps of the second-generation wavelet transform.
conjunct use of the LWPT, SampEn, and binary tree structure based classifier ensemble. The novelties and contributions of the present work are twofold. Firstly, feature extraction is performed by LWPT and SampEn in order to exploit the nonstationarity, irregularity, and complexity of bearing vibrations. Secondly, a binary tree structure based classifier ensemble is proposed to mitigate the requirement on the number of member classifiers as well as improve classification accuracy and stability. The paper is organized as follows. Section 2 introduces the theoretical backgrounds of LWPT, SampEn and presents the proposed binary tree structure based classifier ensemble. Section 3 shows the architecture of the proposed fault diagnosis system. The experimental setup is described in Section 4. In Section 5, the experimental results and discussions are given followed by a conclusion of the current paper in Section 6.
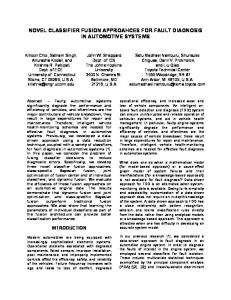
2. Theoretical Background 2.1. Lifting Wavelet Packet Transform. Wavelet packet transform can be implemented using lifting scheme in an easy understanding and efficient way [21]. The wavelet basis is determined by the prediction operator and update operator. Selecting different prediction operator 𝑃 = [𝑝1 , 𝑝2 , . . . , 𝑝𝑀] and update operator 𝑈 = [𝑢1 , 𝑢2 , . . . , 𝑢𝑀 ̃ ] is equivalent to determining different wavelet function, which can obtain different signal decompositions. The decomposition process of the LWPT consists principally of three steps: split, predict, and update, as shown in Figure 1. In the split step, the original signal {𝑥(𝑛), 𝑛 = 0, 1, . . . , 𝑁 − 1} is decomposed into even samples {𝑥𝑒 (𝑘), 𝑘 = 0, 1, . . . , ⌈𝑁/2⌉ − 1} and odd samples {𝑥𝑜 (𝑘), 𝑘 = 0, 1, . . . , ⌊𝑁/2⌋ − 1}. The symbol ⌈𝑁/2⌉ is the smallest integer greater than or equal to N/2, ⌊𝑁/2⌋ is the largest integer smaller than or equal to N/2, and 𝑁 𝑥𝑒 (𝑘) = 𝑥 (2𝑘) , 𝑘 = 0, 1, . . . , ⌈ ⌉ − 1, 2 𝑁 𝑥𝑜 (𝑘) = 𝑥 (2𝑘 + 1) , 𝑘 = 0, 1, . . . , ⌊ ⌋ − 1. 2
where 𝑃 = [𝑝1 , 𝑝2 , . . . , 𝑝𝑀] is the prediction operator and its length is M. In the update step, a designed update operator is applied on the detail coefficients obtained at the above step to update the even samples, which enable them to maintain a global nature of the original signal 𝑥(𝑛), such as energy, the mean, or vanishing moments. The update operator 𝑈 = [𝑢1 , 𝑢2 , . . . , 𝑢𝑀 ̃ ] is applied to the detail coefficients resulting from the prediction step and added to the even sample 𝑥𝑒 (𝑘); the concrete processing of update step is as follows: ̃ 𝑀
𝑎 (𝑘) = 𝑥𝑒 (𝑘) − ∑ 𝑢𝑗 𝑑 (𝑘 − 𝑗=1
𝑘 = 0, . . . , ⌈
(3) 𝑁 ⌉ − 1, 2
̃ an even number, is the length of the update operwhere 𝑀, ̃ detail coefficients ator. The above formula indicates that 𝑀 were used to update an even sample, and the obtained 𝑎 = {𝑎(𝑘), 𝑘 = 0, 1, . . . , ⌈𝑁/2⌉} is defined as the approximated factor of the original signal 𝑥(𝑛). The above three steps complete the processing of the first decomposition of the lifting wavelet packet transform. In order to acquire approximation and detail coefficients for 𝑥(𝑛) at different scales, constantly repeat these three steps to approximation and detail coefficients which are calculated at each scale. The LWPT reconstruction can be performed by simple algebraic transformation from (2) and (3); the reconstruction processing of the LWPT consists of three steps: undo update, undo prediction, and merge, as shown in Figure 2. In the undo update step, the even sample 𝑥𝑒 (𝑘) is recovered using approximate coefficient 𝑎 and detail coefficient 𝑑: ̃ 𝑀
𝑥𝑒 (𝑘) = 𝑎 (𝑘) − ∑ 𝑢𝑗 𝑑 (𝑘 − 𝑗=1
(1)
̃ 𝑀 − 1 + 𝑗) , 2
̃ 𝑀 − 1 + 𝑗) , 2 𝑁 𝑘 = 0, . . . , ⌈ ⌉ − 1. 2
(4)
4
Shock and Vibration where 𝑖 ≤ 𝑗 ≤ 𝑁 − 𝑚, 𝑗 ≠ 𝑖 and the average of all 𝑖 is counted as
xe (k)
a(k)
𝐵𝑚 (𝑟) = U
Merge
P
x(n)
(V) Theoretically, SampEn(𝑚, 𝑟) is defined as SampEn (𝑚, 𝑟) = lim [−ln
Undo update
Undo prediction
𝑁→∞
Merge
Figure 2: Reconstruction steps of the second-generation wavelet transform.
In the undo prediction step, the odd sample 𝑥𝑜 (𝑘) is recovered using the above even sample 𝑥𝑒 (𝑘) and detail coefficient 𝑑: 𝑀
𝑥𝑜 (𝑘) = 𝑑 (𝑘) − ∑ 𝑝𝑖 𝑥𝑒 (𝑘 − 𝑖=1
𝑀 + 𝑖) , 2
(5)
𝑁 𝑘 = 0, . . . , ⌊ ⌋ − 1. 2 In the merge step, the original signal 𝑥(𝑛) is recovered using the above even sample 𝑥𝑒 (𝑘) and odd sample 𝑥𝑜 (𝑘): 𝑥 (2𝑘) = 𝑥𝑒 (𝑘) , 𝑥 (2𝑘 + 1) = 𝑥𝑜 (𝑘) ,
𝑘 = 0, 1, . . . , ⌈
𝑁 ⌉ − 1, 2
𝑘 = 0, 1, . . . , ⌊
𝑁 ⌋ − 1. 2
(6)
2.2. Sample Entropy. Provided a time series containing 𝑁 points {𝑥(1), 𝑥(2), . . . , 𝑥(𝑁)}, the step of calculating its sample entropy is as follows [13, 14]. (I) Given the dimension of the space m, the original time series is composed of 𝑚 dimension vector: 𝑋 (𝑖) = [𝑥 (𝑖) , 𝑥 (𝑖 + 1) , . . . , 𝑥 (𝑖 + 𝑚 − 1)] , (𝑖 = 1, 2, . . . , 𝑁 − 𝑚 + 1) .
(7)
(II) Define the distance between two vectors 𝑋(𝑖) and 𝑋(𝑗): 𝑑 (𝑖, 𝑗) = max (𝑥 (𝑖 + 𝑘) − 𝑥 (𝑗 + 𝑘)𝑘=0,...,𝑚−1 ) .
(8)
(III) Given the threshold r, the number which satisfied the inequality 𝑑(𝑖, 𝑗) < 𝑟 is counted for each value 𝑖, the ratio of this number, and the total number of distances 𝑁 − 𝑚 + 1 which is denoted by 𝐵𝑖𝑚 (𝑟): 𝐵𝑖𝑚 (𝑟) =
[𝑑 (𝑖, 𝑗) < 𝑟] , 𝑁−𝑚−1
(10)
(IV) The above three steps are repeated for 𝑚 + 1, and then 𝐵𝑚+1 (𝑟) is obtained.
xo (k)
d(k)
1 𝑁−𝑚 𝑚 ∑ 𝐵 (𝑟) . 𝑁 − 𝑚 𝑖=1 𝑖
(9)
𝐵𝑚+1 (𝑟) ] 𝐵𝑚 (𝑟)
(11)
and when 𝑁 is a finite value, the SampEn of a time series containing 𝑁 points is defined as SampEn (𝑚, 𝑟, 𝑁) = −ln
𝐵𝑚+1 (𝑟) . 𝐵𝑚 (𝑟)
(12)
2.3. Binary Tree Structure Based Classifier Ensemble. In pattern recognition, it is impossible to achieve good recognition results for all samples by only one classifier, and different classifiers may lead to different results. As the performance of a single neural network is susceptible to its initial parameters, the recognition accuracy is unstable and volatile. Therefore, the results obtained by using a single neural network are limited. For these reasons, multiple classifiers fusion has potentials to improve the results due to the fact that classifier ensemble combines the advantages and overcomes the shortcomings of member classifiers. When majority voting scheme (MVS) is employed to build a classifier ensemble system, the number of the required member classifiers needs to be larger than that of the patterns to be recognized. In order to tackle such an issue, a multiclassifier fusion system is proposed by dividing the classification of multiple classes into a series of binary recognition issues. The member classifiers constructing the classifier ensemble system include BP neural network, Elman neural network, and RBF neural network. BP neural network known as a feed-forward artificial neural network is proposed by Rumelhart, Hinton, and Williams in 1986 which belongs to supervised learning and consists of nonlinear transformation units [22]. A BP neural network has a three-layer or over three-layer structure with strong nonlinear mapping ability and self-learning, selforganization, and adaptive ability, which is currently the most widely used network in many fields. Elman neural network, a well-known recurrent topology, is proposed by Jeffrey Elman in 1990. This network is more sensitive to the historical data, which enable it to handle the dynamic information. Furthermore, the network does not utilize state variable as the input or training signals due to the fact that its internal connections depict its dynamic characteristic, which makes it more suitable for the modeling of time-varying system [23]. RBF neural network, a feed-forward neural network with three layers, is proposed by Broomhead and Lowe in 1988. It is composed of input layer, hidden layer, and output layer
Shock and Vibration
5
Node 1
C1 Yes
Features
BPNN
Class I: C1 Class II: C2 · · · C10
No fusion
Class I: C2 Class II: C3 · · · C10
C8
Node 2
Is C1? ElmanNN RBFNN
Node 9
C9 Yes
Yes BPNN
BPNN
No
Is C9?
Is C8? ElmanNN
··· ElmanNN
fusion
fusion
No RBFNN
RBFNN C10
Figure 3: Binary tree structure based multiple classifier fusion.
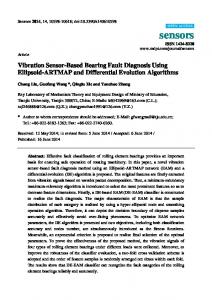
where the input and output consist of linear neurons and the hidden layer node is a Gaussian kernel. The most important characteristics of the RBF network lie in the fact that its hidden layer neurons have only local reactions of input function, which is in the middle of the basis function. RBF neural network is characterized by simple structure, concise training, and fast learning convergence with the ability to approximate any nonlinear function [24]. Classifier ensemble gives a final result by combining the output of each member classifier through certain fusion algorithm. A lot of fusion algorithms are available like voting scheme and DS evidence theory. The present study exploits MVS to build a multiclassifier fusion system. The MVS is a simple and effective method at decision level, of which the final decision is the one that the majority of the member classifiers support. Although the final decision is not necessary to be the best decision rule, it is the decision with highest relative reliability. Nevertheless, for effective utilization of MVS, the number of the member classifiers is usually bound to be larger than that of the patterns to be recognized. Otherwise, it is difficult to achieve decision fusion in certain cases. For example, if 3 classifiers are applied to classify 10 patterns, the 3 classifiers may give a result different with each other. In this case, the MVS is unable to give a reasonable result. Aimed at such a problem, the present study puts forward a classifier ensemble algorithm performed in the form of binary tree, where the multiclassification problem is divided into a sequence of binary classification. Figure 3 shows the procedure of the proposed classifier ensemble. Patterns are grouped into two categories at each node, and the first category contains only one fault type while the rest of the fault types are considered as the other category. Taking a total of 10 fault types for example, at the first node of the binary tree, the bearing condition C1 is treated as the first category, while the remaining 9 bearing health conditions are packed together as the other category. This process is repeated until the last node contains only two bearing fault types, that is, C9 and C10.
Such a trick transforms the multiclassification problem into a series of binary classification problems, which is beneficial for performing multiclassifier fusion based on the MVS with only three member classifiers on each node.
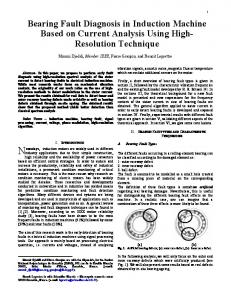
3. Architecture of the Proposed Fault Diagnosis System Figure 4 depicts the procedure of the proposed fault diagnosis system. Firstly, the signals are decomposed into different frequency subbands through a three-level LWPT, resulting in a total of 8 node signal components. Later on, the SampEns of all the 8 components were calculated as a feature input to a binary tree structure based classifier ensemble. The trained binary tree based classifier ensemble was finally utilized to recognize the testing set.
4. Experimentation 4.1. Experimental Setup. Experiments were conducted on rolling bearings to testify the proposed fault diagnosis method. The test rig is a motor-driven mechanical system as shown in Figure 5 which is composed of a three-phase induction motor on the left, a torque sensor in the middle, and a dynamometer on the right [25]. Because a big load can facilitate fault diagnosis of rolling bearing, the vibration signals of rolling bearing were collected under a load free state which can serve as a better metric to measure the effectiveness of the fault diagnosis method. The tested bearings are 62052RS JEM SKF, deep-groove ball bearings, which are fixed in the motor drive end to brace the motor shaft. Faults are preseeded on one element of rolling bearings involving ball, outer race, and inner race by means of electric discharge machining. The levels of fault severity for each fault type include (0.1778 mm, 0.2794 mm), (0.3556 mm, 0.2794 mm), and (0.5334 mm, 0.2794 mm) in fault diameter and depth, respectively.
6
Shock and Vibration
Signals
Feature extraction
Fault recognition
C1
Node 1
Features
Node 1
Class I: C1 Class II: C2 · · · C10
SampEn 1 BPNN
No C10
.. .
.. .
Node 8
SampEn 8
Class I: C2 Class II: C3 · · · C10
C8 No
Is C9?
LWPT
Yes No Is C1?
RBFNN
Yes
SampEn 2
ElmanNN fusion
Node 9
C9
Node 2
BPNN
ElmanNN
Node 2 Yes
Is C8?
fusion
RBFNN
BPNN ···
ElmanNN fusion RBFNN
Bearing condition
Figure 4: The structure of the proposed fault diagnosis system. Table 1: Experimental data condition. Bearing condition Normal Inner race fault
Outer race fault
Rolling ball fault
Defect size (mm) 0 0.1778 × 0.2797 0.3556 × 0.2797 0.5334 × 0.2797 0.1778 × 0.2797 0.3556 × 0.2797 0.5334 × 0.2797 0.1778 × 0.2797 0.3556 × 0.2797 0.5334 × 0.2797
Number of samples 60 60 60 60 60 60 60 60 60 60
Condition number C1 C2 C3 C4 C5 C6 C7 C8 C9 C10
the motor housing at the drive end and fixed at 12 o’clock position. The experimental data set is depicted in Table 1 in detail, including a total of 10 bearing conditions considering various fault types and different severity levels. Each bearing condition was collected with 60 samples, and each data sample contains 2000 data points. Examples for the time waveforms of the 10 bearing conditions are shown in Figure 6, where conditions C3, C5, and C7 are characterized by obvious impulses. Figure 5: Rolling bearing fault test sets.
The vibration signals were obtained by means of a 16-channel DAT recorder at the sampling frequency of 12 000 Hz, and the shaft rotating speed was set approximately 1797 rpm. In order to acquire vibration signals of various bearing heath conditions, an accelerometer was attached to
4.2. Feature Extraction. Features extracted from bearing vibrations should characterize not only the nonstationarity but also the irregularity and complexity embedded in the data. Lifting wavelet packet transform takes advantage of the local relevance in signal data structure to perform wavelet function construction completely in the time domain, so it is suitable for processing vibration signals of rolling bearings. The lifting wavelet function is determined by the prediction and update operators which are produced by the interpolating subdivision method (ISM) introduced in [11]. When the
7 C1 Amplitude (ms−2 )
0.5
0
−0.5
0
500
1500
2000
C3 Amplitude (ms−2 )
2
0
−2
0
500
1000 Data point
1500
2000
Amplitude (ms−2 )
0
−5
0
500
1000 Data point
1500
2000
C7
0
0
500
1000 Data point
1500
2000
C9
1
Amplitude (ms−2 )
Amplitude (ms−2 )
−5
0
−1
0
500
C2
2
0
−2
0
500
1000 Data point
1500
2000
1500
2000
1500
2000
1500
2000
1500
2000
C4
5
0
−5
0
500
1000 Data point
C5
5
5
Amplitude (ms−2 )
1000 Data point
Amplitude (ms−2 )
Amplitude (ms−2 )
Amplitude (ms−2 )
Amplitude (ms−2 )
Shock and Vibration
1000 Data point
1500
2000
C6
0.5
0
−0.5
0
500
1000 Data point C8
0.5
0
−0.5
0
500
1000 Data point C10
0.5
0
−0.5
0
500
1000 Data point
Figure 6: Vibration signals of 10 bearing conditions.
order of both prediction and update operators is 12, operators 𝑃 and 𝑈 as well as the waveforms of scale and wavelet function are as follows. It is observed from Figure 7 that the wavelet function is in a considerable agreement with bearing shocks: 𝑃 = [−0.1202, 1.6155, −10.3855, 43.6192, − 145.3972, 610.6682, 610.6682, − 145.3972, 43.6192, −10.3855, 1.6155, −0.1202] × 10−3 ,
𝑈 = [−0.0601, 0.8078, −5.1928, 21.8096, − 72.6986, 305.3341, 305.3341, − 72.6986, 21.8096, −5.1928, 0.8078, −0.0601] × 10−3 . (13) SampEn is an improved version of approximate entropy with the ability to reflect the complexity and irregularity of a time series. For calculation of SampEn, the dimension 𝑚 and the tolerance level 𝑟 should be determined a priori. Herein,
8
Shock and Vibration Scale function
1.2
Wavelet function 0.6
1 0.8
0.4
0.6 0.2 0.4 0
0.2 0
−0.2 −0.2 −0.4
−0.4 −1
−0.5
0
0.5
1
−1
−0.5
0
0.5
1
̃ = 12. Figure 7: Scale and wavelet function when 𝑀 = 12, 𝑀
the tolerance level 𝑟 is selected as 0.2 times the standard deviations of the inspected data and the dimension of the space 𝑚 is chosen as 2. With above selected parameters, the bearing signals are first decomposed by the three-level LWPT (with 𝑀 = 12, ̃ = 12). The SampEns of all the 8 components are then 𝑀 calculated as a feature vector to depict the irregularity and complexity of the bearing vibration signals. By the joint use of the LWPT and SampEn, the features of the signals shown in Figure 6 are obtained. It is seen from Figure 8 that the extracted features can effectively distinguish among different bearing fault types and severity levels. 4.3. Experimental Data and Parameter Preparation. As shown in Table 1, 10 types of bearing conditions have 60 × 10 = 600 data samples in total. The data set was divided into a training set and a testing set, where the training set was 40 randomly selected samples from each kind of health conditions and the testing set was constituted by the remaining data samples. That is, the training set comprised 40 × 10 = 400 data samples and the testing set contained 20 × 10 = 200 data samples. The testing set serves the purpose of measuring the performance of the trained binary tree structure based classifier ensemble. Each sample is represented by a feature vector consisting of the SampEns of all the 8 node signal components throughout the third layer of the LWPT decomposition tree. In the present experiment, the bearing signals are first decomposed by a (12, 12) three-level LWPT. The SampEns of all the 8 components are then calculated as a feature vector to characterize the complexity of the bearing vibration signals and then input to binary tree structure based classifier ensemble to train each classifier involving BP neural network and Elman neural network as well as RBF neural network. The transfer function of hidden layer and output layer neurons of BP neural network employs Logsig and
Purelin, respectively. The largest amount of training and the minimum mean square error are chosen as 1000 and 10−8 , respectively. The hidden layer node number is selected as 10 for BP neural network. The transfer function of hidden layer and output layer neurons of Elman neural network is Tansig and Purelin, respectively. The largest amount of training is chosen as 1000, the minimum mean square error is set as 10−8 , and the hidden layer nodes number is 10 for Elman neural network. For RBF neural network, the correlation function adopts Newrbe and the value of spread of radial basis function is chosen as 1.
5. Results and Discussion 5.1. Diagnostic Results from Binary Tree Structure Based Classifier Ensemble. Due to the advantages of binary tree structured classifier ensemble, the fusion algorithm shown in Figure 3 is adopted. In this context, the bearing condition C1 is treated as one category, while the remaining 9 types of bearing health condition are grouped into the other category in the first node of the binary tree. The tree node employs three different neural networks and MVS fusion strategy to separate condition C1 from other 9 conditions. In the second node, the bearing condition C2 is distinguished from other 8 conditions excluding condition C1 by means of classifier ensemble based on three classifiers and MVS. The above steps are repeated until all the 10 bearing conditions are differentiated. Given that the initial connection weights and thresholds have an effect on the performance of each member classifier, 100 runs for binary tree structure based classifier ensemble using the same training set and testing set were conducted. The recognition accuracy of 100 runs for binary tree system is shown in Figure 9, where the highest accuracy, the average accuracy, and the lowest accuracy are 100%, 99.53%, and
Shock and Vibration
9
C1
2
0
1
2
3
4
5
C2
4
SampEn
SampEn
4
6
7
2
0
8
1
2
The number of nodes C3
2
0
1
2
3
4
5
6
7
1
2
The number of nodes C5
2
0
1
2
0
1
2
3 4 5 6 The number of nodes
7
SampEn 1
2
3 4 5 6 The number of nodes
3 4 5 6 The number of nodes
7
8
7
8
7
8
C8
1
2
3
4
5
6
C10
4
2
0
2
The number of nodes
C9
4
1
2
0
8
8
C6
4
1
7
2
0
8
SampEn
SampEn
7
C7
2
SampEn
3 4 5 6 The number of nodes
3 4 5 6 The number of nodes
4
SampEn
SampEn
4
8
2
0
8
7
C4
4
SampEn
SampEn
4
3 4 5 6 The number of nodes
7
8
2
0
1
2
3 4 5 6 The number of nodes
Figure 8: Features of 10 bearing conditions extracted by LWPT and SampEn.
10
Shock and Vibration Table 2: Averaged confusion matrix over 100 tests (%).
True condition
C1 100.0 0 0 0 0 0 0 0 0 0
C1 C2 C3 C4 C5 C6 C7 C8 C9 C10
C2 0 100.0 0 0 0 0 0 0 0 0
C3 0 0 100.0 0 0 0 0 0 0 0.7
C4 0 0 0 100.0 0 0 0 0 0 0
Assigned condition (%) C5 C6 0 0 0 0 0 0 0 0 100.0 0 0 100.0 0 0 0 0 0 0 0 0
1
Max. = 1
1
C8 0 0 0 0 0 0 0 100.0 0.2 0.3
C9 0 0 0 0 0 0 0 0 96.3 0
C10 0 0 0 0 0 0 0 0 0 99.0
Max. = 0.98
0.95 Accuracy (×100%)
Accuracy (×100%)
0.998
C7 0 0 0 0 0 0 100.0 0 3.5 0
Average = 0.9953
0.996 0.994
0.9
Average = 0.8714
0.85
0.992 Min. = 0.99 0.99
0.8 10
20
30
40
50 60 Runs
70
80
90
100
10
20
Min. = 0.7950 30 40 50 60 Runs
70
80
90
100
Figure 9: Testing results of 100 runs for binary tree system.
Figure 10: Testing results of 100 runs using BP neural network.
99.00%, respectively. The recognition accuracy is considerably stable which implies that the classifier ensemble has a good adaptability and high stability. It is demonstrated that the effect of initial connection weights and thresholds on the final recognition accuracy is small and negligible. The proposed binary tree structure based classifier ensemble can effectively judge bearing fault type and severity. In order to further examine the details of the classification results, the confusion matrix averaged over the 100 tests is shown in Table 2. The cells along the diagonal of the 10 × 10 matrix indicate the percentage of accurately sorted samples, while the other cells of the diagonal reveal the misclassified samples. Utilizing the cells at the second row from the bottom of the matrix in Table 2, for example, it is shown that the samples belonging to bearing condition C9 are misclassified into conditions C7 and C8 by the proportion of 3.5% and 0.2%, respectively. On the other hand, the value 96.3% indicates the proportion of exactly classified samples. Therefore, the values of the cells along the diagonal are expected to be as large as possible. A small value of the cell along the diagonal in the first line indicates a higher risk for a healthy condition misdiagnosed as that with fault, which will lead to unnecessary production downtime. It is observed in
Table 2 that false identifications just occurred with conditions C9 and C10 and the remaining conditions are able to be identified correctly. 5.2. Comparison with a Single Neural Network. In order to verify the advantages of the binary tree structured classifier ensemble in fault classification, single classifier was utilized for comparison purpose including BP network, Elman network, and RBF network. The training set, testing set, and the initial settings except weights and thresholds of each member classifier are identical with those used in above classifier ensemble. Considering the initial connection weights and thresholds have an effect on the performance of BP neural network and Elman neural network, the test was repeated 100 times for each classifier using the same training set and testing set, but the weights and thresholds are randomly obtained. Figures 10 and 11 show the 100 test results for the BP neural network and Elman neural network, respectively. The results of RBF neural network vary with its “Spread” value. With the “Spread” varying from 1 to 100 with a step of 1, the test using RBF was repeated 100 times with results shown in Figure 12. Figure 10 shows that the maximum accuracy, the averaged accuracy, and the minimum accuracy of BP neural network
Shock and Vibration
11 Table 3: Classification results using different classifiers of 100 runs (×100%).
Classifiers BP Elman RBP Binary tree system
0.95
Minimum accuracy 0.7950 0.7000 0.8400 0.9900
Average accuracy 0.8714 0.8046 0.8606 0.9953
Max. = 0.9350
Accuracy (×100%)
0.9
0.85 Average = 0.8046 0.8
0.75
0.7 10
20
Min. = 0.7000 30 40 50 60 Runs
70
80
90
100
Figure 11: Testing results of 100 runs using Elman neural network. 0.93 Max. = 0.92
0.92
Accuracy (×100%)
0.91 0.9 0.89 0.88 0.87
Average = 0.8606
0.86 0.85 0.84 0.83
Min. = 0.84 10
20
30
40
50 60 Runs
70
80
90
100
Figure 12: Testing results of 100 runs using RBF neural network.
are 98.00%, 87.14%, and 79.50%, respectively. The test results show the initial connection weights and thresholds have a substantial effect on the performance of BP neural network and lead the accuracy to fluctuate significantly. It is seen from Figure 11 that the maximum, averaged, and minimum recognition accuracy are 93.50%, 80.46%, and 70.00% for Elman neural network. The test results demonstrate that randomly selected initial connection weights and thresholds may result in an unfavorable accuracy. Figure 12 exhibits that the maximum accuracy is up to 92.00% when the “Spread” of radial basis function is 15, while the averaged accuracy
Maximum accuracy 0.9800 0.9350 0.9200 1
is 86.07%. The recognition rate gets its minimum values of 84.00% when the value of “Spread” is 53, 63, or within 94 to 100. The test results illustrate that the recognition accuracy is highly sensitive to the “Spread” of radial basis function. The results of classifier ensemble and member classifiers are summarized in Table 3 in the form of minimum, average, and maximum diagnosis accuracy. It is seen that the performance of classifier ensemble is superior to any member classifier in the sense that the classifier fusion has a high average accuracy and the difference between maximum and minimum accuracy is small. The small variation of diagnosis accuracy means the classifier ensemble paradigm is robust to initial parameter selection of member classifiers, which is important for intelligent diagnosis to be used in the fields. The accuracy of member classifier is necessary to be larger than a random assignment in the framework of multiple classifier fusion. The fusion philosophy can give a reasonable result by synthesizing results of the member classifiers. The excellent performance of classifier ensemble can also be ascribed to the conjunct use of the LWPT and SampEn to characterize not only the nonstationarity but also the irregularity and complexity of bearing vibration signals. The confusion matrixes averaged over the 100 tests are shown in Tables 4, 5, and 6 when only using BP neural network, Elman neural network, and RBF neural network, respectively. Table 4 shows that conditions C8, C9, and C10 show high misidentified probability and poor diagnostic reliability with BP neural network. Table 5 indicates that high misclassifications also lie in conditions C8, C9, and C10 by Elman neural network with the average diagnostic accuracy of 10.35%, 67.75%, and 31.10%, respectively. Such results imply that BP and Elman neural networks have trouble in distinguishing between the three levels of fault severity on rolling element. The false identifications of RBF networks mostly appear in conditions C8 and C10 as shown in Table 6 where the samples belonging to condition C8 are misclassified into conditions C4 and C9 by the proportion of 74.4% and 0.15% and the samples belonging to condition C10 are misclassified into conditions C4, C7, and C9 by the proportion of 62.05%, 0.05%, and 0.2%, respectively. Above comparison indicates that classifier ensemble is robust to initial parameters of networks and can recognize both fault type and fault severity level with a satisfied accuracy by resorting to the effective feature extraction using the LWPT and SampEn.
6. Conclusions The current paper presents an intelligent diagnosis method for rolling bearings by integrating the LWPT, SampEn, and
12
Shock and Vibration Table 4: Averaged confusion matrix of 100 tests for BP neural network (%).
True condition C1 C2 C3 C4 C5 C6 C7 C8 C9 C10
C1 100.0 0 0 0 0 0 0 0 0.05 0
C2 0 99.95 0 0 0 0 0 0 0 0.1
C3 0 0 100.0 0 0 0 0 0 0.85 0.1
C4 0 0.05 0 100.0 0 0 0 64.75 1.25 58.4
Assigned condition (%) C5 C6 0 0 0 0 0 0 0 0 99.95 0 0 100.0 0 0 0 0 0 0.05 0.05 0
C7 0 0 0 0 0 0 100.0 0 1.85 0
C8 0 0 0 0 0 0 0 34.95 0.2 0
C9 0 0 0 0 0.05 0 0 0.3 95.75 0.55
C10 0 0 0 0 0 0 0 0 0 40.8
C8 0 0 0 0 0 0 0 10.35 0.75 0.05
C9 0 0 0 0 0 0 0 0 67.75 0.05
C10 0 0 0.7 0 0 0.05 0 0 0.05 31.1
C9 0 0 0 0 0 0.05 0 0.15 97.7 0.2
C10 0 0 0 0 0 0 0 0 0 37.7
Table 5: Averaged confusion matrix of 100 tests for Elman neural network (%). True condition C1 C2 C3 C4 C5 C6 C7 C8 C9 C10
C1 100.0 0 0 0 0 0 0 0 0 0
C2 0 99.6 0.55 0 0 0 0 0 0 0.1
C3 0 0 95.8 0 0 0 0 0 1.1 0.3
C4 0 0.4 0.05 100.0 0 0 0 89.65 25.45 67.9
Assigned condition (%) C5 C6 0 0 0 0 0 0 0 0 100.0 0 0 99.95 0 0 0 0 0 0 0.45 0.05
C7 0 0 2.9 0 0 0 100.0 0 4.9 0
Table 6: Averaged confusion matrix of 100 tests for RBF neural network (%). True condition C1 C2 C3 C4 C5 C6 C7 C8 C9 C10
C1 100.0 0 0 0 0 0 0 0 0 0
C2 0 100.0 0 0 0 0 0 0 0 0
C3 0 0 100.0 0 0 0 0 0 0.3 0
C4 0 0 0 100.0 0 0.15 0 74.4 0.65 62.05
binary tree structure based classifier ensemble. The distinct merits of the diagnosis method lie in the feature extraction methods combining the LWPT with the SampEn as well as the recognition methods by binary tree system based classifier ensemble. Given that bearing vibrations especially in fault conditions demonstrate not only nonstationarity but also irregularity and complexity, vibration signals are decomposed by a three-level LWPT followed by the application of the SampEns to all the 8 components as feature vectors to represent the bearing vibration signals. A multiclassifier
Assigned condition (%) C5 C6 0 0 0 0 0 0 0 0 100.0 0 0 99.8 0 0 0 0 0 0 0 0
C7 0 0 0 0 0 0 100.0 0 1.15 0.05
C8 0 0 0 0 0 0 0 25.45 0.2 0
fusion algorithm is presented using the form of binary tree, due to the fact that initial connection weights and thresholds have a significant effect on the performance for a single neural network classifier and traditional fusion algorithms for multiple classifier not only require a large number of member classifiers leading to increase of computation effort and decrease of recognition accuracy but also fail to resolve the problem with more than one class winning the highest number of votes. Experimental data are composed of 10 kinds of bearing health conditions including various fault types
Shock and Vibration and severity levels. The results demonstrate the proposed method can effectively improve the recognition accuracy and performance stability for rolling bearing fault diagnosis in comparison with the diagnosis method based on a single classifier.
Conflict of Interests The authors declare that there is no conflict of interests regarding the publication of this paper.
Acknowledgments This work was financially supported by the Natural Science Foundation of China (51205130, 51265010) and the Foundation of Jiangxi Association for Science and Technology (YHGC2014-154) as well as the Postgraduate Innovation Funds of Jiangxi Province (YC2014-S244, YC2015-S239).
References [1] X. Zhang, J. Kang, L. Xiao, J. Zhao, and H. Teng, “A new improved Kurtogram and its application to bearing fault diagnosis,” Shock and Vibration, vol. 2015, Article ID 385412, 22 pages, 2015. [2] W. Wen, Z. Fan, D. Karg, and W. Cheng, “Rolling element bearing fault diagnosis based on multiscale general fractal features,” Shock and Vibration, vol. 2015, Article ID 167902, 9 pages, 2015. [3] P. H. Nguyen and J.-M. Kim, “Multifault diagnosis of rolling element bearings using a wavelet kurtogram and vector medianbased feature analysis,” Shock and Vibration, vol. 2015, Article ID 320508, 14 pages, 2015. [4] X. Jin, M. Zhao, T. W. S. Chow, and M. Pecht, “Motor bearing fault diagnosis using trace ratio linear discriminant analysis,” IEEE Transactions on Industrial Electronics, vol. 61, no. 5, pp. 2441–2451, 2014. [5] R. Yan, M. Shan, J. Cui, and Y. Wu, “Mutual information-assisted wavelet function selection for enhanced rolling bearing fault diagnosis,” Shock and Vibration, vol. 2015, Article ID 794921, 9 pages, 2015. [6] I. Daubechies and W. Sweldens, “Factoring wavelet transform into lifting steps,” Journal of Fourier Analysis and Applications, vol. 4, no. 3, pp. 245–267, 1998. [7] Y. Pan, J. Chen, and L. Guo, “Robust bearing performance degradation assessment method based on improved wavelet packet-support vector data description,” Mechanical Systems and Signal Processing, vol. 23, no. 3, pp. 669–681, 2009. [8] J. Rafiee, F. Arvani, A. Harifi, and M. H. Sadeghi, “Intelligent condition monitoring of a gearbox using artificial neural network,” Mechanical Systems and Signal Processing, vol. 21, no. 4, pp. 1746–1754, 2007. [9] E. Cabal-Yepez, M. Valtierra-Rodriguez, R. J. Romero-Troncoso et al., “FPGA-based entropy neural processor for online detection of multiple combined faults on induction motors,” Mechanical Systems and Signal Processing, vol. 30, pp. 123–130, 2012. [10] C.-H. Chen, R.-J. Shyu, and C.-K. Ma, “Rotating machinery diagnosis using wavelet packets-fractal technology and neural networks,” Journal of Mechanical Science and Technology, vol. 21, no. 7, pp. 1058–1065, 2007. [11] W. Sweldens, “The lifting scheme: a construction of second generation wavelets,” SIAM Journal on Mathematical Analysis, vol. 29, no. 2, pp. 511–546, 1998.
13 [12] S. M. Pincus, “Approximate entropy as a measure of system complexity,” Proceedings of the National Academy of Sciences of the United States of America, vol. 88, no. 6, pp. 2297–2301, 1991. [13] J. S. Richman and J. R. Moorman, “Physiological time-series analysis using approximate entropy and sample entropy,” American Journal of Physiology—Heart and Circulatory Physiology, vol. 278, no. 6, pp. H2039–H2049, 2000. [14] N.-K. Hsieh, W.-Y. Lin, and H.-T. Young, “High-speed spindle fault diagnosis with the empirical mode decomposition and multiscale entropy method,” Entropy, vol. 17, no. 4, pp. 2170– 2183, 2015. [15] V. Bari, A. Marchi, B. de Maria et al., “Low-pass filtering approach via empirical mode decomposition improves shortscale entropy-based complexity estimation of QT interval variability in long QT syndrome type 1 patients,” Entropy, vol. 16, no. 9, pp. 4839–4854, 2014. [16] Q. Wei, Q. Liu, S.-Z. Fan et al., “Analysis of EEG via multivariate empirical mode decomposition for depth of anesthesia based on sample entropy,” Entropy, vol. 15, no. 9, pp. 3458–3470, 2013. [17] V. A. Sotiris, P. W. Tse, and M. G. Pecht, “Anomaly detection through a Bayesian support vector machine,” IEEE Transactions on Reliability, vol. 59, no. 2, pp. 277–286, 2010. [18] L. Zhang, G. L. Xiong, L. P. Liu, and Q. S. Cao, “Gearbox health condition identification by neuro-fuzzy ensemble,” Journal of Mechanical Science and Technology, vol. 27, no. 3, pp. 603–608, 2013. [19] B. Yang, Z. J. Liu, and Y. Xing, “Integration of multiple classifiers for remote sensing image classification,” Remote Sensing. Information, vol. 27, no. 6, pp. 17–20, 2012. [20] B. B. Tang, X. W. Wang, and W. H. Wang, “Network traffic classification based on combination of multi-classifiers,” Computer Engineering and Applications Journal, vol. 49, pp. 82–84, 2013. [21] W. Sweldens, “Bulding your own wavelet at home,” in Proceedings of the ACM SIGGRAPH Wavelets in Computer Graphics, pp. 16–87, 1996. [22] C. C. Ma, X. D. Gu, and Y. Y. Wang, “Fault diagnosis of power electronic system based on fault gradation and neural network group,” Neurocomputing, vol. 72, no. 13–15, pp. 2909–2914, 2009. [23] B. Fan, Z. M. Du, X. Q. Jin, X. B. Yang, and Y. B. Guo, “A hybrid FDD strategy for local system of AHU based on artificial neural network and wavelet analysis,” Building and Environment, vol. 45, no. 12, pp. 2698–2708, 2010. [24] Q. Yi, L. Zhan-Ming, and L. Er-Chao, “Fault detection and diagnosis for non-Gaussian stochastic distribution systems with time delays via RBF neural networks,” ISA Transactions, vol. 51, no. 6, pp. 786–791, 2012. [25] K. A. Loparo, “Bearing Vibration Data: Case Western Reserve University Bearing Data Center Website,” January 2015, http:// csegroups.case.edu/bearingdatacenter/pages/welcome-casewestern-reserve-university-bearing-data-center-website.
International Journal of
Rotating Machinery
Engineering Journal of
Hindawi Publishing Corporation http://www.hindawi.com
Volume 2014
The Scientific World Journal Hindawi Publishing Corporation http://www.hindawi.com
Volume 2014
International Journal of
Distributed Sensor Networks
Journal of
Sensors Hindawi Publishing Corporation http://www.hindawi.com
Volume 2014
Hindawi Publishing Corporation http://www.hindawi.com
Volume 2014
Hindawi Publishing Corporation http://www.hindawi.com
Volume 2014
Journal of
Control Science and Engineering
Advances in
Civil Engineering Hindawi Publishing Corporation http://www.hindawi.com
Hindawi Publishing Corporation http://www.hindawi.com
Volume 2014
Volume 2014
Submit your manuscripts at http://www.hindawi.com Journal of
Journal of
Electrical and Computer Engineering
Robotics Hindawi Publishing Corporation http://www.hindawi.com
Hindawi Publishing Corporation http://www.hindawi.com
Volume 2014
Volume 2014
VLSI Design Advances in OptoElectronics
International Journal of
Navigation and Observation Hindawi Publishing Corporation http://www.hindawi.com
Volume 2014
Hindawi Publishing Corporation http://www.hindawi.com
Hindawi Publishing Corporation http://www.hindawi.com
Chemical Engineering Hindawi Publishing Corporation http://www.hindawi.com
Volume 2014
Volume 2014
Active and Passive Electronic Components
Antennas and Propagation Hindawi Publishing Corporation http://www.hindawi.com
Aerospace Engineering
Hindawi Publishing Corporation http://www.hindawi.com
Volume 2014
Hindawi Publishing Corporation http://www.hindawi.com
Volume 2014
Volume 2014
International Journal of
International Journal of
International Journal of
Modelling & Simulation in Engineering
Volume 2014
Hindawi Publishing Corporation http://www.hindawi.com
Volume 2014
Shock and Vibration Hindawi Publishing Corporation http://www.hindawi.com
Volume 2014
Advances in
Acoustics and Vibration Hindawi Publishing Corporation http://www.hindawi.com
Volume 2014