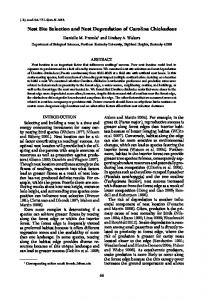
Bee Nest Site Selection as an Optimization Process Konrad Diwold1 , Madeleine Beekman2 and Martin Middendorf1 1
2
Department of Computer Science, Universit¨at Leipzig, D-04103 Leipzig, Germany School of Biological Sciences and Centre for Mathematical Biology, The University of Sydney, NSW 2006, Australia
[email protected]
Abstract In recent years several bee inspired optimization techniques have been proposed. These methods are either based on the bees’ foraging or mating behavior. Both foraging and mating regulate distributions outside (foraging) or within a colony (mating). Foraging determines the ratio of individuals that explore the surroundings for new food sources and those that exploit known food sources, while mating determines the distribution of genotypes within a colony. In contrast, nest-site selection is a processes that constitutes a decision-making process and enables a colony to identify and converge towards one best solution. We therefore propose to use the bees’ nestsite selection behavior as the basis for developing new bee inspired optimization techniques. Using a model of the nestsite selection process of real bees, we empirically investigate its optimization potential. In particular, we determined if this model works in dynamic and noisy environments. Our results are promising and suggest that nest-site selection can be indeed useful in the context of optimization.
Introduction Identifying and mimicking concepts underlying natural phenomena and applying them to solve problems in fields such as computer science, material science and engineering, has grown into a research field in itself. So-called nature inspired computation has given rise to computational concepts which are almost ubiquitous in computer science such as neural networks (Haykin (1999)), evolutionary computation (Eiben and Smith (2003)), and swarm intelligence (Bonabeau et al. (1999)). Swarm intelligence tackles problems of various computational domains (e.g., robotics and optimization (Blum and Merkle (2008))) using the collective behavior of simple decentralized, self-organized systems. The result has been the emergence of several prominent meta-heuristics e.g., ant colony optimization (for an overview see Dorigo and St¨utzle (2004)) and particle swarm optimization (for an overview see Poli et al. (2007)). Due to their decentralized collective behavior, honey bees have become an important model system in the field of swarm intelligence. Honey bee colonies tackle several complex tasks such as maintaining a constant hive tempera-
Proc. of the Alife XII Conference, Odense, Denmark, 2010
ture (Jones et al. (2004)), adapting to changing foraging conditions (Beekman et al. (2007)) or deciding on the best possible nest site available (Seeley and Buhrman (2001)). Several algorithms based on the honey bees’ collective behavior have been developed and applied to various domains such as network routing, robotics, multi-agent systems, and optimization (see (Karaboga and Akay (2009)) for a recent review on bee inspired algorithms). Existing optimization algorithms based on principles of honey bee behavior usually mimic either foraging or mating behavior. Mating-inspired optimization algorithms are closely related to methods found in evolutionary computation. They are based on the fact that genetic heterogeneity among workers typically increases a colony’s fitness (Fuchs and Schade (1994)). In honey bees genetic heterogeneity is achieved via the queen mating with several males (polyandry). While some mating inspired methods constitute new operators for existing methods in evolutionary computation (e.g., Sato and Hagiwara (1997); Jung (2003); Karci (2004)), others try to mimic the mating flight both on a behavioral and genetic level (see, Abbass (2001)). Foraging-inspired optimization algorithms make use of the bees’ decentralized foraging behavior. During foraging honey bees balance the trade-off between exploiting known food sources and scouting for new food sources in a dynamic environment (Beekman et al. (2007)). Bees use a communication mechanism called the “waggle dance” which enables them to transfer information about found food sources to other colony members. The dance encodes the distance and direction to a food source as well as its quality. On the basis of available dances, bees entering the foraging process decide to become dedicated to a specific source (exploit) or to start searching for new sources (explore). Optimization algorithms based on the foraging concept consist of a number of agents, so-called artificial bees. As in nature, the purpose of the agents is twofold. On the one hand they search for new solutions (i.e., food sources) in problem space, on the other hand they try to improve (i.e., exploit) existing solutions using local search. The ratio between exploration and exploitation behavior depends on the number and quality of
626
available solutions. Several foraging based algorithms have been proposed such as the artificial bee colony optimization (ABC) (Karaboga (2005)), the bees algorithm (BA) (Pham et al. (2006)), the bee colony optimization (BCO) (Teodorovic and Dell’Orco (2005)) or the bee colony optimization algorithm (BCOA) (Chong et al. (2006)). Here we introduce a third possible class of optimization algorithms which is based on the bees’ nest-site selection behavior. After a colony produces new queens, the old queen will leave the nest with approximately a third of the colony members while a young queen perpetuates the old colony. The homeless swarm now has to find a new nest-site (detailed information on the underlying biological mechanisms are provided in the next Section). This is not an easy task as a swarm needs to select the best site out of many possible sites. While during foraging typically several resources are exploited simultaneously, nest-site selection constitutes a decision process, as a swarm has to decide on one nest site by solving the best-of-n-problem (Seeley and Buhrman (2001)). Bees face a speed-accuracy trade-off when trying to find a new nest site. A decision needs to be made quickly as a swarm is vulnerable to predation and inclement weather, but not too fast which could lead to the swarm settling for a suboptimal nest site. Hence, the decision-making process has to account for temporal delays in nest site discoveries and needs to exhibit sufficient flexibility in order to incorporate late discovered nest sites into the decision-making process. In terms of optimization, the principles underlying nestsite selection seem of particular interest for dynamic optimization problems, where the problem space changes during the optimization process. We use a biological model of nestsite selection to test the applicability of nest-site selection in the context of optimization. We do this by testing nest-site selection in situations innate to dynamic optimization problems. Additionally we will demonstrate how iterative nestsite selection can lead to function optimization. This article is structured as follows. Section 2 briefly outlines the biological principles underlying nest-site selection in honeybees. In Section 3 we introduce a biological model of nest-site selection. Based on this model we present various experiments on the applicability of the nest-site selection process to optimization in Section 4. We finish with a summary and conclusions in Section 5.
tight cluster around the queen. Scouts now leave the swarm to search for potential nest sites such as tree hollows or crevices in buildings. Only about 5% of the bees engage in the nest-site selection process while the rest will stay clustered around the queen (Seeley et al. (1979)). If a scout has found a suitable cavity, it will assess its quality (i.e., volume, height, aspect of the entrance, and entrance size) (Seeley and Morse (1978)). If the site is of sufficient quality, the scout returns to the swarm cluster and performs a waggle dance to advertise the site. The dance encodes the direction and distance to the site. The number of dance circuits in the first dance performed by a returning scout is positively correlated with the scout’s perception of the site’s quality. By following a dance, bees can learn about the nest-site’s location, visit it and then independently evaluate its quality. After finishing its dance, the scout revisits the site for re-evaluation, which is again followed by returning to the cluster and advertising the site. The number of dances a scout performs for the same nest-site over consecutive visits decreases by around 16 dance circuits (Seeley and Visscher (2008)) per visit regardless of the site’s quality (Seeley (2003)). This implies that sites of high quality will be advertised for longer than sites of poor quality due to the higher number of initial circuits. Thus over time more individuals are recruited to high quality sites compared to sites of lower quality. While inspecting a potential nest site, a scout also assess how many other scouts are present at that site. A specific site is chosen if the number of scouts present exceeds a certain threshold (“quorum”). Scouts then return to the swarm and start “piping” on the swarm cluster. Piping constitutes an auditory signal produced by wing vibration (Seeley and Visscher (2003)), it informs the swarm members that a decision has been made and prepares them for lift off (Visscher and Seeley (2007)). Once a swarm is airborne it will fly towards the chosen site. The exact mechanism underlying the guidance process is still debated. A well established hypothesis is that informed scouts guide the swarm towards a new location by flying rapidly through the swarm in the direction of the nest site (Schultz et al. (2008); Latty et al. (2009)). Finally after reaching the new nest-site the bees move in and establish a new colony.
Nest Site Selection in Honey Bees
Bee Nest Site Selection as an Optimization Process
One of the most impressive examples of decentralized decision-making in animals is how bees decide on a new home. When a bee colony reaches a certain size it will start to reproduce and rear new queens. Once the young queen is nearly mature, the old queen leaves the old nest in order to give way for her daughter queen (Winston (1987)). After leaving the nest the homeless swarm temporarily settles on a branch of a tree or on an overhang forming a
This section introduces a model of the honeybees’ nest-site selection process. It extends a previous model developed by Janson et al. (2007) by including spatial features of nest sites in the model. This extension allows studying the impact of different spatial nest-site distributions. We also introduced noise in the system that affects the scout’s perception of the site’s quality. We use our model to test the applica-
Proc. of the Alife XII Conference, Odense, Denmark, 2010
627
bility of nest-site selection to optimization problems. The reader should be aware that any observed optimization will be coarse and slow. This is because the presented model is intended for biological simulations and has not been adjusted for optimization. Nevertheless it will allow us to assess the optimization potential of the nest-site selection process. The model only simulates a fraction of the swarm i.e., the bees involved in the decision-making process during nestsite selection. The model operates in discrete time-steps with each time step corresponding to 1 second of real time. As bees need to find potential nest sites in a spatial environment such a fine temporal resolution is crucial. Real bees are able to travel with a maximum speed of 5 meters per second (Beekman et al. (2006)), thus any coarser time resolution would lead to scouts missing potential nest sites by simply flying over it. At every simulation-step each bee is in a behavioral state associated with nest-site selection and will act accordingly. Some states E have an associated specific mean duration time TE . The exact duration is determined by T (E) = λ · TE , where λ = µ/10 is a scalar factor, with µ being drawn from a chi-square distribution with mean value 10 ( χ2 (10)). Note that this leads to an expected value of 1 for λ. There are 8 possible behavioral states: • REST: The bee is on the swarm but currently not involved in nest-site selection • SEARCH: The bee is on the swarm and tries to find a dance to follow • SCOUT: The bee searches the surroundings for potential nest sites
Figure 1: State diagram of individual behavior underlying nest-site selection. Reprint from Janson et al. (2007) Resting A resting bee will engage in the nest-site selection process by starting to search for a dance to follow with a probability of Prest = 0.002 per second (Beekman et al. (2007)). A searching bee will switch to the resting state with the same probability.
Figure 1 depicts a state diagram that outlines a bee’s state transitions in the model. In the following the behavior that corresponds to the different states will be explained in more detail.
Searching The number of dances that are performed on the swarm for potential nest-sites affects the likelihood of a searching bee finding and joining a dance. Let D be the number of dances currently performed on the swarm. The probability that a searching bee will locate a dance is given by Pf ind = 0.005 · D. If it is able to find a dance it is randomly assigned to one of the available dances. Experimental studies have shown that dances comprised a maximum of 7 followers. The probability that a bee will start to follow the dance it was assigned to is thus given by Pf ollow = 0.2min{2,f } , with f denoting the number of bees already following the dance. The longer a searching bee is unable to find and join a dance, the more likely it becomes that it will switch to proactive scouting behavior and try to find a suitable nest-site itself. The probability that a bee switches from searching to scouting behavior is given by Pscout (t) = t2 /t2 + θ2 where t denotes the number of time steps of unsuccessful searching and θ = 4000. Note that this switching mechanism modulates the exploration/exploitation rate of the swarm. Scout-
Proc. of the Alife XII Conference, Odense, Denmark, 2010
628
• ASSESS: The bee is at a potential nest site and assesses its quality • DANCE: The bee is on the swarm and dances for its preferred site • FOLLOW: The bee is on the swarm and has found a dance and follows it • RECRUITED: The bee flies to the nest site advertised in the dance it followed • MISS: The bee misread the dance and searches the surrounding of the swarm unsuccessfully before returning to the swarm
ing is very likely when only few or low quality nest-sites have been found and thus only a few dances are available. When many sites have been found and dances are abundant, a searching bee is likely to find a dance to follow and will become a recruit instead of a scout. Scouting Lindauer observed that bees usually scout the surroundings for about 20 minutes before returning to the swarm (Lindauer (1955)). We thus used a mean scout duration time of Tscout = 1200. While scouting the virtual bees move through a 2-dimensional environment in search of potential nest sites. This is a major difference to the previous model where scouting was modeled probabilistic. The scouting process can be divided into two phases: 1. scouting: a bee will scout as long as it is able to be back at the swarm after Tscout time steps. 2. returning: if the remaining scouting time is smaller or equal to the time needed to return to the swarm a scout returns to the swarm. In nature a bee can spot a target if the target subtends the bee’s visual angle αmin which can range between five and fifteen degrees (Giurfa et al. (1996)). The diameter of nest boxes normally used in nest-site selection experiments is around 40cm. Given an assumed minimal angle of αmin = 8 degrees, a scout can spot a nest site up to a distance of approximately 280cm. After a successful discovery a scout will immediately start to assess the site and thus change its state. Scouting Strategy Please note that the exact way scouts search the environment is still unknown. Some studies suggest that bees search in a scale-free fashion (Reynolds et al. (2007)) but this is still debated (Benhamou (2008)). In this model the scouts’ search strategy is realized as an intermittent search strategy (Benichou et al. (2005)). When starting to scout a bee will choose a random location within a search area that is defined by the range of locations that are reachable within one third of its available scouting time Tscout . After reaching the chosen location a scout will start to search the surrounding for potential nest-sites using a correlated random walk (CRW) (Bartumeus et al. (2005)) with a fixed movement length of 1m per step and a correlation parameter value of ρ = 0.5 resulting in slightly correlated movement steps. Flying towards a destination Scouts fly towards a destination with a travel-speed of 5m/sec. A scout is placed on its destination (i.e., reaches it) when its distance to the destination is less than 5m. Angular noise from a uniform random distribution ηf ly (−22.5 ≤ ηf ly ≤ 22.5) was added to prevent bees from flying in straight lines.
Proc. of the Alife XII Conference, Odense, Denmark, 2010
Site assessment After locating a potential nest site a scout will immediately start to assess it. In nature nest-site assessment usually lasts for about 10 minutes Lindauer (1955) which corresponds to mean assessment duration time of Tassess = 600. In the model each nest site S is associated with a certain quality QS (0 ≤ QS ≤ 100). When assessing a nest site a bee will perceive the quality. Quality is always perceived with some noise, thus Q(S) = QS + δ, with δ drawn from a normal distribution N (0, σ 2 ) with a standard deviation of σ = 10. A bee will only dance for a given nestsite S if the perceived quality Q(S) exceeds a bee’s quality threshold Φ. Otherwise the bee will switch to search behavior after returning to the swarm. Here a uniform threshold value Φ = 50 is used for all individuals. Dancing If a bee discovered a suitable nest site S while scouting it will advertise it after returning to the swarm by means of a waggle dance. The number of waggle runs performed during a dance depends on the perceived quality of the site Q(S) and the number of consecutive visits to the site. Based on empirical data (Seeley (2003)), the virtual bees perform Q(S) waggle runs after their first visit to the site and Q(S)−16(k −1) after the kth return. Bees will stop promoting a site (i.e., stop dancing) and switch to searching and if Q(S) − 16(k − 1) ≤ 0 . A waggle run encodes the distance and the direction to the potential nest site. This has also been incorporated into the model’s dance behavior. Based on empirical data (Gardner et al. (2008)) we assume that a waggle phase lasts 2.4sec per kilometer of distance to the potential nest site plus 1.5 sec for the return phase. Following A bee following a dance will follow the dance until the dancer ceases dancing. If the follower had previously visited the advertised site, it will find that site again. Otherwise the probability of correctly locating the advertised site depends on the number of waggle runs w the bee followed. Based on experimental data (Mautz (1971)) the probability of finding a nest site is Pf indSite (w) = s(w)/1.5 · u(w) + s(w) where w denotes the number of folp lowed waggle runs, u(w) = 1 − 1/ (w + 1) represents the distribution of unsuccessful bees and s(w) = w2 /(w2 + θ) with θ = 60 represents the distribution of successful bees. Successfully recruited to nest site A successfully recruited bee flies towards the proposed nest site and assesses its quality. If it finds its quality sufficient (i.e., Q(S) > Φ), the bee will advertise the site after returning to the swarm. Otherwise it will search for new dances after its return to the swarm. Missing the advertised nest site If a bee is not able to read a dance correctly it will not be able to find the advertised site. In such cases, the bee flies the same distance as the advertised site, but in a slightly wrong direction. In the
629
500 400 300 200 100
To investigate the optimization potential of the honeybee’s nest-site selection process, we performed three experiments using the model described above. Unless stated otherwise we used the parameter values mentioned in the last section. We present the results as average values obtained from 10 independent runs. The number of individuals used in the experiments was set to n = 500, which corresponds to the number of bees involved in nest-site selection in real honey bees.
Number of bees at site
Experiments
Nest 1 Nest 2 Quality Switch
0
model this is achieved by adding a maximum of 5 degree noise drawn from a uniform random distribution to the actual direction towards the advertised nest site. After reaching the wrong location a bee searches the surroundings for 400sec.
0
5
10
15
20
25
30
Hour
Figure 2: Time evolution of the number of bees assessing a nest site where the site qualities change occur every 28800 simulation steps. Error bars represent the standard deviation.
Experiment 1: Nest-site selection in a dynamic environment This experiment was performed to test how the nestsite selection process performs in a dynamic environment. While a change in a site’s quality during the selection process is unlikely to occur in nature, changing or moving optima are ubiquitous in dynamic optimization problems. The environment contains two potential nest sites n1, n2 that are located in opposite directions 150m away from the swarm’s position. Initially site n1 is of good quality qgood = 75 while n2 is of bad quality qbad = 45. The sites qualities however switch during the course of the simulation i.e., at every interval of 28800 simulation steps (i.e., every 8 hours) the qualities of the nest sites are swapped. A simulation runs for 32 hours corresponding to 115200 simulation steps and thus a total number of 3 quality switches occur during one run. As the search process is performed in a spatial environment it is likely that a swarm only discovers one nest site or even none. Additionally a swarm might forget a low quality nest-site as dances might not sustain during the low quality period. In order to ensure that the swarm is aware of both sites each time a quality change occurs, a randomly chosen bee will start dancing for the nest site that was of low quality but switched to high quality. Figure 2 depicts the time evolution of the number of bees at each nest site. As can be seen the swarm is able to quickly adapt to changes in nest-site quality. The number of bees at a given nest-site will not exceed ≈ 400 because a fraction of the swarm is resting, very few will still scout for different nest-sites and bees at a given nest-site will return to the swarm to promote it. In terms of optimization this process is still rather slow as it takes the swarm approximately 2 hours to adapt to the change in quality. Slow adaption is not necessarily a disadvantage as it makes a swarm resilient against noise. As pointed out before quality changes are unlikely to happen in nature, however discovering new sites in the course of the selection process constitutes a similar change
Experiment 2: Nest-site selection in a noisy environment Here we tested whether the swarm is capable of selecting a stable mediocre quality nest site and disregard a site of sometimes high but very unstable quality. The number of bees and the number and position of the potential nest sites is the same as in Experiment 1, however here the quality of nest site n2 is kept constant at mediocre level qmediocre = 55 whereas the quality of site n1 changes at an interval of 1800 simulation steps (i.e., every 30 minutes) alternately between good qgood = 75 and very bad qvbad = 35. A simulation again lasted for 115200 simulation steps corresponding to 32 hours. To ensure that the swarm is aware of both sites, a random bee starts dancing for each site in the first simulation step. Figure 3 depicts the time evolution of number of bees at the two nest sites. Clearly the majority of the swarm selects the stable mediocre nest site. At the start of a simulation the number of bees builds up quickly at both nest sites, due to the fact that one bee starts to dance for each site at the first simulation step. However, over the course of revisiting the sites, more bees get recruited towards the mediocre stable site. The revisit behavior of honeybees plays a key role in that respect. Initially site n1 will be promoted stronger than site n2 due to the quality difference. The ongoing revisitation will cause recruited and dedicated bees to abandon the unstable site and choose the stable site as it makes it pos-
Proc. of the Alife XII Conference, Odense, Denmark, 2010
630
in the swarm’s environment. Without the ability to react to changes in the environment, a swarm can get stuck in a suboptimal solution if it finds a nest site of mediocre quality early in the decision-making process. In terms of optimization, adapting to a dynamic environment is an interesting aspect, as it can be applied to the detection of changing locations of the optima in problems with dynamic fitness functions.
800 600 400
Function Value
0
200
500 400 300 200 100 0
Number of bees at site
Nest 1 Nest 2
0
5
10
15
20
25
0
30
5
Hour
10
15
Number of Nest Reloactions
Experiment 3: Function optimization via iterative nestsite selection The European honey bee Apis mellifera has very specific requirements regarding its nest site. This is because once a decision is made it is final (i.e., a swarm is very unlikely to relocate after moving into a new nest site). In contrast open nesting bee species such as the Asian Dwarf honey bee Apis florea are quite flexible and a swarm might relocate if its initial decision was suboptimal (Oldroyd et al. (2008)).
2500 1500
Function Value
500
sible for the individuals to gain awareness of the changing quality. Site n1 will never be completely abandoned simply because some visiting bees will always experience it as a very good nest site and thus promote and revisit it. In general this experiment demonstrates that the nest-site selection mechanism is to some extent resilient towards noise.
(a) Sphere
0
Figure 3: Time evolution of the average number of bees assessing a nest site when the nest site of high quality is very unstable. The quality of nest site n1 changes each 1800 simulation steps between qgood = 75 and qvbad = 35, whereas the quality of nest site n2 is kept constant at qmediocre = 55. Error bars represent the standard deviation.
0
2
4
6
8
10
Number of Nest Reloactions
(b) Booth
Figure 4: Boxplots of the quality of the occupied nest site over several relocations for the two test functions.
Such an iterative selection process as found in Apis florea can lead to an optimization in an environment with many potential nest sites. In this experiment it is assumed that the swarm’s environment corresponds to the search space of a continuous function that needs to be minimized. Each position in the search space corresponds to a potential site, and its quality corresponds to a value of the function at that posi-
tion. The test functions used in the experiment and their associated parameter values are given in Table 1. Initially the swarm is placed at position [-20,-20] for the Sphere function and [-10,-10] for the Booth function. For this experiment we changed the bees’ scouting behavior because the first version of the extended model is modeled on the behavior of the European honey bee Apis mellifera where a scout assesses a nest site for a certain period of time before returning to the swarm. As each location corresponds to a potential nest site, scouts would immediately start to assess sites after a single scouting step. To overcome this, a scout will advertise the best position it found during its scouting period, if the quality of that position is better than quality of the swarms current location. The quality of a newly discovered site depends on the quality difference regarding the current location of the swarm. If a scout discovers a nest site that is X% better than the swarm’s current location this site is assigned quality X. While recruits fly towards a site that was advertised by a dancing bee, they will actively monitor the quality of the
Proc. of the Alife XII Conference, Odense, Denmark, 2010
631
Sphere
n X
fsp (~ x) =
R x2 i
i=1
Booth
fbt (~ x) = (x1 + 2x2 − 7)2 + (2x1 + x2 − 5)2
[−25; 25]n [−10; 10]n
Table 1: Test functions and domain space range (R). The dimension of each function is 2.
locations they fly over. If they encounter a better site on their way, they abandon their initial choice and become scouts. Recruits that fail to locate an advertised site also become scouts. Nest sites are assessed by recruits and returning bees for a certain amount of time. During that time each assessing bee counts the number of other bees present at the site. If the number of bees at the site reaches a given quorum q = 10 the swarm is placed on this new site and the nest-site selection process is restarted. The parameter values used in this experiment are: step size step = 0.1, scouting time Tscout = 100, and assessment time Tassess = 20. A simulation run is stopped when a swarm does not relocate within 3600 simulation steps. The changes in the quality of the found sites for both test functions over several nest-site relocations is depicted in Figure 4. The bees are able to iteratively optimize the position of the swarm within the search space (i.e., minimize the function value). However the optimization process is limited by several factors: as scout time Tscout and step size step are fixed, scouts are only able to explore a certain range around the swarm’s current location whereas a fixed step size prevents scouts from finding better solutions as they are likely to fly over them. This is critical when the swarm is close to the global optimum and scouts would need to search on a finer scale in order to find better positions. Another limiting factor is the quality assignment. As the quality difference between solutions decreases around the global optimum the model will always reach a point were better solutions are not selected any more as the quality difference between them is too low. The performance of the nest-site selection process in function optimization is yet by no means comparable to the performance of other optimization algorithms (e.g., Aderhold et al. (2010)). In order to use the nest-site selection paradigm in an algorithm for real optimization problems, the swarm needs to become more sensitive to small quality differences to identify better potential sites when the swarm comes closer to the location of an optimum. The speed of the decision-making process depends on the quorum q used. The higher q the more bees are needed at a potential nest before the swarm changes its location and the slower the optimization process. The quorum mechanism can however also prove to be useful in terms of optimization, as the existence of a quorum prevents a premature convergence onto local minima, as it gives the bees time to find better sites. Another potential benefit of the quorum is that it requires bees to revisit and reassess a given site several times which is important for dynamic or noisy optimization functions.
Conclusion
restricted to using the bees’ foraging behavior and mating behavior. Here we proposed to use the bees’ nest-site selection behavior for developing bee inspired optimization techniques. Nest-site selection involves the active discovery of potential sites by scout bees and a decision on the best site. In nature it enables bees to solve the best-of-n-problem (i.e., deciding on the best nest-site). Nest-site selection is thus a decision-making process that has a clear optimum which is in contrast to foraging which mainly regulates the distribution of foragers over available food sources. We used a model of the nest-site selection process of real bees to investigate its optimization potential. Using this model, we performed three optimization experiments. Our results suggest that the nest-site selection process is able to make the best decision even in dynamic and noisy environments and that the process can detect and decide on the best stable solution even when better but noisier solutions are present. The final experiment demonstrated how an iterative application of the nest-site selection process could be used for function optimization. Our results corroborate that the honey bee’s nest-site selection process is indeed useful in the context of optimization. Future work will involve developing an bee inspired optimization scheme that is based on nest-site selection.
Acknowledgments This work was supported by the Human Frontier Science Program Research Grant ”Optimization in natural systems: ants, bees and slime moulds”.
References Abbass, H. A. (2001). Marriage in honeybees optimization (mbo): A haplometrosis polygynous swarming approach. In Proceedings of the Congress on Evolutionary Computation, pages 207–214. Aderhold, A., Diwold, K., Scheidler, A., and Middendorf, M. (2010). Nature Inspired Cooperative Strategies for Optimization (NICSO 2010), chapter Artificial Bee Colony Optimization: A New Selection Scheme and Its Performance, pages 283–294. Springer Berlin / Heidelberg. Bartumeus, F., Luz, M. G. E. D., Viswanathan, G. M., and Catalan, J. (2005). Animal search strategies: a quantitative random– walk analysis. Ecology, 86(11):3078–3087. Beekman, M., Fathke, R., and Seeley, T. (2006). How does an informed minority of scouts guide a honey bee swarm as it flies to its new home? Animal Behavior, 71(1):161–171. Beekman, M., Gilchrist, A. L., Duncan, M., and Sumpter, D. J. T. (2007). What makes a honeybee scout? Behavioral Ecology and Sociobiology, 61:985–995. Benhamou, S. (2008). How many animals really do the levy walk? Ecology, 89:2351–2352.
Recently bee inspired optimization techniques have become popular within the optimization community but have been
Benichou, O., Coppey, M., Moreau, M., Suet, P.-H., and Voituriez, R. (2005). Optimal search strategies for hidden targets. Physical Review Letters, 94:198101.
Proc. of the Alife XII Conference, Odense, Denmark, 2010
632
Blum, C. and Merkle, D., editors (2008). Swarm Intelligence: Introduction and Applications. Springer Berlin / Heidelberg. Bonabeau, E., Dorigo, M., and Theraulaz, G. (1999). Swarm intelligence: from natural to artificial systems. Oxford University Press. Chong, C. S., Low, M. Y. H., Sivakumar, A. I., and Gay, K. L. (2006). A bee colony optimization algorithm to job shop scheduling. In Proceedings of the 2006 Winter Simulation Conference. Dorigo, M. and St¨utzle, T. (2004). Ant Colony Optimization. MIT Press. Eiben, A. E. and Smith, J. E. (2003). Introduction to Evolutionary Computing. Springer Berlin / Heidelberg. Fuchs, S. and Schade, V. (1994). Lower performance in honeybee colonies of uniform paternity. Apidologie, 25:155–168. Gardner, K. E., Seeley, T. D., and Calderone, N. W. (2008). Do honeybees have two discrete dances to advertise food sources? Animal Behaviour, 75:1291–1300. Giurfa, M., Vorobyev, M., Kevan, P., and Menzel, R. (1996). Detection of coloured stimuli by honeybees: minimum visual angles and receptor specific contrasts. Journal of Comparative Physiology A, 178:699–709. Haykin, S. (1999). Neural Networks: A Comprehensive Foundation. Prentice Hall. Janson, S., Middendorf, M., and Beekman, M. (2007). Searching for a new home – scouting behavior of honeybee swarms. Behavioral Ecology, 18:384–392. Jones, J., Myerscough, M. R., Graham, S., and Oldroyd, B. P. (2004). Honey bee nest thermoregulation: diversity promotes stability. Science, 305:402–404. Jung, S. H. (2003). Queen-bee evolution for genetic algorithms. Electronics Letters, 39(6):575–576. Karaboga, D. (2005). An idea based on honey bee swarm for numerical optimization. Technical Report TR06, Erciyes University, Engineering Faculty, Computer Engineering Department. Karaboga, D. and Akay, B. (2009). A survey: algorithms simulating bee swarm intelligence. Artificial Intelligence Review. Karci, A. (2004). PRICAI 2004: Trends in Artificial Intelligence, chapter Imitation of Bee Reproduction as a Crossover Operator in Genetic Algorithms, pages 1015–1016. Springer Berlin / Heidelberg. Latty, T., Duncan, M., and Beekman, M. (2009). High bee traffic disrupts transfer of directional information in flying honeybee swarms. Animal Behaviour, 78:117–121. Lindauer, M. (1955). Schwarmbienen auf Wohnungssuche. Zeitschrift f¨ur vergleichende Physiologie, 37:263–324. Mautz, D. (1971). Der Kommunikationseffekt der Schw¨anzelt¨anze bei Apis mellifera carnica. Zeitschrift f¨ur vergleichende Physiologie, 72:192–220.
Proc. of the Alife XII Conference, Odense, Denmark, 2010
Oldroyd, B. P., Gloag, R. S., Even, N., Wattanachaiyingcharoen, W., and Beekman, M. (2008). Nest-site selection in the opennesting honey bee apis florea. Behavioral Ecology and Sociobiology, 62:1643–1653. Pham, D., Ghanbarzadeh, A., Koc, E., Otri, S., Rahim, S., and Zaidi, M. (2006). The bees algorithm a novel tool for complex optimisation problems. In Proceedings of IPROMS 2006 Conference, pages 454–461. Poli, R., Kennedy, J., and Blackwell, T. (2007). Particle swarm optimization: An overview. Swam Intelligence, 1:33–57. Reynolds, A. M., Smith, A. D., Menzel, R., Greggers, U., Reynolds, D. R., and Riley, J. R. (2007). Displaced honey bees perform optimal scale-free search fights. Ecology, 88:1955–1961. Sato, T. and Hagiwara, M. (1997). Bee system: finding solution by a concentrated search. In IEEE International Conference on Systems, Man, and Cybernetics, 1997. ’Computational Cybernetics and Simulation’. Schultz, K. M., Passino, K. M., and Seeley, T. D. (2008). The mechanism of flight guidance in honeybee swarms: subtle guides or streaker bees? Journal of Experimental Biology, 211:3287–3295. Seeley, T. (2003). Consensus building during nest–site selection in honey bee swarms: the expiration of dissent. Behavioral Ecology and Sociobiology, 53:417–424. Seeley, T. and Buhrman, S. (2001). Nest–site selection in honey bees: how well do swarms implement the ”best-of-n” decision rule. Behavioral Ecology and Sociobiology, 49:416–427. Seeley, T. and Visscher, P. K. (2008). Sensory coding of nest-site value in honeybee swarms. Journal of Experimental Biology, 211:3691–3697. Seeley, T. D. and Morse, R. A. (1978). Nest site selection by the honey bee, apis-mellifera. Insectes Sociaux, 25:323–337. Seeley, T. D., Morse, R. A., and Visscher, P. K. . (1979). The natural history of the flight of honey bee swarms. Psyche, 86:103–113. Seeley, T. D. and Visscher, P. K. (2003). Choosing a home: how the scouts in a honey bee swarm perceive the completion of their group decision making. Behavioral Ecology and Sociobiology, 54:511–520. Teodorovic, D. and Dell’Orco (2005). Bee colony optimziation a cooperative learning approach too complex transportation problems. In Advanced OR and AI Methods in Transportation. Proceedings of the 10th Meeting of the EURO Working Group on Transportation. Visscher, P. K. and Seeley, T. D. (2007). Coordinating a group departure: who produces the piping signals on honeybee swarms? Behavioral Ecology and Sociobiology, 61:1615– 1621. Winston, M. L. (1987). The Biology of the Honey Bee. Harvard University Press.
633