lies (ACF) selected Mathematica Policy Research and its .... ren are Hispanic/Latino and another third are .... Federal Interagency Forum on Child and Family.
Beginning Head Start: Children, Families and Programs in Fall 2006 December 2008
F
A
C
E
S
Louisa Tarullo, Jerry West, Nikki Aikens & Lara Hulsey
Contract No.: HHSP23320052905YC MPR Reference No.: 6202-135
Beginning Head Start: Children, Families and Programs in Fall 2006 FACES 2006 Baseline Report December 2008
Louisa Tarullo Jerry West Nikki Aikens Lara Hulsey
Submitted to: Office of Planning, Research and Evaluation Administration for Children and Families U.S. Department of Health and Human Services 370 L’Efant Promenade Washington, DC 20447 Project Officer: Maria Woolverton
Submitted by: Mathematica Policy Research, Inc. 600 Maryland Ave. S.W., Suite 550 Washington, DC 20024-2512 Telephone: (202) 484-9220 Facsimile: (202) 863-1763 Project Director: Jerry West
INTRODUCTION
METHODS
The Head Start Family and Child Experiences Survey (FACES), was first launched in 1997 as a periodic, longitudinal study of program performance. Successive nationally representative samples of Head Start children, their families, classrooms, and programs provide descriptive information on the population served; staff qualifications, credentials, and opinions; Head Start classroom practices and quality measures; and child and family outcomes. FACES includes a battery of child assessments across multiple developmental domains. It also includes interviews with children’s parents, teachers, and program managers, and direct observations of classroom quality.1
The FACES 2006 sample provides information at the national level about Head Start programs, centers, classrooms, and the children and families they serve. A sample of Head Start programs was selected from the 2004-2005 Head Start Program Information Report (PIR),1 and approximately two centers per program and three classrooms per center were selected for participation. Within each classroom, an average of nine newly enrolled 3- and 4-year-old children were selected for the study.2 Sixty programs, 135 centers, 410 classrooms, 365 teachers, and 3,315 children participated in the study in the fall of 2006. Overall, 92 percent of the sampled programs and all of the sampled centers and classrooms participated in the fall.3 The parents of 89 percent of the sampled children consented to their children’s participation. Child assessments, parent interviews, teacher interviews, and teacher ratings were obtained for 95-98 percent of these children.4
FACES is a tool for measuring Head Start program performance at the national level. FACES collects data on successive nationally representative samples of the children and families served. It also seeks to examine the developmental progress of children and their families both during and following Head Start participation. This recurring data collection provides the means for assessing how the program is performing, currently and over time.
Data were collected over a four-month period in fall 2006 (September – December 2007). MPR data collection teams assessed the children at their Head Start centers, interviewed the children’s lead teachers, and interviewed the majority of children’s parents during week-long site visits.5 Teachers were asked to complete a set of ratings for each sampled child in their classroom using either a Web-based or paper instrument.
This brief profiles the Head Start children and families who were newly enrolled in the program in fall 2006, their home environments, and the Head Start classroom environments they entered. The first section of the report offers background on the study methodology and sample, followed by information on the children’s characteristics, family demographics and home life, and child cognitive, social-emotional, and health status at program entry. The final section details teacher and classroom characteristics.
Data from the direct child assessments are used here to report on children’s cognitive and physical outcomes when they first entered Head Start, and assessor ratings are used to describe children’s social-emotional outcomes. Parent and teacher ratings provide additional information about children’s social skills, approaches to learning, problem behaviors and academic and non-academic accomplishments at the beginning of the Head Start year. Parent interview data are also used to describe children’s backgrounds and home environments; teacher interview data are used to describe children’s first Head Start classroom experiences.
1
In 2005, the Administration for Children and Families (ACF) selected Mathematica Policy Research and its partners—Educational Testing Service, Juárez and Associates, and General Support Services—to design and conduct FACES 2006.
1
about their educational backgrounds, professional experience, and credentials.
Direct Child Assessments. The fall battery of direct child assessments included a set of standardized preschool assessments designed to measure children’s cognitive outcomes (language, literacy, and mathematics) and physical outcomes (height and weight) through an untimed, one-on-one assessment of each child. The actual measures used are described later in this brief, where we report on children’s cognitive scores at the beginning of the Head Start year.
Teachers were asked to report on the learning activities that are scheduled in their classrooms. They were asked to estimate the amount of time they spend on both teacher-directed activities and child-selected activities in a typical day, as well as how often the children in the class participate in various language and literacy development and mathematics activities. Teachers were asked a series of questions on whether they have a principal curriculum guiding the classroom activities and, if so, whether they received training in how to use it. They were also asked how they assess the children’s level of achievement and progress over the Head Start year.
The direct assessment began with a screening to determine whether children from households where English was not the primary spoken language should be assessed in English, assessed in Spanish, or not assessed at all.6 The assessments themselves used the standard material for each instrument (for example, stimulus and response pages from the PPVT-4 and Woodcock-Johnson measures). Computerassisted personal interviewing (CAPI) was used when administering the assessments to facilitate the movement from one measure to the next without the assessor’s having to calculate stopping or starting points. Assessors read the questions and instructions from a computer screen. The child responded by pointing to the correct answers on the assessment easel or by giving a verbal response. Assessors entered the child’s responses into a laptop computer using software that ensured that all basal and ceiling rules were followed.
Using a Teacher Child Report form, they were asked to rate each child on a set of items that assess the child’s accomplishments, cooperative classroom behavior, behavior problems, and approaches to learning. Teachers also provided reports of children’s developmental conditions. Interviewer Ratings. At the end of the one-onone testing sessions with children, the assessor completed a set of rating scales evaluating the child’s behavior in the assessment situation, including the child’s approaches to learning and any problem behaviors. Four subscales from the Leiter-R Examiner Rating Scales were used in FACES 2006: (1) attention, (2) organization/impulse control, (3) activity level, and (4) sociability. The 27 items and four subscales make up the cognitive/social scale.
Parent Interviews. FACES 2006 used a computer-assisted interview to collect information from Head Start parents in a variety of areas, including the characteristics of households (e.g., household income, number of adult household members, languages spoken in the home) and household members (e.g., age, race/ethnicity, relationship to study child). Information was also collected on parent-child relationships, aspects of the child’s home life, children’s child-care arrangements, and parents’ ratings of their children’s social skills and problem behaviors.
Population Estimates. The statistics found in this brief are estimates of key characteristics of the population of newly entering Head Start children and their parents and families, as well as the population of Head Start teachers serving them in fall 2006.7 The data used to report on child and family characteristics and child outcomes are weighted to represent all newly entering Head Start children.8 Teacher data are weighted to represent all teachers serving children entering Head Start for the first time in fall 2006.
Teacher Interviews and Teacher Child Reports. FACES 2006 also conducted computerassisted personal interviews with lead teachers
2
CHARACTERISTICS OF CHILDREN ENTERING HEAD START
with 63 percent in fall 2006. The racial/ethnic composition of the entering child population has shifted as well. In fall 2003, as compared with fall 2006, a higher percentage of first-time Head Start children were White (30 percent and 24 percent, respectively) and a smaller percentage were Hispanic (31 percent and 35 percent, respectively) (ACF 2006).
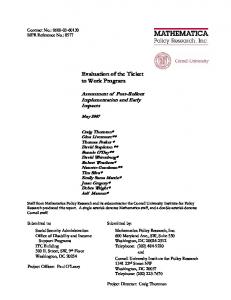
In fall 2006, approximately 458,000 children were newly enrolled in 14,400 Head Start centers across the U.S. About 49 percent of them were attending full-day Head Start programs and the rest were attending half-day programs. Almost two-thirds (63 percent) of first-time Head Start children are 3 years old and the others are 4 years old or older. Boys slightly outnumber girls, a pattern that is more pronounced among 4-year-olds (54 percent versus 47 percent, respectively). Just over a third of Head Start children are Hispanic/Latino and another third are African American (Figure 1). Newly entering 3year-olds are more likely to be African American than are newly entering 4-year-olds, while 4year-olds are more likely to be White or Hispanic than are 3-year-olds.
FAMILY ENVIRONMENT Children’s families and environment strongly influence their development. Large-scale family studies have found that children’s early health and development and later school achievement are all positively related to the resources families can devote to child-rearing, and that they are negatively related to risk factors in the home environment.9 Resources refer to factors that enhance a child’s growth and development, such as parents’ level of education, the amount of discretionary income the family has, and family health practices. Risk factors consist of conditions and events that pose a threat to development, such as minority language status, poor
The percentage of Head Start children who are 3 years old when they first enter the program has increased. In fall 2003, roughly 46 percent of newly entering children were age 3, compared Figure 1. Child’s Race/Ethnicity (percent) 40
37.8
37.2 34.9
35 28.8
30 25
33.2
32.7
24.9
23.5 20.4
20 15 9.0
10
9.3
8.5
5 0 White, non-Hispanic
African American, nonHispanic Total sample
Hispanic/Latino
3-year-olds
Other
4-year-olds
Source:
Fall 2006 FACES Parent Interview.
Note:
Statistics are weighted to represent all children entering Head Start for the first time in fall 2006.
3
Household Composition
maternal health, and living in unsafe neighborhoods. The more resources and the fewer risk factors, the better the prospects that the child will grow vigorously, develop the skills and behaviors that support learning, and eventually do well in school.
Most Head Start children live with at least one of their biological parents10 (96 percent) and very few live apart from their biological mother (6 percent). It is more common for these children to live apart from their biological father (52 percent).
In recognition of the important role that family plays in a child’s development, Head Start has made the family a cornerstone in its framework. Data from the 2006 FACES Parent Interview offer information on both resources and risks—in the family and household environment and in the neighborhood and community—that may directly or indirectly influence children’s outcomes and/or moderate the relationship between program participation and children’s outcomes. This section presents key findings on household demographic characteristics, the home learning environment and parenting practices, family health care and health status, and neighborhood characteristics as children enter Head Start for the first time.
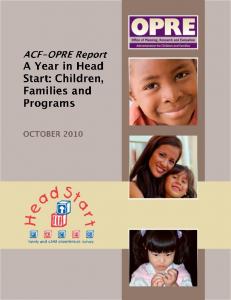
Less than half of newly entering Head Start children live with both of their biological parents (Figure 2). A similar percentage live with their biological mother only, while a few (2 percent) live with their biological father only. Thirty-two percent of children live in households with their married biological parents and 14 percent live in households where their biological parents are cohabiting. On average, Head Start children live in households with two adults and 2.6 children. Nearly one-third live in households with only one adult and 20 percent live with three or more adults. The majority of Head Start children live in households with other children (82 percent).
Figure 2. Family Members with Whom Child Resides (percent)
2.2
4.3
31.6
0.5
13.5 47.9
Biological/adoptivemother motheronly only Biological/adoptive Biological/adoptive father only Neither biological/adoptive parent Neither biological/adoptive parent Both parents - marital status unknown
Both parents – married Biological/adoptive father only Both parents – marital status unknown Both parents - married Both parents – unmarried Both parents - unmarried
Source:
Fall 2006 FACES Parent Interview.
Note:
Statistics are weighted to represent all children entering Head Start for the first time in fall 2006.
“
Parents” category includes both biological and adoptive parents.
4
Parent Education, Employment, and Income
where English is not the primary language spoken to them. Spanish is by far the most prevalent non-English primary language and is spoken to children in 23 percent of households. Spanish is the home language for 84 percent of the children who are spoken to in a non-English language, which is similar to the 86 percent reported in fall 2003 (ACF 2006).
Sixty-two percent of newly entering Head Start children’s mothers and 55 percent of their fathers have at least a high school education.11 Thus, a high percentage of Head Start children’s parents did not complete high school or earn a GED. Roughly half the children’s mothers work (52 percent), with a third working full-time (35 or more hours per week) and another 20 percent working part-time. A higher percentage of Head Start children’s fathers work (85 percent) and most work full-time hours (72 percent). Three quarters of children live in households where at least one parent works, and 59 percent of parents work full-time. The percentages of children’s mothers and fathers that work full-time and part-time are similar to those found among children who entered Head Start for the first time in fall 2003 (ACF 2006).
Cumulative Socioeconomic Risk Coming from a low-income family or singleparent household and having parents who did not complete high school are identified as risk factors for poor developmental and educational outcomes.13 Children with one of these risk factors are more likely to have others, and research has shown that having more than one risk factor can have negative consequences for children’s development and school readiness skills.14 In FACES 2006, a socioeconomic risk index was created as a measure of cumulative family risk. The number of risks is based on three characteristics of children’s living circumstances: whether the child resides in a single-parent household, whether the household income is below the federal poverty threshold, and whether the child’s mother has less than a high school diploma. Seventeen percent of entering Head Start children had none of these risks and 13 percent had all three. Most had either one (36 percent) or two of the risks (34 percent).
The median household income for Head Start children in fall 2006 is $18,292. Nearly nine in 10 children live in households where the income is less than or equal to 185 percent of the federal poverty threshold, and 58 percent live in households where income is less than or equal to 100 percent of the federal poverty threshold.12 In general, household incomes for newly entering White children tend to be higher than they are for other groups.
Parenting Practices and Home Activities Many Head Start children live in households that receive federal assistance. The most common type of assistance (received by 60 percent) is from the U.S. Department of Agriculture’s Women, Infants, and Children (WIC) program, followed by food stamps (53 percent). Three-yearolds are somewhat more likely to live in households that receive WIC than are 4-year-olds.
Head Start children participate in a variety of learning activities with their families, both in and outside of the home (Figures 3 and 4). The most common in-home learning activities—in which at least 90 percent of children’s families engaged in the past week—are playing with toys or games indoors; involving children in errands and household chores; talking about Head Start; and teaching letters, words, or numbers. The most common out-of-home activities involve family
Home Language Just over a quarter—27 percent—of newly entering Head Start children live in households
5
Figure 3. Family Activities with Child in Past Week (percent) 100
97.0
94.1
95.9 91.8
90
94.8
85.5 80.6
80 73.0 70
63.8
60 50 40 30 20 10 0 Told child a story
Taught child Taught child Worked with Played with Played a game, let ters, words, songs or music child on arts t oys or games sport, or or numbers and crafts indoors exercised together
Took child along on errands
Involved child Talked about in household Head Start chores
Source:
Fall 2006 FACES Parent Interview.
Note:
Statistics are weighted to represent all children entering Head Start for the first time in fall 2006.
Figure 4. Family Activities with Child in Past Month (percent) 90
85.4
80
74.3
70 60
52.9
50 40 30
33.0
32.5 26.9
20 11.9 10 0 Visited a library Went to a movie Went to a mall
Visited an art gallery, museum, or historical site
Visited a playground or park or had a picnic
Attended Attended athletic or church activity sporting event
Source:
Fall 2006 FACES Parent Interview.
Note:
Statistics are weighted to represent all children entering Head Start for the first time in fall 2006.
6
African American and Hispanic children (84 percent of White children are read to at least three times during the week, compared to 74 percent of African American children and 65 percent of Hispanic children). Children with multiple risk factors are less likely to be read to at least 3 times a week than are children with no risk factors, and home language minority children are read to by family members less often than are other children.
members’ taking the child with them to a playground or park, to the shopping mall, and to church activities; for each of these destinations, over half of families had taken their Head Start child in the past month. Almost 40 percent of newly entering Head Start children are read to by a parent or other family member every day, compared to 60 percent of all children ages 3 to 5 according to the 2005 National Household Education Survey (NHES; Federal Interagency Forum on Child and Family Statistics 2007.)15 Another 35 percent of Head Start children are read to at least three times a week.
Given the disparity in access to technology between low-income children and other children (The Henry J. Kaiser Family Foundation 2004), FACES includes questions about computer access and usage by Head Start children. More than half of newly entering Head Start children (53 percent) have access to a home computer.
The frequency of reading varies significantly by subgroup (Figure 5). White children are read to by family members more frequently than are
Figure 5. Family Member Read to Child at Least Three Times in Past Week (percent)
Source:
Fall 2006 FACES Parent Interview.
Note:
Statistics are weighted to represent all children entering Head Start for the first time in fall 2006.
7
Family Health
Almost half (47 percent) of newly entering children played computer games in the past week, while 22 percent used a computer for some other purpose in that time period.
Family health care practices and the health status of children’s caregivers can directly influence a child’s health, well-being, and development. Almost all newly entering Head Start children (99 percent) had a regular medical check-up in the past year, and 88 percent saw a dentist during that time.
The American Academy of Pediatrics’ guidelines recommend that children should watch no more than two hours of television a day (American Academy of Pediatrics 2001). Just over a fifth of newly entering Head Start children (21 percent) exceed this recommendation on a typical weekday. Children are most likely (47 percent) to watch television for one to two hours per day.
Most Head Start children (94 percent) have some type of health insurance. Health insurance coverage varies significantly by ethnicity. African-American children (97 percent) are more likely to have health insurance than are White (94 percent) and Hispanic (91 percent) children, due primarily to higher rates of Medicaid and SCHIP among this group of Head Start children. Hispanic children are more likely to be covered by private insurance than are other children (Figure 6).
FACES asked about rules and routines in the home. Parents report that 87 percent of newly entering Head Start children have a regular bedtime. More than half (55 percent) of Head Start children’s families eat dinner together every night, and another 18 percent eat dinner together five or six times a week. Two-thirds of Head Start children (67 percent) were disciplined using “time out” in the week prior to the parent interview, and 36 percent were spanked during that week.
Good nutritional choices and physical activity supported by parents at home can contribute to the development of healthy habits and help combat childhood obesity. Figure 7 shows
Figure 6. Types of Health Insurance, by Race/Ethnicity (percent) 100 90 7 7 .5
80 6 9 .6
70 60 50
6 6 .7
7 0 .0
5 5 .8 4 7 .3
4 3 .4
4 5 .5
40 30 20
1 2 .4 7 .1
10
6 .9
1 2 .3
9 .8 2 .8
1 .7
4 .1
0 P ri va te
M edic aid W h i te
S C H IP
A fr ic a n A m e ri ca n, N o n- H i s p a n ic
H is p a n i c/L a ti n o
O th e r O th e r
Source:
Fall 2006 FACES Parent Interview.
Note:
Statistics are weighted to represent all children entering Head Start for the first time in fall 2006. Percentages may sum to greater than 100 percent, because children can have more than one type of health insurance.
SCHIP = State Children’s Health Insurance Program.
8
Figure 7. Child Nutrition in Past Week (percent) 80
76.0 71.4
68.1
70 60 50 40 30
25.2
22.9
20 10 0 Drank milk at least Drank no soda, twice a day sports drinks, or non-100%-juice drinks
Ate no fast food
Ate sweets less than once a day
Ate salty snacks less than once a day
Source:
Fall 2006 FACES Parent Interview.
Note:
Statistics are weighted to represent all children entering Head Start for the first time in fall 2006.
symptoms among parents of newly entering Head Start children are measured using the CES-D Depression Scale (short form; Radloff 1977). The average parent score is 5.4, which is in the “mildly depressed” range. Nine percent of children’s parents report symptoms of severe depression, and another 10 percent report symptoms of moderate depression (Figure 8). Somewhat higher percentages of FACES 2000 parents reported symptoms of severe and moderate depression (ACF 2003). In FACES 2006, Hispanic/Latino children’s parents reported fewer depressive symptoms than other parents, but not in FACES 2000.
thresholds that indicate more healthy nutritional choices in areas that are particularly salient for young children, such as milk, soda, salty snacks, sweets and fast food. Based on parent report regarding the past week, 71 percent of Head Start children drink milk at least twice a day, 76 percent eat salty snacks less than once a day, and 68 percent eat sweets less than once a day. One-quarter avoid fast food completely, and 23 percent avoid soda and other sweetened beverages. The health status of a child’s caregiver can affect the child’s well-being by limiting the physical and emotional resources the caregiver can devote to the child.16 Seventeen percent of parents of newly entering Head Start children report their own health as fair or poor, and 12 percent report a health impairment that limits or prevents them from working. Over one-third of parents (35 percent) do not have health insurance.
Parent Perceptions of Their Home and Community Characteristics Living in an unsafe neighborhood and experiencing domestic violence can harm a child’s well-being and development. In FACES 2006, parents were asked about their own and their Head Start child’s exposure to neighborhood and domestic violence. Just over one-fifth of
The mental health of parents is also relevant to parental well-being and to parents’ interactions with their children. Self-reported depressive
9
Figure 8. Depressive Symptoms Among Parents (percent) 8.8
10.1
57.9 23.2
Not depressed
Mildly depressed
Moderately depressed
Severely depressed
Source:
Fall 2006 FACES Parent Interview.
Note:
Statistics are weighted to represent all children entering Head Start for the first time in fall 2006. In this figure, the term “parent” is used to refer to the primary caregiver who responded to the parent interview. Most respondents (87 percent) were the sample child’s biological mother, 7 percent were the sample child’s biological father, and the remaining 6 percent were other relatives or caregivers.
Child Care
parents (21 percent) witnessed nonviolent crime in their neighborhoods in the past year, and a similar percentage witnessed violent crime during this same period. The majority of those who witnessed crime in the neighborhood had seen it more than once during the year.
The NHES found that almost three-quarters (73 percent) of all non-kindergarten children ages 3 to 5 are in some type of nonparental care arrangement, and that these children spend an average of 28 hours per week in such care (Iruka and Carver 2006). Since many children attend half-day Head Start programs, and even full-day programs may not match the schedules of some working parents, FACES asked about child care arrangements before and after Head Start. Newly entering children spend an average of 23 hours per week in their Head Start program. Over a third of them (36 percent) are also cared for by someone other than their parents before or after Head Start (Figure 9), spending an additional 18 hours per week, on average, away from their parents. Children attending fullday Head Start programs are no less likely to be in child care than are those in half-day Head Start programs. However, among children in child care, those attending full-day Head Start
According to parent report, very few newly entering Head Start children witnessed any sort of violence in the past year, and even fewer had been victimized themselves. The most common type of violence was domestic violence—six percent of children witnessed domestic violence and one percent were victims of domestic violence themselves. Nearly a quarter of Head Start children have a member of their household who was arrested or charged with a crime during the child’s lifetime. Reports of experiences with crime, domestic violence, and family members’ involvement with the criminal justice system are all somewhat lower in FACES 2006 than in FACES 2000 (ACF 2003).
10
Figure 9. Child Care Arrangements Before and After Head Start (percent)
Source: Note:
Fall 2006 FACES Parent Interview. Statistics are weighted to represent all children entering Head Start for the first time in fall 2006. a
Center-based care includes wraparound care provided at the child's Head Start site that is not part of the Head Start program.
CHILD COGNITIVE DEVELOPMENT
programs are less likely to be in child care more than 15 hours a week.
A primary focus of FACES is to measure the knowledge and skills that children bring with them as they enter Head Start, find out how these skills vary across developmental domains, and assess how children’s skills progress over the Head Start year(s) and into kindergarten. The FACES 2006 instruments provide valid and reliable information on a wide range of child cognitive abilities and skills that are considered important to school readiness and later achievement. The research literature on early reading (for example, Whitehurst and Lonigan 1998, 2002) recognizes many components as pivotal in the process of learning to read, including language skills, knowledge of the conventions of print, phonological awareness, and emergent writing, among others. Early facility or difficulty in these areas is predictive of later reading performance.17 Similarly, math achievement in preschool and kindergarten is associated with math achievement in elementary school.18 In FACES 2006, information on child-
Care by a relative is the most common type of child care, received by 22 percent of newly entering Head Start children. Only 9 percent of children are cared for in a center-based program (including wraparound care provided at the Head Start site) in addition to Head Start, and 5 percent are cared for by a non-relative in a home-based setting. Child care usage varies significantly by subgroup. Hispanic/Latino children are least likely to be in child care before or after Head Start, particularly center-based care. African American children are more likely to be in relative care, and less likely to be in homebased non-relative care, than are White and Hispanic children. Use of any before- and aftercare, and particularly relative care, is somewhat more common for 3-year-olds than for 4-yearolds.
11
ren’s early language, literacy, writing, and math skills was obtained from both direct child assessments and parent reports.
Educational Battery, Third Edition (Woodcock, McGrew, and Mather 2001) and the Batería III Woodcock-Muñoz (Woodcock et al. 2004).22 To assess math skills, it included a supplemental set of math items from the Early Childhood Longitudinal Study, Birth Cohort math assessment.23 Parents also reported on children’s acquisition of skills and knowledge in the areas of language, writing, and math.
Instruments Used. FACES 2006 used the Simon Says and Art Show tasks from the Oral Language Development Scale (OLDS) of the PreLAS 2000 (Duncan and DeAvila 1998) to determine whether a child should receive the English or the Spanish version of the child cognitive assessment battery.19 Children were routed through the assessment based on their responses to these screening instruments.20 To assess children’s skills and knowledge, normand criterion-referenced measures of language, writing, and math development were directly administered to the children. To measure children’s receptive vocabulary in English and Spanish, the battery included the Peabody Picture Vocabulary Test, Fourth Edition (PPVT-4) (Dunn and Dunn 2006) and the Test de Vocabulario Imagenes Peabody (TVIP) (Dunn, Lugo, Padilla, and Dunn 1986).21 To measure children’s letterword knowledge and skills in applied problems and writing, it included the Letter-Word Identification, Applied Problems, and Dictation/Spelling subtests from the Woodcock-Johnson Psycho-
Children Assessed in English Children entering Head Start for the first time in fall 2006 score below the national norms on most measures of language, literacy, and math development (Figure 10). Head Start entrants score approximately one standard deviation below national norms on receptive vocabulary (85.4), one-third of a standard deviation below national norms on letter-word identification (93.9) and early writing (95.1), and two-thirds of a standard deviation below national norms on applied problems (89.8). These standard scores are similar to those of children assessed in FACES 2000 and 2003,24 with the exception of early writing scores, which are higher than those for prior cohorts.
Figure 10. Mean Standard Scores for all Children, the Bottom Quartile, and the Top Quartile Among Those Taking the Assessment in English 120
100.4
98.0
100
96.1
95.1
93.9
90.5
89.8
Mean Standard Scores (Fall 2006)
85.4 80
75.3
74.9 68.0
67.5
60
40
20
0 PPVT-4
WJ: Letter Word Identification Overall
Bottom quartile
WJ: Spelling
WJ: Applied Problems
Top quartile
Source:
Fall 2006 Direct Child Assessment
Note:
Statistics are weighted to represent all children entering Head Start for the first time in fall 2006.
12
of early writing and applied problems, differences in relative performance favor younger Head Start children.26 On measures without national norms, it is clear that entering 4-year-olds perform better in absolute terms. For example, parents report that 4-year-olds have more emergent literacy skills than 3-year-olds.
To assess children’s math skills beyond the areas of number and operations (topics measured by the Woodcock-Johnson Applied Problems test), the FACES 2006 assessment included items from the Early Childhood Longitudinal Study, Birth Cohort (ECLS-B). These items tap children’s skills in areas such as spatial abilities and pattern matching. On these additional items, newly entering Head Start children perform about one standard deviation below the nationally representative ECLS-B sample.25 For example, in the ECLS-B national sample, almost two-thirds of children were able to demonstrate number and shape skills, while only one-quarter of entering Head Start children could do so. Children in Head Start score in the middle range on the counting task (8.2 out of a possible 20) and on average can count up to 8 at the start of the program year.
Girls perform better than boys, among children entering Head Start, in the areas of receptive vocabulary, letter-word knowledge, and early writing. Girls are also more likely to demonstrate number and shape skills, and their parents also report that they have more emergent literacy skills than boys. White children score higher on applied problems than do African American and Hispanic/Latino children, while African American children score lower than both White and Hispanic/Latino children on ECLS-B math and ECLS-B number/shape proficiency. African American and White children score higher than Hispanic/Latino children in the areas of early writing and receptive vocabulary, and their parents also report that they have more emergent literacy skills than do parents of Hispanic/Latino children. Children with no family socioeconomic risks27 score higher in the areas of receptive vocabulary, letter-word knowledge, ECLS-B math, and ECLS-B number/shape proficiency than do children with two or more risks. Their parents also report that they have more emergent literacy skills than do parents of children with two or more risks.
Parents reported on skills such as recognizing letters of the alphabet, counting, writing or pretending to write, writing one’s own name, and identifying colors by name. On average, parents reported that entering children demonstrate two of five early writing, language, and math skills. Although Head Start children on average score below national norms, considerable diversity exists in the Head Start population (Figure 10). For example, mean standard scores for the highest quartile of children entering Head Start are at national averages in two areas: 98 in letter recognition, and 100 in early writing skills. However, in receptive vocabulary children in the highest quartile score, on average, 91, about two thirds of a standard deviation below national norms. Mean standard scores for the lowest quartile of Head Start children are one to two standard deviations below national averages across all measures.
Children Assessed in Spanish Like other Head Start children, children taking the assessment in Spanish score below national norms on all measures of language, literacy, and math development (Table 1). Head Start entrants assessed in Spanish score approximately one standard deviation below norms on receptive vocabulary in Spanish (84.9), two-thirds of a standard deviation below norms in early writing (88.2), and one and one-third of a standard deviation below norms on letter-word knowledge (79.3) and applied problems (82.4). These scores on norm-referenced measures are similar
Across measures with national norms, 3-yearolds entering Head Start perform closer to their same-age peers (nationally) than do entering 4year-olds across measures, suggesting that entering 4-year-olds may be relatively more disadvantaged, cognitively. For example, in the areas
13
Table 1. Summary Statistics for Fall 2006 FACES Child Assessment Standardized Score Data for Children Taking the Assessment in Spanish Mean Number of cases
Overall
SD
Bottom quartile
Top quartile
PPVT-4 Standard Score
172
63.4
11.0
49.5
68.5
TVIP Standard Score
372
84.9
11.1
71.8
88.4
WM3: Letter Word Identification Standard Score
190
79.3
10.7
69.6
83.7
WM3: Spelling Standard Score
374
88.2
11.1
73.4
93.1
WM3: Applied Problems Standard Score
302
82.4
12.8
67.4
86.8
Scales
Source:
Fall 2006 FACES Direct Child Assessment.
Note: Statistics are weighted to represent all children entering Head Start for the first time in fall 2006. Lower N’s for standardized score data on the WM: Letter Word Identification and PPVT-4 measures are the result of fewer cases having valid scores on these assessments.
receptive vocabulary, early writing, and applied problems.28 Girls taking the assessment in Spanish have higher early-writing scores than boys, but otherwise there are no differences in performance by gender. Children taking the assessment in Spanish also show no differences in language, literacy, or math performance based on number of family risks.
to the scores of the FACES 2000 children assessed in Spanish, with the exception of letterword knowledge, where FACES 2006 scores are lower. The skills of Head Start children who took the assessment in Spanish are less diverse than those of other Head Start children, and the top quartile of these children still score below norms. For example, the mean standard scores for the highest quartile of Spanish-speaking children are about one-third of a standard deviation below norms in early writing skills (93), one standard deviation below norms in letter recognition (84) and applied problems (87), and more than one standard deviation below norms in receptive vocabulary in English (69). The mean standard scores for the lowest quartile of children are at least one standard deviation below norms (e.g., 72 in Spanish receptive vocabulary and 73 in early writing skills), and in some instances their scores are less than a standard deviation lower than the top quartile.
Finally, children assessed in Spanish enter Head Start with skills that are behind the skills of language-majority children. For example, they enter with English receptive vocabulary skills approximately one standard deviation lower than those of other children (63 versus 85).
CHILD HEALTH AND PHYSICAL DEVELOPMENT A child’s health status is an integral part of wellbeing and development. In fact, health status can directly and indirectly affect school readiness and, the ability to pay attention in the classroom, participate in classroom activities, and attend school regularly.29 Parents and teachers reported on several aspects of children’s health and physical development, including disability status and health and developmental conditions or concerns. For the first time in FACES 2006, each child’s height and weight were measured
As with English-speaking children, newly entering 3-year-olds assessed in Spanish perform closer to their same-age peers than do entering 4-year-olds; this pattern is found in the areas of English receptive vocabulary, and in Spanish
14
to support analyses of risk for overweight or underweight.
average weight for newly entering children in Head Start are within age-norms, Head Start children have an average Body Mass Index (BMI)32 that is above average for their age range. In fact, about 17 percent of children entering Head Start for the first time are at risk for overweight, and 32 percent are overweight or at risk for overweight.33 In comparison, about 11 percent of first-time kindergartners in the Early Childhood Longitudinal Study-Kindergarten Cohort (ECLS-K) in 1998 were at risk for overweight (West, Denton, and Germino-Hausken 2000).34 Hispanic/Latino children are more likely to be overweight than children from other racial/ethnic groups, and children with 2 or more family risks are also more likely than those with no family risks to be overweight.
More than three-quarters of newly entering children in Head Start are rated as having “excellent” or “very good” health by their parents. Only a small percentage of children are reported as having “fair” or “poor” general health (6 percent). This pattern is consistent with parent reports in FACES 2003 and with national estimates of children whose families live below the poverty line (Federal Interagency Forum on Child and Family Statistics 2005). General health status varies by race/ethnicity and family risk. Parents of Hispanic/Latino children are less likely to rate them as having “excellent” or “very good” health than are parents of children from other racial/ethnic groups. They are more likely to rate them as having “fair” or “poor” health. Parents of children with 2 or more family socioeconomic risks are also less likely to rate them as having “excellent” or “very good” health than are parents of children with one or no family risks.
SOCIAL-EMOTIONAL DEVELOPMENT AND APPROACHES TO LEARNING In the context of a whole-child view of school readiness, children’s social-emotional development is recognized as being as important as cognitive skills and abilities in predicting later school success and well-being.35 A child’s abilities to regulate attention and emotion, to approach learning with interest and enjoyment, to persist when frustrated or challenged, to form and maintain friendships, and to interact positively with others are predictive not only of later social and emotional outcomes, but also of future learning. The preschool period may be a critical period for the development of the skills needed for social competence (Fabes, Gaertner, & Popp, 2006). Psychosocial risk factors may complicate children’s developmental trajectories. For example, young children who live in persistent poverty are at greater risk of enduring emotional problems, particularly internalizing behavior problems (Brooks-Gunn & Duncan, 1997). Preschool boys from low income homes and from homes with low maternal education are at greater risk of persistent problems with physical aggression (NICHD Early Child Care Research Network, 2004).
Head Start requires that at least ten percent of its enrollment slots be made available to children with an identified disability. Approximately 11 percent of newly entering Head Start children are reported by their teacher as having a disability, and nearly a quarter of those with a diagnosed disability are reported to have more than one impairment (Table 2).30 Among Head Start children identified by teachers as having a disability, speech and language impairments (80 percent) and cognitive impairments (23 percent) are the most common disabilities. This is consistent with prior FACES cohorts. Almost half of Head Start children with an identified disability have an Individual Education Plan (IEP) or Individualized Family Service Plan (IFSP) in the fall. Teachers report that a larger percentage of boys than girls have an identified disability. They also report that a larger percentage of White children have an identified disability than children of other racial/ethnic groups in Head Start. Childhood obesity is a growing health problem and is linked to other physical and psychological outcomes.31 Although both average height and
15
Table 2. Disability Categories for Children with Disabilities (Fall 2006) Disability Categorizations
Teacher Report
Percent of Children Children with Disabilities
10.9
Percent of Children with Disabilities Speech or Language Impairment Cognitive Impairment
80.5
a
Behavioral/Emotional Impairment
23.4 b
6.7
c
12.3
Physical Impairmentd
8.2
Child has IEP or IFSP
43.6
Sensory Impairment
Percent of Children With Disabilities Having Multiple Impairments 22.8 Source:
Fall 2006 FACES Teacher Child Report.
Note:
Statistics are weighted to represent all children entering Head Start for the first time in fall 2006.
Teachers were asked whether a professional had indicated that the child had a developmental problem, delay or other special need, and to indicate the specific need or disability. Percentages do not add to 100 because children can be reported to have more than one impairment across the impairment categories. a
Cognitive Impairment includes the following: mental retardation, autism/pervasive developmental delay, and non-categorical developmental delay. b
Behavioral/Emotional Impairment includes behavior problems, hyperactivity, and ADHD.
c
Sensory Impairment includes: deafness, other hearing impairment, blindness, and other visual impairment.
d
Physical Impairment includes motor impairments.
ment. Finally, using the Leiter-Revised Examiner Rating Scale (Roid and Miller 1997), assessors rated children’s behaviors during the assessment situation in such areas as attention, organization and impulse control, activity level, and sociability. Assessor ratings are the only socialemotional rating data that can be compared with normative data.
FACES 2006 provides multiple perspectives on children’s positive and challenging behaviors that may affect their ability to learn and interact with peers and adults. Teachers reported on children’s social skills, such as making friends easily and waiting his/her turn in games or other activities, as well as their problem behaviors in the classroom, such as being very restless and unable to sit still or disrupting ongoing activities. They also assessed children’s approaches to learning, such as their attitudes toward learning new things, motivation to perform well, and attention/persistence on learning activities. The approaches to learning measure was the Preschool Learning Behaviors Scale (PLBS; McDermott et al. 2000, McDermott et al. 2002).
Entering Head Start children show the expected developmental differences in levels in socialemotional readiness. Teachers report that 4year-olds have more social skills, more advanced approaches to learning and fewer problem behaviors than 3-year-olds. Parents of 4year-olds report observing more social skills in their children than parents of 3-year-olds. Based on the child’s behavior during the direct assessment, assessors also rate 4-year-olds as
Parents also reported on children’s social skills and problem behaviors in the home environ-
16
In summary, as Figure 11 shows, teachers report lower scores on overall approaches to learning (including attitudes toward learning, motivation, and attention/persistence) for younger children, boys, African American children, and children with more family risks as compared to their counterparts.
demonstrating more social/cognitive skills than 3-year olds. In addition to developmental differences, gender differences emerge in reports of Head Start children’s social skills and problem behaviors. Teachers and parents both report that boys have fewer social skills and more problem behaviors than girls. Among the types of problem behaviors that teachers report, boys show more hyperactive, aggressive, and withdrawn behavior problems than girls. Girls also earn higher scores from teachers on their overall approaches to learning, and higher ratings from assessors on their social/cognitive skills in the testing situation.
HEAD START TEACHERS AND CLASSROOMS An important aspect of the Head Start Program Performance Measures conceptual framework is the expected link between the receipt of quality services and improvements in child development (ACF 2003). To examine teacher and classroom characteristics that may relate to the quality of services for parents and children, in fall 2006 FACES conducted interviews with lead teachers in each classroom where sample children were enrolled. The data describe a variety of teacher characteristics including educational background, training, and professional experience. Teacher reports of classroom activities and curricula were also collected.36
Looking through the lens of child race/ethnicity, the picture is more mixed. Teachers report fewer behavior problems for Hispanic/Latino children in their classrooms than for African American and White children, as well as more social skills for Hispanic/Latino than for African American children. According to teachers, African American children score lower on attitudes toward learning and attention/persistence than do Hispanic/Latino and White children.
Teacher Characteristics Most Head Start teachers are female (98 percent) and more than half are between the ages of 30 and 49. More than three-quarters are White or African-American. Slightly larger percentages of teachers in fall 2006 are Hispanic/Latino, when compared with teachers in FACES 2000 and 2003 (19 percent compared with 16 percent and 17 percent, respectively; ACF 2008).
However, parents tend to rate children differently, with parents of Hispanic/Latino children reporting more behavior problems than parents of African American and White children, and parents of African American children reporting more social skills than parents of children in the other two groups. Understanding the home and cultural contexts that may shape these different impressions is important for Head Start staff communications with parents.
More than three-quarters of Head Start teachers have an Associate’s (AA) or Bachelor’s (BA) degree. Compared with teachers in FACES 2000 and 2003, a larger percentage of teachers have an AA or higher, although the percentage has been steadily climbing (57 percent in 2000, 72 percent in 2003, 80 percent in fall 2006). The percentage of teachers with a BA or higher in fall 2006 (40 percent) is similar to the percentages
Both parents and teachers rate children with fewer family risks as having fewer behavior problems and more social skills, as well as better motivation and attention/persistence. In addition, assessors rate children with fewer family risks as having better social/cognitive skills in the testing situation than children with more risks.
17
Mean Total PLBS T-Score (Fall 2006)
Figure 11. Children’s Total Preschool Learning Behaviors Scale (PLBS) T-Scores* 60 59 58 57 56 55 54 53 52 51 50 49 48 47 46 45
52.6
52.3 50.7
50.3 48.9
50.7 49.5
51 50
50.8 49.8
48.4
Source: Fall 2006 FACES Teacher Child Report. Note: Statistics are weighted to respect all children entering Head Start for the first time in fall 2006. *This score is a T-score set to have a mean of 50 and standard deviation of 10. T-scores illustrate a child’s performance relative to the population of first-time Head Start children as a whole. A high T-score for a subgroup indicates that the subgroup’s mastery level is greater than other groups in the population.
Curriculum
of teachers in FACES 2000 (40 percent) and 2003 (38 percent) . In addition, about half of Head Start teachers report having a Child Development Associate (CDA) certificate, and a third have a state-awarded teaching certificate or license or are currently enrolled in teacher training.
More than two-thirds of Head Start teachers in classrooms with entering children report using Creative Curriculum as their primary curriculum, up from 39 percent in 2000.37 The Creative Curriculum assessment tool was also the most frequently used, although by only 40 percent of teachers. The High/Scope Curriculum was used by 17 percent of teachers, and the High/Scope Child Observation Record (COR) was used by 11 percent of teachers. Ten percent of teachers reported using the Desired Results Development Profile (DRDP) as their assessment tool, which may be related to the fact that this rating system is required in most California programs. Another 40 percent of teachers reported using one of a
For the first time in FACES 2006, teachers were asked about their depressive symptoms, because teachers’ mental health status could affect their classroom behaviors and interactions with children. As Figure 12 shows, most Head Start teachers of entering children (63 percent) do not report elevated symptoms of depression. However, five percent of teachers report symptoms of severe depression, and another 9 percent report symptoms of moderate depression.
18
most common of these, reported by at least 75 percent of teachers as a daily or almost daily activity, are: letter naming, discussing new words, listening to the teacher reading stories where children can see the print, learning about conventions of printed materials, and practicing writing their own names. Compared to other activities, smaller percentages of teachers have children dictate stories to an adult, learn about rhyming words or listen to teachers read without viewing the print on a daily basis.
wide selection of assessment tools other than these three. Classroom Learning Activities We asked teachers about the types and frequency of learning activities in early literacy and mathematics that were commonly used in their classrooms. For most reading and language activities, more than half of teachers report engaging in the activities daily or almost daily. The
Figure 12. Depressive Symptoms Among Head Start Teachers (percent) 4.6 8.9
22 .9
63 .5
Not dep ressed
Mild ly depressed
Mo derately d epressed
Severely depr essed
Source:
Fall 2006 FACES Teacher Interview.
Note:
Statistics are weighted to represent all teachers serving children entering Head Start for the first time in fall 2006.
Compared to other activities, smaller percentages of teachers have children using creative movement to understand math concepts, working with rulers or other measuring instruments, or working on telling time on a daily basis.
FACES 2006 expanded what we know about mathematics activities in the classroom. More than half of teachers report engaging in various math activities daily or almost daily. Counting out loud with children is the most common math activity, which almost all teachers report doing with the children in their classes daily or almost daily. Other high frequency math activities, reported by at least 75 percent of teachers on a daily or almost daily basis, include: working with geometric and counting manipulatives, engaging in calendar-related activities, and engaging in activities that involve shapes and patterns.
19
REFERENCES
Duncan, G.J., and J. Brooks-Gunn. “Income Effects Across the Life Span: Integration and Interpretation.” In Consequences of Growing Up Poor, edited by Greg J. Duncan and Jeanne Brooks. New York: Russell Sage Foundation, 1997.
Administration for Children and Families. Head Start FACES 2000: A Whole-Child Perspective on Program Performance. Fourth Progress Report. Washington, DC: U.S. Department of Health and Human Services, 2003.
Duncan, G.J., and K. Magnuson. “Can Family Socioeconomic Resources Account for Racial and Ethnic Test Score Gaps?” Future of Children, vol. 15, no. 1, Spring 2005, pp. 35-54.
Administration for Children and Families. FACES 2003 Research Brief: Children’s Outcomes and Program Quality in Head Start. Washington, DC: U.S. Department of Heath and Human Services, 2006.
Duncan, S.E., and E. DeAvila. Preschool Language Assessment Survey 2000 Examiner’s Manual: English Forms C and D. Monterey, CA: CTB/McGraw-Hill, 1998.
Administration for Children and Families. Head Start FACES 2003: Recent Trends in Program Performance. Fifth Progress Report. Washington, DC: U.S. Department of Health and Human Services, 2008.
Dunn, Lloyd, and Doug Dunn. Peabody Picture Vocabulary Test. Fourth Edition. Circle Pines, MS: American Guidance Service, 2006. Dunn, L.M., D.E. Lugo, E.R. Padilla, and L.M. Dunn. Test de Vocabulario en Imagenes Peabody. Circle Pines, MN: American Guidance Service, 1986.
American Academy of Pediatrics, Committee on Public Education. “Children, Adolescents, and Television.” Pediatrics, vol. 107, no. 2, February 2001, pp. 423-426.
Fabes, Richard, A. Gaertner, M. Bridget, and Tierney K. Popp. “Getting Along With Others: Social Competence in Early Childhood.” In Blackwell Handbook of Early Childhood Development, edited by K. McCartney & D. Phillips (pp. 297-316). Oxford: Blackwell Publishing, 2006.
Brooks-Gunn, Jeanne, and Greg J. Duncan. “The Effects of Poverty on Children.” The Future of Children, vol. 7, no. 2, 1997, pp. 55-71. Croninger, R.G., and V.E. Lee. “Social Capital and Dropping Out of High School: Benefits to At-Risk Students of Teachers’ Support and Guidance.” Teachers College Record, vol. 103, no. 4, 2001, pp. 548-541.
FACES Research Team. Language Screener modified from the Social and Communicative Competence tasks, in The CAP Early Childhood Diagnostic Instrument (prepublication edition), by Jana M. Mason and Janice Stewart. American Testronics, 1989.
Crosnoe, Robert. “Health and the Education of Children from Racial/Ethnic Minority and Immigrant Families.” Journal of Health and Social Behavior, vol. 47, no. 1, 2006, pp. 77-93.
Federal Interagency Forum on Child and Family Statistics. America’s Children: Key National Indicators of Well-Being, 2007. Washington, DC: U.S. Government Printing Office, 2007.
Currie, Janet. “Health Disparities and Gaps in School Readiness.” The Future of Children, vol. 15, no. 1, 2005, pp. 117-138.
Federal Interagency Forum on Child and Family Statistics. America’s Children: Key Indicators of Wellbeing, 2005. Washington, DC: US Government Printing Office, 2005.
Downey, D.B., von Hippel, P.T., and B. Broh. “Are Schools the Great Equalizer? Cognitive Inequality During the Summer Months and the School Year.” American Sociological Review, vol. 69, no. 5, 2004, pp. 613-635.
The Henry J. Kaiser Family Foundation. “Children, the Digital Divide, and Federal Policy” (Issue Brief). September 2004. Published online at http://www.kff.org/entmedia/upload/ Children-The-Digital-Divide-And-Federal-PolicyIssue-Brief.pdf.
20
Iruka, I.U., and P.R. Carver. “Initial Results From the 2005 NHES Early Childhood Program Participation Survey” (NCES 2006-075). Washington, DC: National Center for Education Statistics, 2006.
Rathbun, A., and J. West. From Kindergarten Through Third Grade: Children’s Beginning School Experiences (NCES 2004-007). Washington, DC: National Center for Education Statistics, 2004.
Juel, C. “Learning to Read and Write: A Longitudinal Study of 54 Children From First Through Fourth Grades.” Journal of Educational Psychology, vol. 80, 1988, pp. 437-447.
Raver, C. Cybele and Jane Knitzer. Ready to Enter: What Research Tells Policymakers about Strategies to Promote Social and Emotional School Readiness Among Three- and Four-Year-Old Children. New York, NY: National Center for Children in Poverty, Columbia University Mailman School of Public Health, 2002.
Latner, J.D., and A.J. Stunkard. “Getting Worse: The Stigmatization of Obese Children.” Obesity Research, vol. 11, no. 3, 2003, pp. 452-456.
Roid, G. H. and Miller, L. J. Examiners manual: Leiter International Performance Scale-Revised. Chicago: Stoelting Co, 1997.
McDermott, P.A., L.F. Green, J.M. Francis, and D.H. Stott. “Preschool Learning Behaviors Scale.” Philadelphia, PA: Edumetric and Clinical Science, 2000.
Shonkoff, J.P., and D. Phillips. From Neurons to Neighborhoods. Washington, DC: National Academy Press, 2000.
McDermott, P.A, N.M. Leigh, and M.A. Perry. “Development and Validation of the Preschool Learning Behaviors Scales.” Psychology in the Schools, vol. 39, 2002, pp. 353-365.
Strauss, R.S., and H.A. Pollack. “Social Marginalization of Overweight Children.” Archives of Pediatrics and Adolescent Medicine, vol. 157, no. 8, 2003, pp. 746-752.
NICHD Early Child Care Research Network. “Trajectories of Physical Aggression From Toddlerhood to Middle Childhood.” Monographs of the Society for Research in Child Development, Serial No. 278, vol. 69, no. 4, 2004.
Thies, Kathleen M. “Identifying the Educational Implications of Chronic Illness in School Children.” Journal of School Health, vol. 69, no. 10, 1999, pp. 392397.
Ogden C.L., K.M. Flegal, M.D. Carroll, and C.L. Johnson. “Prevalence and Trends in Overweight Among U.S. Children and Adolescents, 1999-2000.” Journal of the American Medical Association, vol. 288, no. 14, 2002, pp. 1728-1732.
West, J., K. Denton, and E. Germino-Hausken. America’s Kindergartners: Findings from the Early Childhood Longitudinal Study, Kindergarten Class of 1998-99, Fall 1998. NCES 2000-070 (Revised). Washington, DC: National Center for Education Statistics, 2000.
Pallas, A.M., G. Natriello, and E.L. McDill. “The Changing Nature of the Disadvantaged Population: Current Dimensions and Future Trends. Educational Researcher, vol. 18. no. 5, 1989, pp. 16-22.
West, J., K. Denton, and L. Reaney. The Kindergarten Year (NCES 2001-023). Washington, DC: National Center for Education Statistics, 2001.
Pollack, J.M., S. Atkins-Burnett, M. Najarian, and D.A. Rock. “Early Childhood Longitudinal Study, Kindergarten Class of 1998–99 (ECLS–K), Psychometric Report for the Fifth Grade (NCES 2006–036).” Washington, DC: National Center for Education Statistics, 2005.
West, J., L. Tarullo, N. Aikens, and L. Hulsey. Study Design and Data Tables for FACES 2006 Baseline Report. Washington, DC: U.S. Department of Health and Human Services, 2008. Whitehurst, G.J., and C.J. Lonigan. “Emergent Literacy: Development From Pre-readers to Readers.” In Handbook of Early Literacy Research, edited by S.B. Neuman and D.K. Dickinson. New York: The Guilford Press, 2002.
Radloff, L.S. “The CES-D Scale: A Self-Report Depression Scale for Research in the General Population.” Journal of Applied Psychological Measurement, vol. 1, no. 3, 1977, pp. 385-401.
21
Whitehurst, G.J., and C.J. Lonigan. “Child Development and Emergent Literacy.” Child Development, vol. 69, no. 3, 1998, pp. 848-872.
5
Parents who were not interviewed during the week-long visit were interviewed by phone. About 89 percent of the parent interviews were conducted in person. The fall 2006 round also included program director, center director, and education coordinator interviews, but data from these sources are not used in this report.
Woodcock, R.W., A.F. Muñoz-Sandoval, K. McGrew, N. Mather, and F. Schrank. Bateria III WoodcockMunoz. Itasca, IL: Riverside Publishing, 2004.
6 The screening process and cognitive assessment measures are described in the section of this brief that describes children’s cognitive outcomes.
Woodcock, R.W., K. McGrew, and N. Mather. Woodcock-Johnson III Tests of Achievement. Itasca, IL: Riverside Publishing, 2001.
7 All statistics found in this report and information on reliability of the measures can be found in West et al. 2008.
Zill, N., and J. West. Findings from the Condition of Education 2000: Entering Kindergarten Children (NCES 2001-035). Washington, DC: National Center for Education Statistics, 2001.
8
Weights are used to compensate for the differential probabilities of selection at the sampling stage (e.g., 3-year-olds were sampled at a higher rate than 4-year-olds) and to adjust for the effects of nonresponse.
NOTES
9
1
Shonkoff and Phillips 2000; Duncan and Brooks-Gunn 1997; Duncan and Magnuson 2005.
Migrant and Seasonal Worker programs (MSHS), American Indian and Alaska Native (AI/AN) programs, programs in Puerto Rico and other U.S. territories, and programs not directly providing services to 3-, 4-, and 5-year-olds (such as Early Head Start) were excluded from the frame. The Office of Head Start provided information about any defunded (or soon-to-be defunded) programs before sampling, and these programs were then deleted from the sample frame. Thirteen programs affected by Hurricanes Katrina and Rita in August 2005 were unable to provide information for the 2004–2005 PIR data and thus were not eligible for sample selection.
10
Includes both biological and adoptive parents.
11
The percentages presented in this section apply only to children whose mothers and/or fathers live with them. 12 The federal poverty threshold for a family of four was $20,000 in 2006. 13
Croninger and Lee 2001; Pallas, Natriello and McDill 1989; Rathbun and West 2004; Zill and West 2001.
2
14
Children who were 3 years old and attending their first year of Head Start were sampled at a higher rate to ensure comparable sample sizes between 3year-olds and 4-year-olds at the end of the kindergarten year, given the longer follow-up time for this younger group.
Downey, von Hippel, and Broh 2004; Rathbun and West 2004; West, Denton, and Reaney 2001. 15
In cases where questions were asked similarly to FACES, we have included comparisons with national studies. 16
Percentages cited in the discussion of parents’ health and mental health refer to the respondent’s self-report. Most respondents (87 percent) were the sample child’s biological mother, 7 percent were the sample child’s biological father, and the remaining 6 percent were other relatives or primary caregivers.
3
Three of the 63 programs that were sampled declined to participate. 4 These are all weighted response rates. The cumulative weighted response rates, which take into account the response rate for all levels of the sample, are lower. The cumulative weighted response rates for centers and classrooms are both 92 percent. The cumulative teacher response rate is 91 percent and the cumulative child response rate (consent rate) is 82 percent. The cumulative weighted response ratesfor the child assessments, parent interviews, and teacher ratings are 78 percent, 79 percent, and 78 percent, respectively. At the teacher level, among participating classes, marginal weighted response rate for the teacher interview was 98.4%. At the child level, among consented children, the child assessment rate was 95.9 percent; parent interview was 96.3 percent; teacher-child report was 95.3 percent.
17
Juel 1988; Whitehurst and Lonigan 1998,
2002. 18 Pollack, Atkins-Burnett, Najarian, and Rock 2005; Rathbun and West 2004. 19
Language screening procedures have changed across FACES cohorts. In FACES 2000, Social Awareness tasks (FACES Research Team 1997) were used as the language screener to determine whether the child should receive the English or the Spanish version of the child assessment battery.
22
Like FACES 2006, in FACES 2003 two subtests from the Pre-LAS 2000 were used as screening tools.
to differences in performance between the FACES and ECLS-B samples.
20 Children whose home language was English were administered the cognitive assessment battery in English regardless of their scores on the Pre-LAS. If a child made 5 consecutive errors on both the Simon Says and the Art Show and was from a Spanishspeaking background, he or she was routed to the Spanish-language cognitive assessment. A child who made 5 consecutive errors on both the Simon Says and the Art Show and did not speak English or Spanish was routed out of the cognitive assessment and was just weighed and measured. Children who passed the screener and whose home language was not English received the cognitive assessment battery in English. A figure in the set of supplemental tables (West et al. 2008) depicts the routing process and the number of children who received the English (n = 2737) and Spanish (n = 425) versions of the assessment battery.
26 On norm-referenced scores that reflect absolute performance, newly entering 4-year-olds have higher scores than 3-year-olds and therefore perform better in absolute terms. 27 Number of family risks is based on three family characteristics: whether the child resides in a single parent household; whether the household income is below the poverty line; and whether the mother has less than a high school diploma. 28
On norm-referenced scores that reflect absolute performance, newly entering 4-year-olds who took the assessment in Spanish have higher scores than their 3-year-old counterparts and therefore perform better in absolute terms. 29
21
All children, regardless of home language or performance on the Pre-LAS, received the English receptive vocabulary measure, the Peabody Picture Vocabulary Test-4 (PPVT-4). The TVIP is the Spanish language version of the PPVT-4 and was used with children whose primary home language was Spanish, regardless of performance on the Pre-LAS. Thus, children whose parents spoke Spanish at home received the receptive vocabulary component of the battery in English (PPVT-4) as well as in Spanish (TVIP).
Crosnoe 2006; Currie 2005; Thies 1999.
30
In comparison, parents report that about 6 percent of Head Start children have a disability, with approximately 20 percent having more than one impairment. 31
Latner and Stunkard 2003; Ogden et al. 2002; Strauss and Pollack 2003 32
Body Mass Index (BMI) is the ratio of an individual’s weight to height and can be used as an indicator of overweight and risk for overweight status. Calculation of BMI is specific to gender and age.
22
The English assessment used the WoodcockJohnson III subtests and the Spanish assessment used the Batería III Woodcock-Muñoz subtests.
33
The Centers for Disease Control and Prevention (CDC) sets the criterion of at risk for overweight as being when the child’s BMI score is from the 85th to 94th percentile for their age and gender, and of overweight as being when the child’s BMI is at or above the 95th percentile.
23
The standard scores for the PPVT-4, TVIP, and Woodcock-Johnson and Woodcock-Muñoz subtests have an overall mean of 100 and a standard deviation of 15.
34
24
Nationally, the percentage of children who are overweight has been steadily increasing since 1980 (Federal Interagency Forum on Child and Family Statistics 2005).
Woodcock-Johnson scores in FACES 2000 are drawn from the Woodcock-Johnson PsychoEducational Battery-Revised edition. WoodcockJohnson scores in FACES 2003 are drawn from a hybrid version of the Woodcock-Johnson PsychoEducational Battery-Revised edition and the Woodcock-Johnson Psycho-Educational Battery-Third edition. The Woodcock-Johnson subtests were administered only to 4-year-old children in FACES 2000. PPVT scores in FACES 2000 and 2003 are drawn from the Peabody Picture Vocabulary Test-Third edition.
35 See, for example, Shonkoff and Phillips 2000; Raver and Knitzer 2002. 36
In the spring of 2007, FACES also conducted classroom observations of the quality of facilities and teacher-child interactions. These data, as well as information from interviews with management staff, will be explored in a subsequent report.
25 The age at time of testing in the ECLS-B preschool wave ranged from approximately 3 years, 8 months to 5 years, 5 months. On average the FACES children were assessed earlier in the year than the ECLS-B sample, and may on average have been younger. These factors can be expected to contribute
37
Percentages represent the primary curriculum reported, regardless of whether the teacher used only one curriculum, or a combination of curricula.
23