To evaluate visitors' use or the exhibitions and the communication strategy or the. Milan Natural History Museum, wecompared results gathered with ...
Behavior vs. Time: Understanding How Visitors Utilize the Milan Natural History Museum • • • • • GIORGIO CHIOZZI AND LIDIA ANDREOTTI
ABSTRACf
To evaluate visitors' use or the exhibitions and the communication strategy or the Milan Natural History Museum, we compared results gathered with two methods, based respectively on the timing or visitors and on the unobtrusive observation of exhibit-use behaviors. We collected data from a sample of 100 groups of visitors (not guided), randomly selected at the museum entrance. We recorded the following data for each group: halls visited, length of stay in each hall, any kind ofbehavior showing visitor/exhibition interaction and the displays where interactions occurred. The study shows that visiting time does not give enough information about the actual use of exhibits by the audience. The investigation of visitor/exhibition interactions revealed itself to be the most usual method to describe the visitors' use of the exhibitions. The most important factor influencing visits to the Milan Natural History Museum is the communication technique used in the exhibition areas.
INTRODUCTION
In many studies conducted to evaluate the effectiveness of museum exhibitions, visiting time has been used as an indicator of visitors' satisfaction, the idea being that visitors devote more time to the exhibitions they prefer (BechteI1967). More recently, SerreIl (1997, 1998) developed a method which, through the analysis of time-related behaviors in different museum settings, aims to measure an exhibition's success and how thoroughly it is used by visitors, on the assumption that "diligent visitors" (i.e., those that stop at more than half the elements of an exhibition) spend more time in the exhibitions. Conversely, Falk (1983) considered time to be an excellent way of understanding visitors' motivation and behavior, but stressed that measuring time is of no real use if one does not consider the factors that determine the appearance of a particular behavior. Giorgio Chiozzi is curator, department of omithology, Museo Civico di Storia Naturale, Corso Venezia 55, 1-20121 Milano, 1taly, and Lidia Andreotti is a private consultant far museum studies, . 153
154
CHIOZZI AND ANDREOTII
•
THE MILAN NATURAL HISTORY MUSEUM
Visitors' behavior can generally be predicted and seems to be strongly influenced by the elapsed time of visit, no matter the efforts museum professionals put in the control of exhibit and setting variables (Falk et al. 1985; Falk 1991). An alternative method could therefore be based on the analysis of visitor/exhibition interaction, i.e., behaviors enacted when viewing displays: An exhibition should be considered preferred by visitors if higher levels of interaction are recorded. By doing so, the time factor is ruled out, since it does not influence the onset of interactions. When an exhibition arouses the interest of a group of visitors with little time on hand, then visitors will show behaviors that do not imply prolonged stops in front of displays. On the other hand, when visitors seem not to like a particular exhibition, visitor/exhibition interactions will be substantially reduced and, in certain cases, fully eliminated. The only previous visitor studies at the Milan Natural History Museum had been a questionnaire-based survey (Magnoni et al. 1995) that collected information about visitors' sex, age, level of education, geographic area of origin, previous museum experience and first hand impressions of the exhibitions. Beyond this information and the visitors' yearly counts, not much was known about the audience of the Milan Natural History Museum (Museo Civico di Storia Naturale di Milano, or MSNM). More recently, a paper described the behavior of the MSNM visitors (Andreotti and Chiozzi 1999). We performed the present research in order to test the validity of using visitor/exhibition interactions as a key to understand how visitors use the MSNM exhibitions and to evaluate the museum's communication policy. For this purpose we compared data obtained through timing of visits and observation of visitors' behavior in order to determine which of these methods is more suitable to describe visitors' use of the MSNM exhibitions or if these methods are both equally reliable. Finally, we evaluated if public's reactions to the more recent communication and educational development of the MSNM exhibition strategy.
THE MILAN NATURAL HISTORY MUSEUM
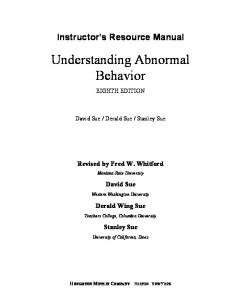
The exhibition halls of the MSNM are placed in a ring on two fIoors (5,500 m2) connected by a wide staircase. The route takes visitors through 23 halls housing 700 displays that . primarily focus on the evolutionary and ecological interpretation of natural history. Dioramas are the most striking communication technique that enlivens the exhibitions (Figure 1). The ground fIoor (eleven exhibition halls) deals with mineralogy and geology, paleontology, paleoanthropology and zoology of invertebrates, and only two halls contain dioramas (2.5% of the displays for that fIoor). The upper fIoor (twelve exhibition halls) deals with vertebrate zoology and ecology, and ten halls have been turned into galleries reconstructing natural environments (43.6% ofthe displays on this fIoor are dioramas). Most visitors to the museum (64.2%) are adults who decide what they wish to see for themselves. School trips account for 30.9% of the viewing public and these generally go on guided tours of the museum. The remaining 4.9% of the visitors are using the library or attending conferences.
CURATOR 44/2
•
APRIL 2001
155
Figure 1. The entrance of the Milan Natural History Museum. Curators and technical staff of the museum carrying a mode I of an Indian Rhinoceros (Rhinoceros unicornis) to its final destination: a new diorama dedicated to the Kaziranga National Park (India). Photo by Guido Alberto Rossi-Museo Civico di Storia Naturale di Milano, 1999.
Not counting school trips, visitors belong to the following soci al groups: adults with children (46%), male/female couples (23%), and groups of adults (18%). The remainder (13%) are visitors who come alone (Andreotti and Chiozzi 1999). The visiting public mainly comes from the town of Milan, from nearby towns and from other provinces in Lombardy (schools: 86.8%; other visitors: 69.7%, Magnoni et al. 1995). A survey carried out in 1992 (Magnoni et al. 1995) reported that the education level of the non-school public is high compared to national data: 66.1% of the visitors have completed upper secondary schooling (the 1992 national figure was 14.3%).
156
CHIOZZI AND ANDREOITI
THE MILAN NATURAL HISTORY MUSEUM
Table 1. Description of behaviors enacted in the exhibition areas, as observed in a sample of 100 groups (245 visitors), in the MSNM (Andreotti and Chiozzi 1999).
Behavior
Description
Cursory glance Careful observation Brief reading Comprehensive reading Commenting Pointing Naming
Rapid glimpse at the exhibition without stopping Stopping to look at the exhibition Deliberate glance at texts (McManus 1987) Reading with full attention (McManus 1987) Verbal or gestured communication about the exhibition Showing with the forefinger or with a movement of the head Reciting the names of the objects contained in a glass case
Table 2. Description of fatigue symptoms, as observed in a sample of 100 groups (245 visitors), in the MSNM (Andreotti and Chiozzi 1999)
Behavior
Description
Statement
To say phrases such as: "l'm tired," "l'm hungry" or similar expressions One or both shoulders lean against a wall or a display case (Morris 1977) The hands are put into pockets or the forearms rest on a horizontal surface (Morris 1977) The head is sustained with a hand thus relaxing the neck's muscles (Morris 1977) To use available surfaces (a chair, a projection, the fIoor) as a seat To sit on one's own ankles putting the thighs into contact with the calves (Morris 1977) To give a yawn To stretch the back, sometimes levering with both hands in the lumbar regio n To move bag, coat, camera or any other carried object from one arm to the other
Vertical Support Arms Support Head Support Sitting Crouching Yawning Stretching Balancing
Study methods- The ethogram of visitors to the Museum (Tables 1and 2 ), i.e., the catalogue of their behavioral repertory during the visit, has been ilIustrated by Andreotti and Chiozzi (1999). We randorn1y selected one hundred groups of visitors (245 people) on entering the museum. From that moment on, we followed unobtrnsively the groups for the whole duration of their visit in order to prevent the researcher from being noticed and thus to have any effects on the observed subjects' behavior (Borun et al. 1996; Falk 1983; McManus 1987; Peart 1984; Robinson 1928). If even one member of a group got
CURATOR
44/2
APRIL
2001
157
the impression of being studied, the whole group was then abandoned and the relative data gathered until then were not taken into consideration. We did not include guided tours in the study since the visiting route is strongly influenced by the guide. We also excluded groups of more than six people to avoid any difficulties in data collection due to the excessive number of people to monitor. We recorded the following data for each group: halls visited, length of stay in each hall, any kind of behavior showing visitor/exhibition interaction (cursory glance, careful observation, brief reading, comprehensive reading, commenting, pointing, namingTable 1), fatigue symptoms (statement, vertical support, arrns support, head support, sitting, crouching, yawning, stretching, balancing- Table 2) and the display where interactions occurred. Data collection took 96 hours distributed in such a way that they covered the whole daily and weekly opening time throughout the year. The visit was normally conducted by going from Hall 1 to Hall 11 (on the ground floor) and going from Hall 12 to Hall 23 (on the first floor). The only variation possible to this route was by starting off with the upstairs floor before proceeding downstairs (only 9% of the groups chose this route). To standardize data, we took into consideration the order in which halls were visited rather than the consecutive hall number, even though the two issues practically coincided in this case. We considered a display to have been visited when at least one member of a group of visitors interacted with it. Available displays were those present in each hall. Because of the practical difficulties we found to simultaneously collect behavioral data and collect timing data on every single visitor in detail, we theoretically calculated the average time spent at visited displays in each hall subtracting the time used by groups of visitors to cross the hall (as if there were no exhibit in it) from the total time spent in the hall (a measure we could easily get during the tracking). To calculate the "crossing time" we assumed visitors walking at an average pace of 2:5 km per hour. Thus, a hypothetical group following a track bisecting the 23 halls of the MSNM would go across the full route in 579.5 seconds. This led us to conclude that each hall would be crossed, on an average, in 25.2 seconds. In order to counterbalance the differences in speed through groups and the presence of obstacles that actually precluded the possibility to march along a straight line, we rounded off the measurement to 30 seconds (0.5 minutes). Mean time per visited display (çd ) was calculated as follows:
where Tex is the total time dedicated to the exhibits, so as to say the total time spent in the halls minus the total time spent in crossing the halls. The first results from the sum of partial time measurements in each hall visited by group n, while the second is expressed by the number of halls visited by group n, multiplied by 0.5 minutes (theoretical average crossing time). VD is the total number of displays visited by group n.
CIllOZZI AND ANDREOTTI
158
TRE MILAN NATURAL IllSTORY MUSEUM
4·~------------------------------------------------------,
Ciì
3
~
Ci /Il
3
C Q)
2
.!!!
2
:c
~•.. Q)
Q, Q)
1
E i= e la Q)
==
1
2
3
4
5
6
7
8
9
10
11
12
13 14
15
16 17
18
19 20
21 22 23
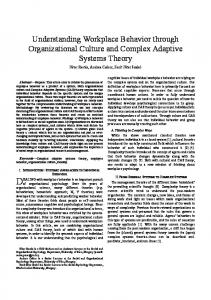
Halls Figure 2. Mean time (in seconds) per available display.
RESULTS AND DISCUSSION
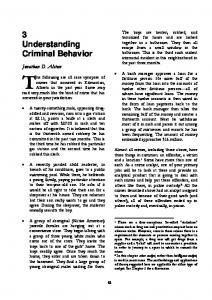
In order to test the hypothesis that time could be properly used to evaluate the effectiveness of museum exhibitions, we considered the mean time per available display and the mean time per visited display. In the first case, we found that time dedicated to each available display shows a positive trend through the visit (Figure 2). This method, however, neither considers the differences between exhibit arrangements in the ground and in the first floors of the museum, nor the displays that the public really visited. Not allowing for these issues may actually le ad us to conclude that the upstairs halls are more appreciated by visitors than the downstairs ones. On the other hand, the analysis of the mean time per visited display (Figure 3) shows a negative trend through the visit. We should then conclude that visitors prefer the downstairs displays. This approach stili does not give consideration to the communication peculiarities of each hall. In fact, we do not know if visitors favored a specific exhibition as a whole, but we can only figure out which particular displays in a hall they preferred among the others. This ambiguity that is linked to the use of time does not allow us to draw clear conclusions. Falk et al. (1985) pointed out the importance of museum fatigue as a factor greatly influencing the visit by reducing the attention to exhibits. Assuming this could be generally true, the decreasing mean time per visited display (Figure 3) observed in the MSNM agrees with the onset of fatigue symptoms (Figure 4), which increase as the visit progresses. However, a discrepancy arises when we consider the percentage of visited displays per available displays in each hall. The observed growing trend of this percent-
CURATOR 44/2
•
159
APRIL 2001
30~--------------------------------------------------------,
__ 25 I/)
~ c.. .!!!
20
s•..
15
c "C
CI)
·iii CI)
Cl.
~ 10
j:: C IO
~
5
1 2
3
4
5
6
7
8
9 10 11 12 13 14 15 16 17 18 19 20 21 22 23
Halls Figure 3. Mean ti me (in seconds) per visited display.
I/)
6~--------------------------------------------------------,
E o
a
5
E
~ CI)
::J
4
CI
~
3
CI C
.~
2
.c I/) I/)
g.1
e
CI
'O ~
1 2
3
4
5
6
7
8
9 10 11 12 13 14 15 16 17 18 19 20 21 22 23
Halls Figure 4. Occurrence of fatigue symptoms as the visit progresses (Andreotti and Chiozzi,
1999). age (Figure 5) is in evident contrast with the increasing fatigue symptoms, if one expects to find out that visitors would walk through the halls without stopping in front of the exhibits when they are more tired. It is evident that neither the pure assessment of time spent in an exhibition or in
CHIOZZI AND ANDREOTII
160
TRE MILAN NATURAL HISTORY MUSEUM
91~--------------------------------------------------------,
1
2
3
4
5
6
7
8
9
10
11
12
13 14
15
16 17
18
19
20
21 22 23
Halls Figure 5. Percentage of available displays actually visited.
%;--------------------------------------------------------,
040
o •..>< 35%
-+-o-
~
__
Careful observation Brief reading
-o-
Comprehensive
--X-
Pointing
.!!!
30%
l7i
:c 25% QI
~
Cursory glance
~
Naming
~
Commenting
reading
20%
.iij ~
15%
Ùi
>ca 100/. Q. 1/1
:c "C
~ 0%1--.-,r-,--,-,--.--r_.--r-.--.--r-;--.-,r-,--,-,~T__r_.~ ·0
s
2
3
4
5
6
7
8
9
10
Figure 6. Occurrence of visitor/exhibition
11
12
13
14
15
16 17
18
19
20
21
22 23
Halls interactive behaviors as the visit progresses.
front of a display, nor the simple notion that visitors utilization of one display or another in the halls are sufficient to describe what really happens during the visit of the MSNM and to justify the visitors' growing interest towards the exhibits in spite of their tiredness. A way to solve the dilemma could be the detailed investigation of visitors' behavior in front of displays. This would permit us to estimate the evolution of visitors' mood during the visit. A first look at Figure 6 will highlight how exhibition-related behaviors show con-
CURATOR 44/2
•
APRIL 2001
161
1.~--------------------------------------------------------.
1/1
1.
~
Q.
.!!!
'ti
al
:c ~
I
o.
r:::
ge
~ .!! .E
o. 0.2
0.01~~--'-'--'-'--'--'-'--r-'--'--'-'--r-'r-'--'-'--r--'-'~ 1
2
3
4
5
6
7
8
9
Figure 7. Number of visitor/exhibition
10
11
12
13 14
15
16 17
18
19 20
21 22 23
Halls interactions per available display during the visit.
siderable changes as the visit progresses. More in-depth analysis emphasizes a remarkable difference between the ground floor halls (1-11) and the first floor ones (12-23). The only behavior that follows a decreasing trend is comprehensive reading, which, in any case, is always at a low level (at the most, visitors engage in comprehensive reading at 7% of available displays). The frequency of alI the other behaviors shows a percentage increase as the visit progresses. By comparing this element with the onset of fatigue symptoms, which increase as the visit progresses, and with the mean time per visited display, which tends to fall, there seems to be a contradiction. The increase in the frequency of visitor/exhibition interactions can be actually explained only noting that visitors prefer the upstairs halls to the downstairs ones. This is even more striking when frequency of interactions per hall is analyzed. Figure 7 shows that the upstairs halls (12-23) have a greater number of interactions per available display compared to the downstairs halls (1-11). Considering visitor/exhibition interactions per visited display (Figure 8), halls with most frequent interactions are very often the upstairs ones, which use dioramas as the main display technique. The only behavior that occurs more frequently in the downstairs halls is comprehensive reading. Apart from visitors' greater acquaintance with the topics dealt with in the upstairs halls, the more frequent comprehensive reading downstairs may essentially be due to two factors. Firstly, upstairs halls are visited last, hence visitors are tired and the time they have decided to devote to the visit is nearly over. Moreover, comprehensive reading of texts requires concentration that is incompatible with museum fatigue, while prolonged stops are incompatible with the little time remaining. Therefore, as the visit progresses, the percentage of displays where comprehensive reading takes pIace decreases. Secondly, upstairs halls use considerably different display techniques. Dioramas seem to arouse more physical involvement (more pointing, naming and commenting
ClllOZZI AND ANDREOTII
162
•
THE MILAN NATURAL IllSTORY MUSEUM
2.~-----------------------------------------------------. 2. 11I
~
Q. 2. 11I
:c
-
't:I CIl
'iii ~
2.
11I
C O
~ ~ .!! .E
1.
1.
1
2
3
4
5
6
7
8
9
Figure 8. Number of visitor/exhibition
10
11
12
13 14
15
16 17
18
19 20
21 22 23
Halls interactions per visited display during the visit.
behaviors) and to give visitors the impression that there is no need to carefully read texts because dioramas appear to be able to communicate for themselves. This is supported by the fact that in the last hall on the ground floor (Hall Il), which has about a dozen dioramas devoted to insects, the percentage of displays with comprehensive reading is among the lowest for that floor. On the other hand, the first two halls upstairs, (12 and 13), which do not contain any dioramas, register the highest percentage for comprehensive reading.
CONCLUSION
As it can be seen from the discussion, describing how visitors utilize the exhibitions through the analysis of mean times per visited display or per available display can le ad to contradictory results. Moreover, measuring time of visit in an aseptic way, i.e., not considering which displays visitors really interact with and ignoring the communication techniques used, does not give an actual picture of what effectively happens during the visit. On the contrary, we demonstrated that through the observation ofvisitors' behavior during their museum experience, we could get a neater image of what people really like. Moreover, our evidence suggests that the two methods are not equally reliable at all. In fact, visiting time appears not to be the main factor to influence the reactions of visitors in front of displays. Unexpectedly, museum fatigue, which is generally considered the first enemy of museum visits, revealed itself not to be so crucial. In fact, growing fatigue symptoms do not go hand in hand with a decrease ofvisitor/exhibition interactions. Visits to the MSNM are in effect strongly influenced by the communication tech-
CURATOR 44/2
•
APRIL 2001
163
Figure 9. Giving the final touches to a Bongo (Tragelaphus euryceros) in the Aberdare National Park diorama, in the stili progressing Tropical Forests Hall (Hall 14) on the first floor of the MSNM. Photo by Guido Alberto Rossi-Museo Civico di Storia Naturale di Milano, 1999.
niques used in the exhibition areas. By looking at the facts this way, it is no wonder that visitors perceive the museum as two distinct museums in their own right. In particular, the exhibition areas that arouse the least public response are the ones displaying many specimens that require explanatory texts. On the other hand, the communication techniques that stimulate visitor/exhibition interactions the most are the ones where no explanatory text is necessary. The diorama is a fitting example of this, since it is the expression of a primary language form that is quick and often easy to understand (Cagnolaro 1991). Observing an organism in its natural habitat (Figure 9) is something that does not need a great deal ofwords, which, in any case, are not alwaysas evocative. Ecological contextualization also makes visitors perceive the museum as a pIace where nature preservation is illustrated (Andreotti 1997). Finally, the surprise element in seeing dioramas must not be underestimated: Making visitors marvel is one of the most effective strategies to make them formulate questions to which a good exhibition should, at least in part, then be able to provide answers. Reading display texts, in this case, is an important aspect, but not a compulsory one, in order to exploit the benefits of the exhibition. The different subject matters displayed in the halls, could, in part, explain the dissimilar responses of the public in the two floors of the MSNM. Minerals, fossils and
164
CHIOZZI AND ANDREOTII
TRE MILAN NATURAL HISTORY MUSEUM
Figure 10. A partial view of a permanent exhibit dedicated to paleontology, in Hall 4 on the ground floor of the MSNM. Photo by Giorgio Chiozzi, 1995.
invertebrate animals seem not to arouse the sa me intense emotional reactions that vertebrate animals and backgrounds produce while looking at the dioramas. This could possibly be due to their more evocative power. The possible influence of the different themes on visitor/exhibition interactions is a question that will require further testing. Research has therefore revealed that the museum staff's decision to focus on dioramas as a communication and educational instrument has been well rewarded by the public's positive reaction. Carefully detailed and beautifully attractive, dioramas seem to speak directly to the heart of visitors. They generate (with the need of only basic textual explanations) a lot of behavioral interactions. At the same time, though, despite the great commitment made to improve the communication style (better graphics, more readable texts), those permanent exhibitions showing a strong collecting ethos or bookish nature have been greatly penalized by most visitors. While certain displays (such as the pterosaur model hanging from the ceiling, Figure 10) cause a great deal of reaction in the public, others (such as those undemeath it) largely fail to attract people. Perhaps they contain too much to read or too many objects. This has stressed the need to make changes and improvements in the communication strategies adopted in those sections of the museum.
CURATOR 44/2
APRIL 2001
165
ACKNOWLEDGMENTS
We wish to thank John Falk who critically read the preliminary drafts of the manuscript giving us lots of advice and encouragement for its improvement until the submitted version.
REFERENCES
Andreotti, L. 1997. Comportamento dei gruppi di visitatori del Museo Civico di Storia Naturale di Milano e valutazione delle esposizioni. Natural Science Degree Thesis, Università degli Studi di Milano, Faculty of Mathematics, Physics and Natural Sciences. Andreotti, L., and G. Chiozzi. 1999. Il comportamento dei visitatori del Museo Civico di Storia Naturale di Milano. Etogramma dei visitatori. Museol. Sci. 16/1:1-14. Bechtel, R. B. 1967. Hodometer research in museums. Museum News 45:23-26. Borun, M., M. Chambers, and A. Cleghorn. 1996. Families are learning in science museums. Curator: The MuseumJoumaI39/2:123-38. Cagnolaro, L. 1991. Scelta, progettazione ed organizzazione delle esposizioni in un museo di storia naturale. Museo/. Sci. 8:13-25. Falk, J. H. 1983. The use of time as a measure of visitor behavior and exhibit effectivenesso The Journal of Museum Education 7/4:183-90. Falk, J. H., J. J. Koran, L. D. Dierking, and L. Dreblow. 1985. Predicting visitor behavior. Curator 28/4:249-57. Falk, J. H. 1991. The National Museum of Natural History. Curator 34/1: 44-50. Magnoni, L., G. Chiozzi, and C Tognoni. 1995. I visitatori del Museo di Storia Naturale di Milano: un'analisi dell'utenza. Museo/. Sci. 11/~:259-77. McManus, P. 1987. It's the company you keep ... the soci al determination of learningrelated behavior in a science museum. The International Journal of Museum Management and Curatorship 6:263-70. Morris, D. 1977. Manwatching-A Field Guide lo Human Behaviour. Triad/Panther, London. Peart, B. 1984. Impact of exhibit type on knowledge gain, attitudes, and behavior. Curator 27/3:220-37. Robinson, E. S. 1928. The Behaviour of the Museum Visitors. New Series, No.5, Washington, D.C: American Association of Museums. Serrell, B. 1997. Paying attention: The duration and allocation ofvisitors' time in museum exhibitions. Curator: The Museum Journal 40/2:108-25. Serrell, B. 1998. Paying Attention: Visitors and Museum Exhibitions. Professional Practice Series. Washington, D.C: American Association of Museums.