BEHAVIORAL COMPLEXITY AND EFFECTIVENESS AMONG COOPERATIVE EXTENSION SERVICE PROFESSIONALS: A TEST OF THE LEADERPLEX MODEL by SARA DODD, B.A., M.B.A. A DISSERTATION IN FAMILY AND CONSUMER SCIENCES EDUCATION Submitted to the Graduate Faculty of Texas Tech University in Partial Fulfillment of the Requirements for the Degree of DOCTOR OF PHILOSOPHY Approved
Dr. Karen L. Alexander, Chairperson of the Committee Dr. Shane Blum Dr. Sue Couch Dr. Jessica Yuan Dr. Fred Hartmeister, Dean of the Graduate School December 2009
Copyright 2009, Sara L. Sullivan Dodd
Texas Tech University, Sara Dodd, December 2009
ACKNOWLEDGEMENTS Researching, writing, and defending a dissertation have been my goal for nearly ten years. If I remember correctly (and that is no sure thing), the original plan was to begin the doctoral coursework after our youngest child started school. There was a hiccup or two but eventually I reached the finish line. It is a privilege to acknowledge the groups and individuals who have been a part of this endeavor. To Ginny Felstehausen, heartfelt thanks for your constant encouragement and guidance over my doctoral program until your retirement. You always helped me to see the big picture. Likewise, I deeply appreciate the late James G. “Jerry” Hunt and his ‘leadership’ of my academic development. It was Jerry who introduced me to the topic I chose for my research. I am indebted to him for his scholarship and “mentoring” (a.k.a., nagging), and not least of all, his support for my desire to test the Leaderplex model. Jerry, you are missed. To Karen Alexander, thank you for being willing to take on the role of my committee chair, and for gently nudging and prodding when the situation called for it. You kept me on track when I needed it most. My appreciation also goes to Sue Couch, Shane Blum, and Jessica Yuan for their service on my committee. Thank you for your thoughtful feedback on my proposal, study design, and eventual manuscript – each suggestion made a tangible improvement. I also would like to acknowledge the many colleagues that played a role in motivating me and keeping me sane while trying to balance work and studies. Natalia and Coy, I appreciate the comic relief and opportunities to dabble in experimental ii
Texas Tech University, Sara Dodd, December 2009
research. To the Work·Travel·Family research project, many thanks for the flexibility and opportunity to work with an amazing research team. A special thank you to Jim Wilcox – your statistical insights made for some wonderful “ah ha!” moments. Humble thanks go to my circle of dear friends who prayed for me whenever I asked and then some: Truly, the “prayer of a righteous man availeth much” (James 5:22), and I must have some truly righteous friends! JoAnn, Teresa, members of Growth Group, and many others – I thank God for each of you! To the members of the McCleskey Family Executive Committee – Sue Jane, Diana, Sabrina, and Linda: You lifted me up at critical moments. To my brothers and most especially my mother, Lillie, I am grateful for your unwavering support. I am beyond blessed to have a mom like mine, who handed down a passion for learning and her belief that girls can do anything. Finally, to my wonderful husband and children, I am mindful of something Garry Breland said about his wife’s dissertation in The Chronicle of Higher Education (June 5, 2006): “No one wants a loved one to die, but if that person is suffering through a long illness, there may come a point where you just want her to be done with it. No wonder they call them terminal degrees.” You have been extraordinarily patient and longsuffering – some of you ‘suffering’ louder than others – and I know that no one is more excited than you that I have finished. Christopher, Katie, and Michael – thank you for being precisely who you are, for always reminding me of what is truly important. Tim, just in case you didn’t already know, I am very thankful to have a husband and best friend like you -- how did I get so lucky? iii
Texas Tech University, Sara Dodd, December 2009
TABLE OF CONTENTS ACKNOWLEDGEMENTS ….…..………………………………………..
ii
ABSTRACT………………………………………………………………..
vii
LIST OF TABLES …………………………………………........................
viii
LIST OF FIGURES ………………………………………………………..
ix
CHAPTER I. INTRODUCTION………………………………………………………..
1
PURPOSE AND RATIONALE OF THE STUDY…..…………………
2
HYPOTHESE AND RESEARCH QUESTIONS ....…………………...
9
KEY TERMS …………………………………………..……………….
13
II. BACKGROUND AND LITERATURE REVIEW …………………..…
16
COOPERATIVE EXTENSION SERVICE …………….…………..... Background ………….. …………………………………….……… Family and Consumer Sciences and Cooperative Extension.……… The Mission of Cooperative Extension ………………………….… The Work Environment of Cooperative Extension ……….………..
16 16 18 21 21
LEADERPLEX MODEL …………………………………………..…. Cognitive Complexity …………………………………………..…. Social Complexity ……………………………………………….… Behavioral Complexity …………………………………………..…
27 29 32 35
SUMMARY OF LITERATURE REVIEW ……………………………
45
III. METHODS AND PROCEDURES………………………………….....
48
RESEARCH DESIGN …………………………………………………
48
SAMPLING ……………………………………………………………
49
MEASURES…………………………………………………….……..
50
iv
Texas Tech University, Sara Dodd, December 2009
Driver-Streufert Complexity Index ……….…………………….… Range and Differentiation of Emotional Experience Scale ..….….. Behavioral Repertoire Instrument .………………………………...
50 54 54
PILOT STUDY ..……………………… ………………….…………..
58
DATA COLLECTION PROCEDURES ……………………………..
60
DATA ANALYSIS …………………………………………………..
61
IV. RESULTS ……………………………………………………………..
62
PRELIMINARY ANALYSES .……………………….……………… Data Preparation.………………………………….……………….. Variable Coding .…..…………………………….…………….. Data Screening ……………………………………….……………. Missing Data ...………………………………………………… Data Reduction .……………………………………..………… Reliabilities…………………………………………………….. Outliers and Normality ……......……………………………….
62 62 63 65 65 66 71 71
DESCRIPTION OF THE SAMPLE ..….……………………………….
71
HYPOTHESES TESTING ..…………….……………………………... Correlation Analysis .……......……………………………………… Regression Analyses…………………………………………………
79 81 82
RESEARCH QUESTIONS.….………………………………………… Correlation and Regression Analyses……………………………….. Multivariate Analyses of variance………………….……………….. Analysis of Variance…………………………….…………………...
92 92 93 95
SUMMARY OF THE DATA ANALYSES ….…..……………………..
97
V. DISCUSSION OF RESULTS AND CONCLUSIONS .……..………….
98
BACKGROUND....……………..……………………….…….…………
98
PURPOSE AND METHOD..…...……………………….…….…………
99
SUMMARY AND DISCUSSION OF FINDINGS ….….…….………… 100 Hypotheses 1-4.….….……………………………….……………….. 100 Research Questions ….…………………………….……………….... 106 v
Texas Tech University, Sara Dodd, December 2009
CONCLUSIONS.....……………..…………………………….………… Implications….……….………………………………………………. Limitations..………….………………………………………………. Recommendations for Future Research ..…………………………….
109 109 110 112
REFERENCES.……………………………………………………………… 114 APPENDICES……………………………………………………………….
121
Appendix A – Recruitment email ………………………………………. Appendix B – Driver-Streufert Complexity Index ……….…………….. Appendix C – Range and Differentiation of Emotional Experience Scale Appendix D – Behavioral Repertoire instrument……………………….. Appendix E – Leader Effectiveness instrument ………………………… Appendix F – Demographic and Work Environment Questions ……….. Appendix G – IRB Proposal (including approval letter and survey)…….
121 122 123 124 125 126 127
vi
Texas Tech University, Sara Dodd, December 2009
ABSTRACT This study is thought to be the first empirical examination of the theoretical structure of the Leaderplex model developed by Hooijberg, Hunt, and Dodge in 1997. Specifically, this exploratory study examined the relationship between the differentiation and integration dimensions of cognitive and social complexity and also their capacity to act as antecedents for behavioral complexity. Behavioral complexity in turn was examined for its dimensionality (repertoire and differentiation) and its relatedness to observed leader effectiveness. Professional employees of Cooperative Extension systems in four states participated in the study during the spring of 2009. Participants completed an online survey by completing self-report measures for cognitive, social, and behavioral complexity and then reporting on the behavioral complexity and leader effectiveness of their immediate supervisor. Based on the multivariate statistical analysis of the data, cognitive and social complexity were found to be positively related and also to have a modest ability to predict levels of self-reported behavioral complexity. Selfreported behavioral complexity was found to be positively related to perceptions of supervisor behavioral complexity. Supervisor behavioral complexity also was found to have a strong predictive relationship to subordinate perceptions of leader effectiveness. Among the participants in the study, female Extension professionals reported higher scores on social differentiation, social range (integration), and cognitive differentiation. Keywords: Behavioral Complexity, Leadership, Cooperative Extension, Leaderplex vii
Texas Tech University, Sara Dodd, December 2009
LIST OF TABLES 3.1.
Research design for the proposed study.
4.1. 4.2. 4.3. 4.4 4.5 4.6 4.7 4.8
Factor loadings for cognitive complexity. Scale reliabilities and means. Sociodemographic characteristics of the sampled population. Work-related background characteristics of the sampled population. Scoring methods for construct variables. Correlation matrix for construct variables. Summary for multiple regression analysis for predicting leader effectiveness Summary for hierarchical regression analysis for predicting leader effectiveness. Coefficients for predictors of leader effectiveness. Summary for hierarchical multiple regression analysis for predicting behavioral complexity using grand means of cognitive and social complexity. Summary for hierarchical multiple regression analysis for predicting behavioral complexity using all dimensions of cognitive and social complexity. Coefficients for predictors of behavioral complexity. Coefficients for predictors of behavioral complexity in expanded regression. Summary for hierarchical multiple regression analysis for predicting supervisor behavioral complexity (N = 197) using the grand mean of behavioral complexity. Coefficients for predictor of supervisor behavioral complexity (N = 197). Multivariate analysis of variance of cognitive complexity for gender, age, job position, and Extension tenure. Multivariate analysis of variance of social complexity for gender, age, job position, and Extension tenure. Analysis of variance by gender for cognitive and social complexity. Means and standard deviations by gender for cognitive and social complexity
4.9 4.10 4.11 4.12 4.13 4.14 4.15 4.16 4.17 4.18 4.19
viii
Texas Tech University, Sara Dodd, December 2009
LIST OF FIGURES 1.1
The Leaderplex Model.
2.1 2.2 2.3
Job listing for a state-level Extension Specialist position. Job listing for a County Extension Agent/Educator in Family and Consumer Sciences position. Competing Values Framework.
3.1 3.2 3.3
Leaderplex Model compressed for study in the Extension environment. Competing Values Framework with reliability coefficients. Behavioral Repertoire Instrument.
4.1 4.2
Front part of Leaderplex Model Back part of Leaderplex Model
ix
Texas Tech University, Sara Dodd, December 2009
CHAPTER I INTRODUCTION Toward the end of the 20th century and continuing in the early years of the 21st, leadership scholars moved between paradigms which either describe what successful leaders look like or investigate behaviors and contexts associated with individuals and organizations characterized as effective (Streufert & Swezey, 1986, as cited in Bedeian & Hunt, 2006, p. 378). While eschewing old and chronic arguments about leadership vs. management, it becomes apparent relatively quickly that any systematic study of leadership involves examination of multiple levels of individual and collective orientations to work, to multiple dimensions of leading and to being led (Bass, 1990). In leadership literature from the past two decades, an image of complexity consistently emerges –complexity not only in what is perceived about objects, situations, and people (cognition and affect), but also in how those perceptions are constructed (process), and what those perceptions mean in terms of external responses (behavior) (Satish, 1997). Any rigorous examination of managerial leaders, leadership development theories, or organizations whose success is associated with the quality of leadership tends to end up at the same point: Determining what makes one individual a more effective leader than another individual is not simple, even in the most “simple” of organizational structures. Given that most organizations are themselves inherently complex, and that they operate in dynamic environments that cycle between stability and change, the study of leadership within any organizational context is likewise 1
Texas Tech University, Sara Dodd, December 2009
made more challenging (Mumford, Zaccaro, Harding, Jacobs, & Fleishman, 2000). Despite these hurdles, and those that continue to emerge, exploring the complexity of leaders and leadership as it manifests itself in real life organizational settings is critical to furthering the knowledge base that scholars and practitioners rely upon for understanding and guidance in formulating useful applications.
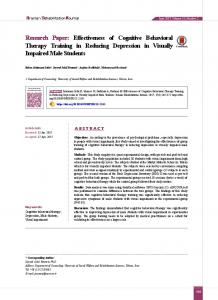
Purpose and Rationale of the Study This study examines the impact of individual cognitive, social, and behavioral complexity on educational leaders responsible for enacting integrative leadership roles across multiple communities (educational institutions, government, non profit services, business, media, and so on). To the best of the author’s knowledge, this study offers the first empirical test of the Hooijberg, Hunt, and Dodge (1997) Leaderplex Model. The publicly funded education and public service entity known as the Cooperative Extension System (CES) served as the population selected for this original test. The Cooperative Extension system is supported by the United States Department of Agriculture/Cooperative State Research, Education, and Extension Service (USDA/CREES), and state and local (county) governments. Known colloquially as Extension, CES is operated and administered through academic units at land-grant universities across the United States. Hooijberg et al. (1997) ascribe value to the Leaderplex model (Figure 1.1) because it considers the cognitive, social, and behavioral aspects of leadership as they operate simultaneously. As suggested by the model, leader effectiveness (and, by 2
Texas Tech University, Sara Dodd, December 2009
extension, organizational effectiveness) is a function of an individual’s ability to combine relatively higher levels of cognitive and social differentiation and integration and to express those abilities in behaviorally differentiated and integrated ways (behavioral repertoire). Differentiation and integration are the primary structural elements in the information processing that all humans must engage in as they perceive and respond to the world – people (individuals and groups), events, and environments – around them (Streufert & Swezey, 1986). Differentiation refers to the “number of dimensions and the number of categories within dimensions that are used by individuals in the perception of the physical and social environment” (Goldstein & Blackman, 1978, as cited in Hooijberg et al., 1997, p. 377). Integration refers to the “extent to which individuals can relate two or more orthogonal dimensions to produce an outcome that is determined by the joint demands of each dimension, system, or subsystem involved” (Streufert & Swezey, p. 17). Put another way, differentiation deals with how many cognitive or conceptual elements an individual can discern and discriminate (i.e., assign a position on a bipolar spectrum) in any given dimension of stimulus while integration deals with how an individual synthesizes those discriminations to produce some meaningful outcome. Thus, complexity is a function of how much an individual or group identifies and recognizes multiple dimensions (and dimensions within dimensions) of any given situation and how they utilize that knowledge to act or respond (Bieri, Atkins, Briar, Leaman, Miller, & Tripodi, 1966; Hunt, 1991; Streufert & Swezey, 1986). 3
Texas Tech University, Sara Dodd, December 2009
Cognitive Integration
Behavioral Repertoire Cognitive
Leader Effectiveness
Differentiation
Behavioral Differentiation
Social Differentiation
Organizational Effectiveness
Social Integration
Figure 1.1 The Leaderplex model (Hooijberg et al., 1997).
As noted in Figure 1.1, the complexity referred to in the Leaderplex model is the same construct that traditionally is defined as an individual’s capacity to perceive and distinguish between multiple dimensions and/or sources of information (differentiation) and to organize those perceptions into meaningful constructs (integration) that guide interpersonal relationships, responses to stimuli, decision making and so on (Bieri et al., 1966; Halberstad, Niedenthal, & Setterlund, 1996; Streufert & Swezey, 1986). In the organizational setting, the complexity derived from an individual’s ability/capacity to acquire, differentiate, and integrate units of information is more about how that information is used, rather than how it is gathered. Studying the complexity exhibited by individual leaders in the performance 4
Texas Tech University, Sara Dodd, December 2009
of their work means to study not only how they process information, but also how they apply it through social interaction (Hooijberg et al., 1997, p. 381; Kobe, ReiterPalmon, & Rickers, 2001, p. 155). Testing the Leaderplex model for the first time with a sample drawn from professionals working in the Cooperative Extension System offers considerable utility to the scholarship of leadership because of the multidimensional, integrative roles these women and men play as professional educators, researchers, administrators, and community developers – all in a dynamic and complex operating environment pushing them to redefine their role (Ensle, 2005; Ilvento, 1997; McDowell, 2001). This study also provided a unique opportunity to test an intuitive premise of modern conceptualizations of leaders and organizations: Individual, group, and environmental complexities interact with each other to produce who and what we characterize as effective. For Cooperative Extension, this research has the potential to yield critical and timely information about the human capital they have – and the human capital they will need – to sustain and grow their goal of creating and disseminating practical and meaningful knowledge to American communities (Ilvento, 1997). The implicit assumption is that Extension professionals are suitable candidates for a leadership study because they are “individuals who have differentiated themselves from those around them in terms of their influence” beyond formal or hierarchical authority structures (Bedeian & Hunt, 2006). County agents, for example, often operate without direct, daily supervision by an immediate superior. In a sense, a tacit institutional operating culture acts as supervisor; agents and specialists often are 5
Texas Tech University, Sara Dodd, December 2009
their own managers in terms of establishing work goals and developing plans/schedules to meet those goals. Yet, the relationship between the individual agent/specialist and those who occupy the next and higher levels on the organization chart (county directors, district administrators, or regional program directors) is not trivial. They are partnerships where leadership (as influence) travels in multiple directions and has the ability to influence outcomes in multiple arenas, a conceptualization of the complexity of managerial leadership consistent with that offered by Jaques and Clement (1991). The value of the sample chosen for this study is reinforced from historical, functional, and cultural factors. Through the Morrill Land-Grant Act of 1862, the federal government created a system of public higher education based on grants of public lands that could be sold to raise funds (McDowell, 2001). Land-grant universities, as they came to be known, represented what was at the time a more democratic, uniquely American approach to baccalaureate education. Ordinary citizens, who normally would have only limited access to higher education, would have the opportunity to pursue knowledge beyond the classical disciplines (e.g. agriculture and engineering), knowledge that would have particular application in rural and developing industrial economies. The concept took root, such that through further legislative acts in the late 19th century1 and early 20th century, the federal government supplemented the land grant universities and colleges with the ways and
1
The second Morrill Land-Grant Act of 1890, which brought historically African-American institutions into the land grant university system; the Hatch Act of 1887 which provided funding for agricultural research; and the Smith-Lever Act of 1914, from which the public service entity known as Extension emerged (McDowell, 2001).
6
Texas Tech University, Sara Dodd, December 2009
means to more widely disseminate research-based knowledge to individuals, families, and communities – a vehicle of service that today commonly is referred to as Extension. Graubard (as cited in McDowell, 2001, p. 7) described the impact of Extension in this way: Without wishing to deny the importance of (the influences of the German and British universities), the uniqueness of the American system needs to be emphasized, and not only because of the Morrill Act and the innovations introduced by the land-grant principle, with its emphasis on research in agriculture and many other fields as well. The concept of “service” took on a wholly new meaning in state universities that pledged to assist their citizens in ways that had never previously been considered. This common good pledge of service is manifested as a specific mission for extension of the knowledge gained through the research and teaching missions at the 100 plus land-grant universities and colleges across the United States to the wider community. Extension operates alongside as well as within existing academic units at land grant institutions in each of the 50 states, usually within a College of Agriculture. It is Extension’s specific mission to cultivate and disseminate – that is, to “reach [sic] out . . . solving public needs with college or university resources through non-formal, non-credit programs” (USDA, 2007). In other words, to advance the common good through integration across the previously mentioned business, government, nonprofits, media and community but in a way that is relevant for the society of today. The men and women who enact the Extension mission are required to be highly educated and to hold multiple roles. It is not uncommon for Extension professionals to have dual appointments with Extension and an academic department at the host institution (Ilvento, 1997; McDowell, 2001). It also is quite likely that their Extension 7
Texas Tech University, Sara Dodd, December 2009
role further requires these individuals to be key players in organizing and supervising volunteers in communities where Extension programs are delivered. For Extension professionals who serve at administrative levels, the integrative skills required to effectively manage processes and people (implementation of public policy and large numbers/groups of employees with diverse client bases, respectively) are comparable to those required of top management teams in for-profit organizations (Calori, Johnson, & Sarnin, 1994). Extension professionals interact with a wide variety of individuals and organizational units, entities in which competing goals, priorities, and cultures are the norm rather than the exception. Moreover, Extension professionals are performing their jobs in a fluid and changing environment. External complexity is on the rise as the U.S. population continues its rapid and dramatic shift from rural to urban communities, and the status quo for Extension’s relevance is increasingly questioned during federal budget review cycles (Hoag, 2005). Internal complexity is likewise heightened as the academic units that oversee Extension services struggle for autonomy and resources in the dynamic and fluid landscape of modern higher education (Ilvento, 1997). In summary, the work arena that Extension professionals experience (moving within and between business, government, nonprofits, media, and community) provides a useful level of environmental complexity that seems particularly amenable to a test of the Leaderplex model. The structure of the Extension organization chart – with both hierarchical and horizontal structure – lends itself well to self-report and other-report assessments of individual social, cognitive, and behavioral complexity. 8
Texas Tech University, Sara Dodd, December 2009
Validated instruments that measure these three components separately are more readily available today than they were when Hooijberg et al. presented the Leaderplex model in 1997. To serve the purposes of this research, an online survey tool was created and delivered to Extension professionals at multiple levels (county agent, program specialist, district administrator, regional program director, and associate and executive directors) in several states. The Extension culture in general is supportive of research activity and also is accepting of electronic communication media. Professional individuals at multiple levels of Extension organizations in several states were invited to participate in the survey. The survey itself consisted of separate measures for each complexity component of the Leaderplex model, each of which is described with greater detail in Chapter II.
Hypotheses and Research Questions Hypotheses The general premise of the Leaderplex model posits that working backward from perceived organizational effectiveness, a positive relationship emerges between effective individual managerial leaders and a relatively higher differentiated repertoire of leader behaviors. The model further theorizes that two related but distinct kinds of complexity, cognitive and social, play an antecedent role to the breadth and depth of an individual’s behavioral repertoire (BR) and differentiation, or behavioral complexity. Hooijberg et al. concluded their introduction of the 9
Texas Tech University, Sara Dodd, December 2009
Leaderplex model with a call for extended research to explore their proposition that cognitive complexity and social complexity “positively affect behavioral repertoire and behavioral differentiation, which in turn positively affect managerial effectiveness,” (p. 402) and thus the development of “specific organizational assessments, leadership training programs, and leadership feedback” (p. 402). The hypotheses tested in this study therefore incorporate the theorized relationships in the model. While Leaderplex draws no explicit or direct connection between cognitive and social complexity, it seems intuitive that cognitive and social complexity do not work in purely unilateral ways to impact an individual’s behavioral complexity. Indeed, Kang, Day, and Meara (2005) found in their assessment of measurement issues for a construct they labeled “social intelligence” that while the constructs of social and academic intelligence are characterized by multiple, overlapping dimensions, the two could be discriminated (p. 95). Cognitive and social complexity – however they may be operationally defined – appear to be distinguishable yet integrated, even symbiotic, and thus may expand behavioral repertoire in ways previously unexplored. H1:
Higher levels of self-reported cognitive complexity will be associated
with higher levels of self-reported social complexity. H2:
Higher levels of self-reported cognitive complexity will be associated
with higher levels of self-reported behavioral complexity.
10
Texas Tech University, Sara Dodd, December 2009
H3:
Higher levels of self-reported social complexity will be associated
with higher levels of self-reported behavioral complexity. The middle portion of the Leaderplex model is concerned with behavioral repertoire and behavioral differentiation, which to be consistent with cognitive and social complexity is framed as behavioral complexity. The model suggests that the more effective a leader is perceived to be, the more likely that leader is characterized as behaviorally complex. The challenge for a test of this part of the model is, of course, to have those perceptions measured from the perspective of others, and not the leader themselves. H4:
Higher levels of supervisor behavioral complexity as reported by
subordinates will be positively associated with higher levels of supervisor leader effectiveness, also as reported by subordinates.
Research Questions The Leaderplex model does not explicitly address how perceptions of one’s own behavioral complexity in a work environment may impact perceptions of a superior’s behavioral complexity. Hooijberg (1996) studied the effects of managerial leaders’ ability to vary leadership behaviors and found that while superiors’ had a positive perception of this ability, subordinates did not. His findings are interesting when considered in the context of leadership and self-concept. Lord has studied leadership categorization, attribution, and self-schema at some length and has consistently found relationships between subordinate affect (‘liking’), leadership style 11
Texas Tech University, Sara Dodd, December 2009
congruence between a superior and subordinate, and perceptions of leader effectiveness (Engle & Lord, 1997; Lord & Brown, 2004). More recent research suggests “that leadership effectiveness may be related to its ability to engender the feeling that the course of action advocated by the leader is consistent with one’s selfviews” (van Knippenberg, van Knippenberg, De Cremer, & Hogg, 2005, p. 496). Thus, it is useful to compare responses obtained in this study about self-perceived behavioral complexity to evaluations of supervisor behavioral complexity. RQ1:
What is the relationship between self-reported behavioral complexity
and assessments of supervisor behavioral complexity?
In line with previous studies of Extension organizations and professionals, selected variables will be examined through research questions in order to gain a better understanding of how the components of the Leaderplex model may interact with the sociodemographic and work-related characteristics of Extension professionals. Berrio (2003) conducted a study of Ohio State University Extension in which he used the Competing Values Framework developed by Cameron and Quinn (1999) to identify the dominant organizational cultures of OSU Extension. This same framework provides much of the theoretical underpinnings of the Behavioral Repertoire component of the Leaderplex model. Berrio grouped the respondents in his study into categories for gender, job title, age, and length of employment, finding that Extension professionals at the state level had a different dominant culture (Hierarchical) from the employees at the county and district level (Clan). Also using the CVF framework and measures, Parker (2004) 12
Texas Tech University, Sara Dodd, December 2009
studied the leadership styles of USDA-CREES agricultural communications and information technology managers. She found no significant style differences based on areas of management responsibility, level of education, major for highest degree earned, age, or tenure with organization or leadership position. However, Parker’s findings did indicate significant gender and regional differ rences in certain of the CVF quadrants/roles.
RQ2:
What is the effect of selected demographic and work environment
variables (e.g., age, gender, job level, tenure with Extension) on self-assessments of 2a
Cognitive Complexity
2b
Social Complexity
2c
Behavioral Complexity
2d
Supervisor Behavioral Complexity
2e
Supervisor Leader Effectiveness?
Key Terms Differentiation: The “number of dimensions and the number of categories within dimensions that are used by individuals in the perception of the physical and social environment” (Goldstein & Blackman, 1978, as cited in Hooijberg et al., 1997, p. 377). Integration: The “extent to which individuals can relate two or more orthogonal dimensions to produce an outcome that is determined by the joint demands of each 13
Texas Tech University, Sara Dodd, December 2009
dimension, system, or subsystem involved (Streufert & Swezey, 1986, as cited in Hooijberg et al., 1997, p. 378). Complexity: Whether considered in the context of cognitive, social, or behavioral complexity, complexity is a function of an individual’s ability to differentiate and integrate perceived dimensions in any given environment. Cognitive Complexity: Refers to “the degree to which a potentially multidimensional cognitive space is differentiated and integrated” (Hunt, 1991, p. 124). As described by Hooijberg et al., “cognitively complex individuals process information differently, and perform certain tasks better, than cognitively less complex individuals because they use more categories or dimensions to discriminate among stimuli and see more commonalities among these categories or dimensions” (p. 378). Social Complexity: Defined by Hooijberg et al. as the leader’s “capacity to differentiate the personal and relational aspects of a social situation and integrate them in a manner that results in increased understanding” or altered behavioral intentions (p. 382). Behavioral Complexity: The extent to which a leader employs multiple kinds of leader roles (behavioral repertoire) and performs them in varying levels and ways that are situationally appropriate (behavioral differentiation) (Hooijberg et al., p. 388). Leader Effectiveness: The extent to which supervisors are perceived to meet performance standards, compare favorably to their peers, serve as role models, as successful, as able to effect change, and as generally effective in their role as managerial leaders (Hooijberg, 1996). 14
Texas Tech University, Sara Dodd, December 2009
Land-grant University: An institution for higher education established under the provisions of the Morrill Land-Grant Colleges Acts of 1862 or 1890. Funded by the sale of unclaimed public domain lands, the foundational purpose of these institutions was to provide broader public access to higher learning and that in particular, a “practical education in agriculture and engineering would be emphasized” (Rasmussen, 1989, p. 23). Each U.S. state, territory, and the District of Columbia has at least one land-grant institution within its borders. (McDowell, 2001; Rasmussen, 1989). Cooperative Extension System: Established by the Smith-Lever Act in 1914 and designed as a partnership between land-grant universities, the U.S. Department of Agriculture (USDA) and county and state government entities. The legislation provided a clear purpose: “To aid in diffusing among the people of the United States useful and practical information on subjects relating to agriculture and home economics and to encourage application of the same” (Rasmussen, 1989, p. 49). Extension Professional: Any Extension employee being sampled in this study, including county and state agents, educators, specialists, and directors, in addition to district administrators, district and regional program specialists, and regional program directors. Extension Programs and Academic Units:
Agriculture and Natural Resources,
Family and Consumer Sciences, Community and Economic Development, 4-H and Youth Development, Forestry, Wildlife Services, Agriculture Experiment Stations.
15
Texas Tech University, Sara Dodd, December 2009
CHAPTER II BACKGROUND AND REVIEW OF THE LITERATURE The review of the literature that frames the purpose of this study is divided into two sections. First, a definition and description of the Cooperative Extension Service, its functions and functionaries, is essential in providing a framework to explore the Leaderplex model. This model of behavioral complexity is itself rather complex, and the use of Extension professionals as the target population is justified by an overview and history of the Cooperative Extension Service. This will be followed by an exploration of the literature supporting each component of the Leaderplex model. Cooperative Extension Service Background It is sometimes difficult for persons who have come of age in the latter years of the 20th century and the first decade of the 21st century to conceptualize the United States as a primarily agrarian society, which it most certainly was for the first 150 years of its existence. It is important to remember two important facts about the 18th century environment in which the American Republic came to be. First, the new country’s early leaders (namely, Washington, Jefferson, Adams, Franklin) were mostly highly educated gentlemen or successful merchants, some of whom had professions, but also were landowners – hands-on farmers who spent considerable time and resources in agricultural pursuits. Secondly, the assets that new country possessed to establish and distinguish itself as a viable economy and trading partner 16
Texas Tech University, Sara Dodd, December 2009
were primarily land and what could be produced with that land. Toward the end of his presidency, George Washington himself emphasized the importance of a sustained economic relationship between the agriculture development and public institutions. In an address to Congress, Washington observed: It will not be doubted that with reference either to individual or national welfare agriculture is of primary importance. In proportion as nations advance in population and other circumstances of maturity this truth becomes more apparent, and renders the cultivation of the soil more and more an object of public patronage. Institutions for promoting it grow up, supported by the public purse; and to what object can it be dedicated with greater propriety? . . . Experience accordingly has shown that they are very cheap instruments of immense national benefits. (cited in Rasmussen, 1989, p. 17) Some 65 years later, the first of the Morrill Land-Grant College Acts was passed (1862). While the ideal of education being made available to all had been around since the beginning of the Republic, the reality was that higher education continued to be the domain of the landed and monied classes. The family farmer who actually worked his own land was among those citizens least likely to have access to formal education and its benefits. A variety of private institutions dedicated to agriculturaloriented education had been established but generally were not sustainable (Rasmussen, 1989). A proposal from a Vermont senator (Morrill) that public lands be sold and the proceeds used to endow educational institutions in each state that made the “work of cow barns, kitchens, coke ovens, and forges the subject matter of their scholarship” (McDowell, 2001, p. 5), was not passed into law until after the Civil War began. Not surprisingly, lawmakers from Southern states (and a president with states’ rights sympathies, Buchanan) had been instrumental in the defeat of the 17
Texas Tech University, Sara Dodd, December 2009
legislation in the late 1850s – large landowners and slaveholders from what would become Confederate states saw no benefit to their interests and indeed, some harm, from Morrill’s proposal. After the Civil War ended, and the former Confederate states re-entered the Union, and new states joined, the same public land scrips were issued. Subsequent extensions to the Morrill Act and complementary legislation (Hatch Act 1887) saw the expansion of appropriations and support for agricultural-related research (experiment stations). Finally, with the passage of the Smith-Lever Act of 1914, land grant institutions, agricultural experiment stations, and the United States Department of Agriculture (USDA) were brought together to formalize and extend cooperative relationships.
Family and Consumer Sciences and Cooperative Extension The establishment of the land-grant universities had the effect of democratizing higher education not only for American men, but also for women. After the Civil War ended, five land-grant institutions in the Midwest states began admitting female students to new departments to study what became known as home economics (Richards, 2000). The guiding philosophy behind the birth of this new academic discipline was similar to that which sought to bring scientific knowledge and methods to farming – young women also could/should be taught “to apply science to the management of their homes” (Richards, p. 81). Toward the end of the 19th century and the first decade of the 20th century, home economics and Extension began moving toward one another. 18
Texas Tech University, Sara Dodd, December 2009
Rasmussen reports that establishment and development of the early boys’ and girls’ clubs (which often focused on growing crops, home gardening, canning, and so on) was not merely a springboard for 4-H clubs. In addition, these clubs involved not only mothers of club members but also women educated in home economics who acted as training “collaborators” and became known as home demonstration agents (Rasmussen, 1989, p. 34). By the time the Smith-Lever Act was passed in 1914, the concept of extension incorporated “all interests of country life” – not just the business and science of farming but also education/opportunities for youth, home construction, sanitation, food safety, and all other aspects of home management (p. 44). If an issue or topic wasn’t an educational goal or objective for an Extension agricultural agent, it was for the Extension home economist. Home economics was formalized as a profession in 1909 (Richards, 2000) after approximately fifty years of existence as an academic discipline. The first female Extension agents often were school teachers who either worked summers in the home demonstration role or moved from classroom teaching into fulltime Extension education. When federal resources were allocated to support the training and employment of home economics teachers for secondary education, more colleges and universities added home economics departments, thus providing a more reliable source of educators. However, with policies of employing only non-married women, the turnover rate among Extension home economists was high (Rasmussen, 1989). The development of the home economics profession shares some parallels with that of the home economics extension agent. In the early 1970s, it was observed 19
Texas Tech University, Sara Dodd, December 2009
that home economics could be viewed in more than one way (Marshall, 1973, reprinted in 2001). Were home economics a core curriculum where the course of study for every student included courses related to food and nutrition, textiles and clothing, child development, home design, and family financial management? Or, was it a set of disparate disciplines that shared a non-binding characterization of being connected to various aspects of family and consumer development/behavior? At many universities, this latter conceptualization seemed to be related to a period of identity confusion in the late 20th century which ultimately led not only to name changes among colleges and academic units but also for the profession itself. In 1993, a national taskforce of home economics professionals officially changed the name of the American Home Economics Association to the American Association of Family and Consumer Sciences (Richards, 2000). Cooperative Extension also adopted the Family and Consumer Science moniker for its agents and specialists. Extension FCS professionals who work in the field as county agents or specialists, in particular, may best exemplify the original home economist concept. They not only are expected to have knowledge and skills in an already wide and growing range of subjects related to raising families and managing households, they also work extensively with all levels of clients, volunteers, and government entities as well as across department lines with colleagues (e.g., with 4-H/Youth Development educators). Moreover, the clientele of Extension FCS professionals can be found living and working with family structures
20
Texas Tech University, Sara Dodd, December 2009
and living circumstances far more diverse than was the case in the early 20th century (Rasmussen, 1989).
The Mission of Cooperative Extension The explicit public service mission of Cooperative Extension has altered very little in nearly 100 years. In 1989 the formal mission statement for the Cooperative Extension System (as it was known at that time) was to help “people improve their lives through an educational process which uses scientific knowledge focused on issues and needs” (Rasmussen, 1989, p. 4). More recently, according to the USDA website, the mission statement for the Cooperative State Research, Education, and Extension Service (CREES) is to advance “knowledge for agriculture, the environment, human health and well-being, and communities through national program leadership and federal assistance” (accessed September 4, 2009). Each state Extension organization has its own mission statement which is consistent with CREES. The Work Environment of Cooperative Extension Delivering science-based knowledge to agricultural producers, consumers, and their respective communities (McDowell, 2001; Rasmussen, 1989): This is the Extension with which most ordinary American citizens are familiar – the county agents who can be consulted about everything from hybridized plants and seeds, soil testing, and large-scale irrigation to 4-H livestock programs and textile projects in boys and girls clubs, nutrition education for families, and financial literacy classes for 21
Texas Tech University, Sara Dodd, December 2009
would-be homeowners. The mission has, in many ways, changed very little. However, the same cannot be said for the environment in which today’s Extension professionals must enact this mission. Briefly mentioned in Chapter I, the men and women who hold professional Extension positions must be highly educated. The primary service delivery position is the county Extension agent or educator, and individuals in these positions must hold a minimum of a bachelor’s degree in the appropriate field, with an explicit preference for individuals with master’s degrees or plans to obtain the master’s degree. Some positions have minimum requirements for master’s degrees or beyond (Journal of Extension National Job Bank, 2008). In addition, many Extension professionals have joint appointments with Extension and with an academic department at the land grant university with which their state’s Extension services are affiliated (usually within academic units such as Colleges of Agriculture, Human Sciences, Human Ecology, or something similar). These appointments may take the form of non-tenure track faculty, but it is not uncommon for land grant universities to count Extension professionals among their tenure-track faculty. These are individuals who are simultaneously developing and delivering community education, supervising community volunteer leaders, fulfilling resident instruction commitments, conducting applied research for Extension while somehow finding time and energy to carve out their own research programs. McDowell (2001) speaks of the professional challenges many Extension faculty face as they try to balance their work as committed professionals while endeavoring to 22
Texas Tech University, Sara Dodd, December 2009
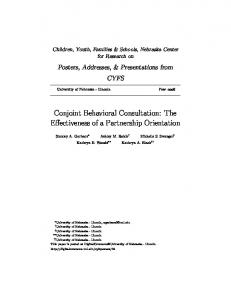
meet scholarly and collegial expectations. Other researchers concurred, finding that Extension “administrators think that specialists support agents, department heads see specialists primarily as faculty members, … and specialists fall in between these two expectations” (Ward, Bailey, & Godfrey, 2002, as cited in Hoag, 2005, p. 405). It is appropriate to provide a current example of the type of multifaceted individuals that various state Extension offices are seeking for vacant positions in order to better understand the scope and depth of the working environment for Extension professionals. Figures 2.1 and 2.2 contain job descriptions obtained through the Journal of Extension website ("Journal of Extension National Job Bank," 2008). These descriptions provide valuable insight into the vocational perspective and education background necessary for an Extension professional.
Position Category: Faculty Key Words: 4-H, Youth Development, engaging youth, developing youth life skills Additional This position has an Extension/Outreach component. Description: This position is a tenure-track position. This position includes a research component. Minimum education An earned doctorate or terminal degree in youth development, education, level: or closely related field is required. Required major/deg:
Course work in educational methods is required.
Years of experience: At least three years of experience of Extension field based programs or other community based youth development program leadership and management is preferred
Figure 2.1. Job listing for a state-level Extension Specialist position.
23
Texas Tech University, Sara Dodd, December 2009
Official Title: Agent, Extension Educator-Family and Consumer Sciences Description: Faculty, Tenure/Tenure-Track Responsibilities: • Identify problems, opportunities and needs of the intended audience. • Provide leadership and expertise for the development, management, growth and evaluation of a Family and Consumer Sciences (FCS) program emphasizing healthy lifestyles and nutrition, family financial management (including housing education), and healthy homes-healthy families, to include training of child care professionals and parents. • Supervise the Expanded Food and Nutrition Education Program (EFNEP). Provide program leadership for one Nutrition Assistant and one Administrative Assistant. • Collaborate with faculty/staff in the region to deliver a multidisciplinary FCS program. • Develop a strong working relationship with community partners and organizations that interface with adults, youth and communities. Seek ways to promote diversity. • Develop resources through grants, local funding sources and collaborative funding proposals to support and expand family and consumer sciences programs; utilize available resources, including state specialists and programs, and other federal, state and local resources, as needed, to maintain and enhance programs. • Participate in Extension programs and events locally, statewide, and nationally, and provide support to and participate in the Extension Advisory Council; market programs to communities and stakeholders and promote positive public relations. • Serve on county, regional, state and university committees and non-university committees, as appropriate. Minimum Required – education • Master’s degree, at least one degree in health, nutrition, education, family level: studies, financial management, family and consumer sciences, community sociology, community development, or related field.
Figure 2.2. Job listing for a County Extension Agent/Educator in Family and Consumer Sciences position.
24
Texas Tech University, Sara Dodd, December 2009
As is the case with many individuals who work in the education and public service arenas, Extension professionals’ motives for seeking and sustaining employment with a Cooperative Extension entity have little to do with accumulating personal financial wealth. Given the minimum education requirements (and the current cost of even one college degree) and the multiple and varied job duties and responsibilities, individuals who become Extension professionals may choose to do so out of a sense of vocational calling. It is a time-consuming career, one with a substantial set of challenges for a healthy balance of work and family life (Lepley, 2003; Strong & Harder, 2009) as well as a healthy balance of personal career goals vs. collective organizational goals (Huffman & Just, 2000). It is also a career enacted in an operating environment no less complex than any that might be found in the private, for-profit sector. Frequent overnight travel is common to most professional Extension positions, and Extension professionals must answer to a dizzying array of stakeholders, particularly those agents and specialists who hold dual appointments as faculty members. For example, the work of the county Extension agent is both directly and indirectly impacted by academic department heads and colleagues at host land grant institutions, senior state Extension administrators; regional program directors, district Extension administrators, subject matter specialists, fellow Extension agents, and a wide variety of community members (county officials, public school system administrators and educators, civil servants, citizen volunteers, and of course, the actual client recipients of service and education). In turn, administrators 25
Texas Tech University, Sara Dodd, December 2009
are accountable to the institutional hierarchies of the host land-grant university and/or other government entity. And, because of the way in which the funding for Cooperative Extension activities traditionally has been funded (by federal, state, and county governments) Extension professionals are also servants of taxpayers. Given this context, it is reasonable to assert that individuals who choose to work as Extension professionals may do so out of a sense of calling to a higher purpose with a strong orientation to service; that is, extending the benefits of education and knowledge to members of the community who otherwise would have little or no access to it. The contemporary operating environment for Extension professionals is an important consideration in the context of the current study. As noted above, Extension professionals who work at the levels of creating knowledge (research), delivering information (education), or managing those processes for the agricultural and other client communities, have their work defined by multiple stakeholders. The structure that has guided this work has seen a gradual but definite shift in funding mechanisms, moving from federal and/or state formula funding to competitive grant funding (Huffman & Just, 2000). No longer does an Extension professional with an academic appointment have unfettered access to the resources that previously supported research activities. In today’s dynamic budget and political environment, Extension professionals are no different from private sector professionals in that they must compete for resources on a cost-benefit basis (Hoag, 2005). Moreover, they may be seeking program support from multiple entities whose operating goals conflict 26
Texas Tech University, Sara Dodd, December 2009
because of their own internal pressures. For example, an academic department head pushing for scholarly publications likely is being pushed by a college dean or university provost to boost research output. An Extension administrator pressuring program directors and specialists to continuously develop new educational programming, programming which may require labor-intensive grant writing, may be doing so because he or she in turn is being pressured by Extension senior administrators. The environmental complexity that Extension professionals and supervisors face in their work highlights a need for continuous differentiation of roles and behaviors alongside ongoing synthesis (integration) of resources and relationships that make effective performance possible.
Leaderplex Model The Leaderplex model (Hooijberg et al., 1997) was introduced at a time when few in the leadership discipline characterized leadership as being derived from multiple sources of individual complexity operating at the same time. When modern researchers began to deconstruct the phenomenon of leadership the focus for the first half of the 20th century was on leadership as a “focus of group change, activity, and process” (Bass, 1990, p. 11) – that is, leaders are identifiable by influential social institutions through which they act as central players. While many researchers during this period focused on group processes and structures, others turned to considering the leader’s ability to stay ‘central’ as a function of personality – the supposition that persons typically characterized as effective leaders tended to share certain traits. 27
Texas Tech University, Sara Dodd, December 2009
After 1950, however, leadership scholars turned to other disciplines to better understand what they increasingly recognized as more pertinent than personality traits – complex sets of behaviors chosen to persuade and influence others in order to achieve goals (Bass, 1990). Specifically, they looked to the complexity theories emerging from social and organizational psychology (Hunt, 1991). Cognitive complexity found its way from social and behavioral psychology to studies of managerial leadership during the 1970s and has since been written about extensively in the leadership and organization behavior and communication literature (Bartunek, Gordon, & Weathersby, 1983; Burleson & Caplan, 1998; Driver, Brousseau, & Hunsaker, 1990; Hunt, 1991; J. R. Larson, Jr., 1982; L. L. Larson & Rowland, 1974; McGill, Johnson, & Bantel, 1994; Samter, 2002; Streufert & Swezey, 1986; Woehr, Miller, & Lane, 1998). Social complexity, however, was a term used by Hooijberg et al. to describe an area of complexity that has been variously related to or associated with social cognition, social/emotional intelligence, emotional experience, and affective complexity (Halberstad et al., 1996; Kang et al., 2005; Kang & Shaver, 2004; Mayer & Salovey, 1997). Certainly the Leaderplex model was among the first to speak of a social complexity construct as a moderator/mediator of behavioral complexity (although Denison, Hooijberg, and Quinn (1995) observed that other forms of complexity – in particular, emotional complexity – merited more direct consideration). Despite the implicitly integrated nature of their model, Hooijberg et al. draw no explicit links between cognitive and social complexity. However, they are careful to distinguish their operational definition of social complexity as an individual 28
Texas Tech University, Sara Dodd, December 2009
rather than a group phenomenon. Hooijberg et al. define social complexity as an individual’s “capacity to differentiate the personal and relational aspects of a social situation and integrate them in a manner that results in increased understanding” (p. 382), and behavioral complexity as a function of behavioral repertoire and behavioral differentiation (the ability to choose and perform a leader behavior, or role, which fits the organizational situation). Each type of complexity pertinent to the Leaderplex model – cognitive, social, and behavioral – is reviewed separately. Cognitive Complexity The phrase cognitive complexity emerged in the language of psychology researchers in the mid-20th century (Halberstad et al., 1996) as they studied the nature of cognitive structures and how such structures are used to mediate the “input-output sequence” of stimulus information and judgment responses (Bieri et al., 1966, p. 184). Kelly (1955, as cited in Bieri et al., 1966; Halberstad et al., 1996), saw cognitive complexity as a function of how many personal/functional constructs an individual uses to perceive and process events and people. Bieri et al. defined cognitive complexity as “an information processing variable which helps us predict how an individual transforms specified behavioral information into social or clinical judgments” (p. 185). From these origins come the elements that are characteristic of any type of complexity: The way in which humans perceive, process, and apply information can be viewed as a spectrum ranging from few to many, simple to complex. The work of Lundy and Berkowitz, and then Zajonc, expanded the consideration of cognitive complexity beyond personality and information 29
Texas Tech University, Sara Dodd, December 2009
processing. Lundy and Berkowitz (1957, as cited in Halberstad et al., 1996) noted that “because information can only be understood if it relates to a meaningful construct, and cognitively complex people have more such constructs, then cognitively complex people would be better able to process and integrate new ideas” (p. 128). Zajonc (1960, as cited in Halberstad et al., 1996) highlighted the influence of the perceived need for complexity, noting that when there is an expectation that communication of information is required, message senders not only recall information, they recall more information (i.e., differentiation); furthermore, they will impose more organization on the information to be presented (integration). Somewhat related to social complexity, however, is Streufert and Swezey’s observation that “Not all situations or tasks require or warrant the application of a cognitively complex style. In some settings such a style may even be counterproductive, limiting the effectiveness of those complex individuals who are unable to “turn off” their multidimensional approach as it becomes appropriate” (1986, pp. 31-32). In sum, through the synthesized work of the above researchers and other scholars (e.g., Streufert & Streufert, 1978; Streufert & Nogami, 1989; Scott, Osgood, & Peterson, 1979; Wegner & Vallacher, 1977; as cited in Hunt, 1991), individual cognitive complexity (CC) has come to be conceptualized as the degree to which an individual can distinguish between cognitions, domains, and/or structures (differentiation) and combine them (integration) as a function of context (domain). A more pragmatic paraphrase is offered by Brousseau: “Cognitive complexity refers to the amount and variety of information, concepts and methods that a person uses in 30
Texas Tech University, Sara Dodd, December 2009
his/her life” (1988, as cited in deJanasz & Behson, 2007, p. 399). In other words, individuals characterized as high in CC seem to use and respond to more sources of cognitive information about situations, people, and relationships than do individuals who are less cognitively complex. The implication is that because individuals with high CC have the ability to exploit multiple sources of information (differentiation), and to make sense of that information in more meaningful ways (integration), the quality of their decision-making and/or behavioral choices is assumed to be more effective. Another aspect to the notion that expert leaders tend to be cognitively complex individuals is the issue of cognitive capacity, or power. Hooijberg, Hunt, and Dodge paraphrase Jaques’ 1989 definition of cognitive capacity/power as “the scale and complexity of the world that one is able to pattern and construe, including the amount and complexity of information that must be processed in doing so” (Hooijberg et al., 1997, p. 379). Like cognitive complexity, cognitive capacity does not seem to be related to conventional measures of intelligence; however, unlike cognitive complexity, cognitive capacity is not categorized as “domain specific” (Jaques, 1989, as cited in Hooijberg et al, 1997, p. 379). That is, cognitive capacity is the foundation upon which rests varying degrees and domains of cognitive complexity. This suggests that individuals can become more cognitively complex individuals (through competency training, development, experience, and so on), with that growth varying from one domain to another, but only to the extent that their individual cognitive capacity or power permits (Jaques and Clement, 1991). Jaques 31
Texas Tech University, Sara Dodd, December 2009
(1989, as cited in Hooijberg et al., 1997) asserts that cognitive capacity is predefined and finite, and thus cannot be expanded through training and development efforts. The notion of cognitive capacity, and its implications for leader effectiveness, continues to be debated. In their study of work family conflict, de Janasz and Behson (2007) considered the effect of cognitive capacity, which they defined to include an individual’s tolerance for uncertainty/ambiguity. Based on their findings, de Janasz and Behson suggest that “individuals with an enhanced cognitive style are able to effectively assess and interpret demands and changes in their work . . . and then refine or redefine their approach to meeting those demands” (p. 405) – a conclusion that is consistent with the notion of behavioral complexity. Social Complexity Keeping to the definition of complexity as it operates in the Leaderplex model, an individual who manifests high levels of social complexity is one who is able to differentiate between a wide range of emotions, social behaviors, interpersonal relationships and social contexts and to use that knowledge in synthetic ways (integration) to respond (or not respond, as the case may be) to people and situations in ways that increase understanding and/or facilitate the accomplishment of social goals (Hooijberg et al., 1997). In other words, social complexity refers to the ability of an individual to utilize emotional intelligence and a variety of interpersonal skills in appropriate ways and to the extent called for by various types of social settings. Social complexity is not as singularly defined or discretely understood as cognitive complexity. Various researchers often describe components of social 32
Texas Tech University, Sara Dodd, December 2009
complexity (either differentiation or integration) as a subset of cognitive complexity, label it as a point on a cognitive spectrum (Streufert & Nogami, 1989), or refer to it as social intelligence (Cantor & Kihlstrom, 1987, as cited in Hooijberg et al., 1997, p. 382). Psychologists began to recognize social intelligence as a distinguishable component of cognitive functioning in the middle 20th century (Mayer & Salovey, 1997). Emotional intelligence (EI) has emerged more recently as yet another type of intelligence that seems to fit better with conceptions of affect as opposed to cognition. Yet, as Mayer and Salovey observe, intelligence implies ability and thus emotional intelligence – defined in part as “reasoning that takes emotions into account” – also requires a certain level of mental or cognitive ability (p. 4). Kobe, Reiter-Palmon, and Rickers (2001) compared social and emotional intelligence in recognition of the social and emotional components of leadership, noting that “Social interactions are laden with affective interpretations . . . individuals who are able to assess their own and others’ emotions and appropriately adapt their behavior for a given situation based on this assessment are expected to be leaders” (p. 154). Their review of emotional intelligence (pp. 155-156) revealed considerable support for EI as a key component of effective leadership (Goleman, 1995 & 1998; Bar-On, 1996 & 1997; O’Neil, 1996; Feldman, 1999; and Sosik & Megerian, 1999, as cited in Kobe et al.). Kobe et al. found that while measures of both social intelligence and emotional intelligence explained a significant amount of the variance in selfreported leadership experiences, the role of emotional intelligence was less unique 33
Texas Tech University, Sara Dodd, December 2009
and more complementary. They further suggested that since emotional intelligence may be a subset of social intelligence, perhaps just one measure could be used to assess the influence of this general construct upon individual differences in leadership. Kang, Day, and Meara (2005) continued exploring the similarities and differences between social intelligence (SI) and emotional intelligence (EI), acknowledging their interdependency as a function of how accurately the feelings of others are perceived and how responses to those perceptions are mediated by individual levels of social knowledge. They further characterized socially and emotionally intelligent people as having “rich” social and emotional knowledge and the ability to access it, as well as the capacity to “entertain multiple perspectives and hypotheses about unusual social/emotional behavior or behavior in unfamiliar social/emotional situations” (p. 100). These characteristics are consistent with the differentiation and integration components of complexity central to the current study. Sommers (1981, as cited in Kang & Shaver, 2004) linked social and cognitive complexity together to explain individual variance in emotional range (that is, an individual’s ability to differentiate between emotions perceived in a given social context). Her efforts to develop a measure of “emotional range” indicate that “people with advanced social cognitive complexity tend to have more varied emotional experiences” (p. 691). Hooijberg et al. highlight the ability to differentiate emotions in self and others as a “key component of social differentiation” (p. 383). This capacity is likewise key to effective social integration – that is, the ability to enact, 34
Texas Tech University, Sara Dodd, December 2009
develop and exploit social capital across different settings (Brass, 1996, as cited in Hooijberg et al., p. 385). Kang and Shaver (2004) explored what they termed emotional complexity in their effort to develop an instrument which would measure differences in an individual’s ability to differentiate and make distinctions between and within groups of emotions. They argued that cognitive complexity, personality, and interpersonal experiences work together to produce emotional complexity and that, in turn, higher levels of emotional complexity are associated with greater empathy and adaptability in relationships with other people. Kang and Shaver utilized multiple measures (including emotional intelligence, emotional expressiveness, self-consciousness, selfmonitoring, interpersonal capabilities, personality inventories, and more) in extensive cross validation studies for the Range and Differentiation of Emotional Experience Scale (RDEES) they developed. They concluded that their instrument was an appropriate and useful measure of the complexity inherent in using emotional information in social environments. The RDEES fills a gap noted by Hooijberg et al. (1997, p. 387) and is discussed in greater detail in the Measures section. Behavioral Complexity The concept of behavioral complexity was a natural outgrowth of the scholarly effort expended on cognitive complexity and its associated constructs (e.g., social complexity, emotional complexity, self-complexity, and so on). Once the constructs of cognition and affect became well established and accepted as integral components of the processing structure used by managerial leaders, it was a logical 35
Texas Tech University, Sara Dodd, December 2009
progression to look at the more tangible or explicit expressions of human cognitive and social complexity – that is, behavior. The effects of varying levels of cognitive and social complexity are observed and experienced only through the adaptive behavior of individuals. In other words, the ability of any given individual to utilize differentiated and integrated cognitive and social/emotional information (cues) is meaningful only in the context of action choices (multidimensional judgments) directly stimulated by that ability (Satish, 1997). The context is yet another element to behavioral complexity that is particularly relevant to the sample used in this study. According to Streufert and Swezey (1986), the demands of an organizational operating context, or environment, interact with individual information processing differences (which introduces another type of complexity, interactive complexity, which is not addressed by this study). As has been previously alluded to, Extension professionals operate with a relatively welldefined task load in an environment shaped by diverse and fluid client needs, a strong organizational culture, and a hierarchical authority structure that is frequently confounded by multiple directors of work yet comparatively little direct daily oversight or supervision. In the complexity of this setting, understanding what kind of relationship exists between higher levels of cognitive, social, and behavioral complexity and environmental complexity becomes critical to understanding why some Extension professionals are considered to be more effective leaders than others. So, what does behavioral complexity look like? Similar to cognitive complexity and social complexity, behavioral complexity as a construct has been 36
Texas Tech University, Sara Dodd, December 2009
defined and classified in more than one way. Paulhus and Martin (1988) conducted a construct validation study using multiple measures of behavioral variability in order to create an index of what they referred to as functional flexibility, defined as the capacity and facility of performing situationally-appropriate social behaviors (p. 99). Paulhus and Martin made a strong case for the adaptive and interpersonal behavioral repertoire of functionally flexible individuals. Along similar lines, Hall, Workman, and Marchioro (1998) studied the effects of sex, task, and behavioral flexibility on leadership perceptions, defining behavioral flexibility as an interpersonal ability “to make different (and presumably, appropriate) social responses in different social contexts” with the implicit assumption that “flexible individuals have the social knowledge and perceptiveness to match their behavior to situational demands” (p. 4). Samter, Burleson, and Basden-Murphy (1989) conducted an interesting communication study which hypothesized that cognitively complex individuals would have stronger responses to behaviorally complex messages and more differentiated impressions of the message sender. Using multiple levels of what they described as “comforting” messages in an experimental setting, Samter et al. found that the strength of the effect of messages described as more behaviorally complex was a function of the message recipient’s cognitive complexity. This finding holds interest for the current study’s hypothesized relationship between what is reported for one’s own cognitive complexity and what is reported for a supervisor’s behavioral complexity.
37
Texas Tech University, Sara Dodd, December 2009
With cognitive complexity and social complexity, the notion that an individual receives and processes a variety of information, much of it presenting some form or level of conflict to be cognitively or emotionally resolved, may present a difficult but not totally disconcerting intellectual challenge. However, when it comes to human behavior – that external expression of an individual’s response to information, people, and events – it can be uncomfortable to enact or experience truly differentiated and integrated behaviors. Indeed, for students of leadership to ponder how individuals are transformed into effective leaders is to step into the territory of constructive paradox – constructive because what may appear to be contradictory, even randomly chaotic, leadership behavior in fact plays a critical role in what is perceived as high performance, or excellence (Quinn, 1988). The notion of paradox and contradiction in effective leadership was advanced through Quinn’s studies and consultations in the arena of organizational effectiveness, where over and over again he and his colleagues found that the most successful organizations were led by managerial leaders not bound by a one-dimensional management or leadership orientation (Quinn & Rohrbaugh, 1981). Quinn labeled these leaders master managers, individuals who discern and follow the cue that when one managerial behavior isn’t working, they switch to another one; one that their expertise (or experience) as managerial leaders ‘tells’ them will work better, even if it seems to be directly opposite to the method or behavior being set aside. Looking at these individuals from the outside, their behavior indeed seems paradoxical.
38
Texas Tech University, Sara Dodd, December 2009
Quinn (1988) proposed that managerial leaders characterized as effective do not limit themselves to espouse just one or few management techniques. Rather, they tend to operate in a framework of “competing values” -- competing because the behaviors which serve as expressions of these values appear to be at odds with each other, such that any effectiveness one behavior may have in a given management situation cancels out the effectiveness of the other, competing behavior. That is, if different managerial or leader behaviors were to go head to head, so to speak, only one would (even should) prevail. The reality is more synergistic: In certain situations, competing behaviors can be combined (differentiated and integrated) to achieve a level of excellence higher than any single behavior could effect on its own. Derived from established information processing and organizational behavior models, the competing values of Quinn’s framework are categorized according to four basic orientations or models for managing or leading; rational goals, internal processes, human relations, open systems (Quinn, 1988). Each of these orientations, which are recognizable under similar labels in other leadership models or typologies (Bass, 1990; Yukl, 2002), stand on their own merits in the literature for management and/or organization behavior. The Competing Values Framework (CVF) makes it possible to see how each model has two complements and one opposite. The models are graphically presented as four quadrants bisected by two axes; the vertical axis representing the extremes of flexibility and control, the horizontal axis representing the extremes of focus (internal and external). Quinn then uses this framework to identify key leader behaviors, or roles, that have a theoretical home in one of these 39
Texas Tech University, Sara Dodd, December 2009
four models (two roles to each model, for a total of eight roles). These are behaviors which, when used by a manager interchangeably while more or less simultaneously, would appear to be contradictory. Figure 2.3 presents a graph of the framework as it appears in the textbook developed by Quinn, Faerman, Thompson, and McGrath (2003) for which the CVF serves as the theoretical and instructional foundation.
Flexibility
Open Systems
Human Relations
Mentor
Innovator
Facilitator
Broker
Internal
External Monitor
Producer
Coordinator
Director
Internal Process
Rational Goals Control
Figure 2.3. Competing Values Framework (Quinn,1988)
In the early 1990s, Hart and Quinn (1993) juxtaposed these four orientations as executive-type roles, calling them Vision Setter (open systems), Motivator (human 40
Texas Tech University, Sara Dodd, December 2009
relations), Analyzer (internal processes), and Task Master (rational goals), for a study of the relationship between executive leaders (CEOs), behavioral complexity, and organization performance. They found that the CEOs rated as highly effective (based on objective measures of firms’ business performance) were also individuals with the highest levels of self-reported behavioral complexity – that is, high scores across all four roles (four items for each role, 16 items in all). Moreover, high levels of behavioral complexity were associated with high levels of performance no matter the organization’s size or operating environment, which Hart and Quinn construed as indicative of behavioral complexity as a “somewhat universal capability” (p. 559). With the benefit of hindsight, these findings are not surprising. Of greater pertinence, perhaps, is the inference Hart and Quinn drew about the relationship between the longevity of work experience, interpersonal relationships, acquisition of knowledge and sustained high performance. Since the sample for their study was comprised entirely of individuals leading at the executive level, it is difficult to say just what the relationship is between experience and behavioral complexity. Denison, Hooijberg, and Quinn (1995) expanded Quinn’s conceptual development of the behavioral complexity manifested by effective leaders to consider its relationship and/or interaction with cognitive complexity as the accepted condition for high performing leaders. They suggested that while cognitive complexity is in fact necessary for effective leadership, behavioral complexity is the sufficient condition because it “connotes action as well as cognition; that is, effective leadership must be the ability to both conceive and perform multiple and contradictory roles” (p. 525). 41
Texas Tech University, Sara Dodd, December 2009
Denison et al. tested the construct and convergent-discriminant validity of the eight leadership “roles” that comprise the Competing Values Framework with a sample of mid-level public utility executives and their subordinates, using multidimensional scaling techniques. Their results indicated that the subordinate ratings for highly effective managers were a good fit for the two dimensions of the CVF. The managerial leaders who received the highest ratings from their subordinates manifested relatively stronger performance across all eight roles of the framework, demonstrating an ability to recognize the value of using a variety of behaviors as well as a willingness to employ non traditional managerial behaviors when circumstances indicate the benefit of doing so. Denison et al. noted an important gap in the study of managerial leadership and complexity – the need for a better understanding of other forms of complexity other than cognitive complexity. In particular, they recommended further exploration and conceptualization of emotional complexity, noting that “the complexity of the emotional relationship between leaders and their followers is often underestimated by traditional leadership theorists, and is critically important to understanding leadership issues” (p. 537). The following year, Hooijberg (1996) undertook a more focused study of the behavioral repertoire employed by managerial leaders in interactions with peers and superiors as well as subordinates. In this study, behavioral complexity is recognized as revolving around a leader or manager’s ability to “manage a network of relationships that includes superiors and peers as well as subordinates”, with the obvious extrapolation that “As the size and differentiation of a leader’s network 42
Texas Tech University, Sara Dodd, December 2009
grows, so does the potential for paradox and contradiction” (p. 919). This was a more deliberate attempt to separate behavioral differentiation and behavioral repertoire – distinguishing an individual’s ability to discriminate between various managerial or leadership behaviors and the ability or will to incorporate that discrimination into a “portfolio of leadership functions” (p. 919). As was done in the 1995 study (Denison et al.), Hooijberg used Quinn’s Competing Values Framework and associated role/function measures, but combined them with managerial effectiveness ratings obtained not only from subordinates, but also from peers and superiors. Hooijberg also tested behavioral differentiation and repertoire vis à vis effects of sex, age, education, and years in position. His results supported the hypothesized positive relationship between behavioral repertoire and managerial effectiveness for all three rating groups (subordinates, peers, and superiors) but interestingly, the results for the association between behavioral differentiation and managerial effectiveness were mixed. In fact, positive correlation between the two variables was leadership function specific: Differentiated behaviors were viewed as less effective in people-oriented leadership functions (e.g., mentoring). In addition, Hooijberg found that sex, age, and education carried more weight with the effectiveness ratings of peers and superiors than they did with subordinate ratings (p. 941). The articulation of the Leaderplex model followed closely on the heels of Hooijberg’s 1996 study. Hooijberg, Hunt, and Dodge (1997) deconstructed the familiar components of complexity (differentiation and integration) for cognitive and social complexity before turning their focus on the heart of the model – behavioral 43
Texas Tech University, Sara Dodd, December 2009
repertoire and differentiation. In this instance, behavioral repertoire is not exactly the same as integration, nor is behavioral differentiation explicitly parallel to cognitive and social differentiation. Hooijberg et al. define behavioral repertoire as “the portfolio of leadership roles a managerial leader can perform”: The bigger the portfolio, the more likely it is that the leader can select appropriate roles and perform them effectively according to the situation and the “expectations of a variety of stakeholders” (p. 387). Behavioral differentiation, on the other hand, speaks to “the ability of managerial leaders to perform the leadership roles they have in their behavioral repertoire differently (more adaptively, more flexibly, more appropriately, more individually, and more situation specifically), depending on the organizational situation” (p. 389). The distinction is subtle: Behavioral repertoire reflects quantity (of roles) while behavioral differentiation seems to refer to the quality of effort able to be given to performing a role (e.g., more adaptively, more flexibly, and so on). Interestingly, behavioral integration is not discussed either directly or indirectly. The implicit assumption would appear to be that behavioral repertoire is the logical or natural outcome of cognitive and social integration, and not an integrative process in and of itself. Yet, the conceptualization of behavioral complexity being a function of repertoire and differentiation is more in line with Quinn’s CVF and theories of leader effectiveness. An individual who is able to achieve mastery, or at least some minimum level of competency, in each of the eight roles of the CVF could be said to possess a behavioral portfolio that will enable him or her to adapt appropriately in any given 44
Texas Tech University, Sara Dodd, December 2009
situation. Behavioral differentiation in the CVF, then, reflects the reality that some roles may come more easily to some managerial leaders than do other roles. Presumably through training, development, and experience, effective leaders are those who grow in both behavioral repertoire and behavioral differentiation – with perhaps the repertoire coming first (through education and development efforts) and the differentiation growing and progressing as they become more experienced as leaders. In an effort to test the fit of the CVF framework with theories of behavioral complexity, Lawrence, Lenk, and Quinn (2009) turned their attention to testing and refining the measurements that had been developed to measure an individual’s competency across the eight roles. Other researchers have been able to replicate the CVF’s structure and validity for organizational structure and culture (e.g., Buenger, Daft, Conlon, & Austin, 1996; Kalliath, Bluedorn, & Gillespie, 1999), yet Lawrence et al. recognized that while the CVF focuses on how leaders must behave as well as think in complex ways, it does not “connect these behaviors to the judgment of when such behaviors are appropriate” (p. 5). This is difficult to do because the CVF is built on four distinct theoretical management models, complicating efforts to establish convergent and discriminant validity through traditional factor analysis. Thus, Lawrence et al. focused on developing a CVF-based instrument to measure individual leader role behavior using structural equation modeling. The result of their efforts, the CVF Managerial Behavior Instrument, is discussed in greater detail in the Measures section as it was used to measure behavioral complexity in the current study. 45
Texas Tech University, Sara Dodd, December 2009
Hooijberg et al.’s operational definition for behavioral complexity supports Quinn’s Competing Values Framework on three levels (differentiation, integration, and context): Effective managerial leaders are individuals who are required to recognize situational, sometimes conflicting, cues across multiple domains (context), identify and evaluate options for responses to those cues (differentiation), and choose the appropriate combination of behaviors (integration).
Summary of Literature Review As explicated in the background and literature review, professional educators (teachers, researchers, and administrators) employed by Cooperative Extension comprise a particularly appropriate sample for a study of the heretofore untested relationships hypothesize in the Leaderplex model. As observed by McDowell (2001), Huffman and Just (2000), and Hoag (2005), Extension professionals perform their jobs in complex environments which demand fluid utilization of complex behaviors; e.g., visualizing and communicating desirable outcomes, planning work to achieve those outcomes, motivating discrete groups of others to participate in the process, fostering productive relationships, competing for resources, answering to multiple stakeholders, and so on. While studies of various types of complexity abound, as far as can be ascertained, there has been no empirical test of individual differences in the ability to differentiate and integrate cognitive and social information as it relates to individual behavioral repertoire and differentiation as reported by self and others. If the strength 46
Texas Tech University, Sara Dodd, December 2009
of cognitive and social complexity as antecedents to behavioral complexity can be determined as proposed in this study, the results may yield important implications for leadership development and training programs. Extension, with its historically strong ties to continuous development and delivery of knowledge as well as its need for effective leadership during a period of uncertainty and redefinition, is an appropriate organization with which to conduct this study.
47
Texas Tech University, Sara Dodd, December 2009
CHAPTER III METHODS AND PROCEDURES Research Design The purpose of the study was to test the relationships hypothesized in the Leaderplex model. Specifically, the methodology employed by this study investigated the presence and strength of relationship between cognitive, social, and behavioral complexity, and the ability of behavioral complexity to predict leader effectiveness. The research design for testing the relationship between these variables and other background variables incorporated a self-administered survey using an online URL link disseminated to a non-probability purposive sample (including only those individuals employed in a professional capacity by a Cooperative Extension Service in the United States). Figure 3.1 illustrates how the Leaderplex Model was compressed for testing/assessment purposes. Table 3.1 depicts the research design for the study. Each component of the research design is discussed in greater detail below.
Cognitive Complexity [Cognitive differentiation and cognitive integration]
H1: CC & SC
H2: CC & BC
Leader Effectiveness
Behavioral Complexity [Behavioral repertoire and differentiation] H4: Sup BC & LE
Social Complexity
H3: SC & BC
[Social differentiation and social integration]
Figure 3.1. Leaderplex Model compressed for study in the Extension environment.
48
Texas Tech University, Sara Dodd, December 2009
Table 3.1. Research Design for the Proposed Study.* Organizational Levels and Positions Included County agents/educators; specialists at all levels (county, district, region, state); administrators at all levels (district/county directors, regional program directors, dept chairs, deans, assoc./asst./executive directors * Key: CC 1990)] SC BC LE
Related hypotheses &/or research questions
Instruments Administered Self-report on CC, SC, and BC Report on supervisor’s BC and leader effectiveness Sociodemographic and work-related questionnaires
H1: ↑ CC ≈ ↑ SC H2: ↑ CC ≈ ↑ BC H3: ↑ SC ≈ ↑ BC H5: ↑ BC ≈ ↑ BCS RQ1: relationship between BC and BCS RQ2: association between dependent variables and selected categorical variables
Categorical Data Variables Analysis Gender Age
r β F
Tenure with Extension Job type
= Cognitive Complexity [Driver-Streufert Complexity Index (Driver, Brousseau, & Hunsaker,
= Social Complexity [Range and Differentiation of Emotional Experience (Kang & Shaver, 2004)] = Behavioral Complexity [Managerial Behavior Instrument (Lawrence, Lenk, & Quinn, 2009)] = Leader Effectiveness. [2 scales: (1) Ability to Lead Change and (2) Overall Performance (Lawrence et al., 2007)] BCS = Behavioral complexity scale completed by respondents about their immediate supervisor LES = Leader effectiveness scale completed by respondents about their immediate supervisor ↑ = higher levels; ≈ = association and/or prediction r = Pearson’s correlation coefficient β = regression F = analysis of variance
Sampling The population from which the study sample was drawn has been defined and described in Chapters I and II. Extension professionals at the county, district, regional and state levels from across the United States were recruited through their state offices, typically located at land grant institutions, using electronic mail invitations (Appendix A). Several state Extension organizations representing the West, Midwest, 49
Texas Tech University, Sara Dodd, December 2009
Southwest, and East regions of the U.S. were contacted through their directors’ offices. Four states agreed to participate, one from each region (Oregon, Ohio, Texas, and Pennsylvania). Measures Driver-Streufert Complexity Index (DSCI) A wide variety of instruments based upon performance indicators to measure cognitive complexity have been in use for over four decades. However, these instruments often favor one element of cognitive complexity at the expense of another (Streufert & Nogami, 1989). There are quasi-experimental simulation programs which evaluate cognitive complexity in decision-making activities, but these programs consume significant amounts of time and require specific equipment and software (Streufert & Nogami). The Sentence Completion Test (SCT) and Paragraph Completion Test (PCT) were modifications of Harvey’s ‘This I Believe’ instrument developed by Streufert and Schroder (1963, as cited in Streufert & Nogami, p. 111) and further adapted by Suedfeld, Tetlock, and Streufert (1992). The instrument gives respondents an incomplete sentence suggesting some sort of cognitive conflict to which a sentence- or paragraph-length response can be written and then scored for cognitive process (both differentiation and integration). When scored by thoroughly trained raters, these subjective measurements offer sound reliability (various studies report test-retest reliabilities ranging from.6 to .95) (Streufert & Swezey, 1986). However, in the context of an online survey, the SCT or PCT presented a number of significant challenges. 50
Texas Tech University, Sara Dodd, December 2009
First, the need for multiple instruments (to measure the different types of complexity and leader effectiveness as well as the demographic items) makes the survey a lengthy one at the outset. Given that the sample selected for this study is comprised of individuals working in demanding jobs and busy environments, keeping the survey as short as possible was important to keep them motivated to complete it. Secondly, and in a related way, the time constraints pose a risk to the validity of results obtained using the SCT or PCT: According to the scoring manual, the more time that is given to participants to read and formulate a response to the stimulus sentence, the higher the scores for complexity (Baker-Brown, Ballard, Bluck, de Vries, Suedfeld, & Tetlock, 1992). Without time constraints, there is a risk that some participants in the study may become bogged down and bored, choosing to skip the measure, and/or quit the survey altogether. Likewise, imposing a time constraint could result in incomplete responses by individuals who are, in fact, high in cognitive complexity. Finally, using a subjective measure such as the SCT or PCT makes it more difficult to compare individual differences in CC between subordinate and superior groups than would the use of an objective measure, such as the DriverStreufert Complexity Index, or DSCI. An earlier form of the DSCI was initially developed by Driver and Streufert some forty years ago (Streufert & Swezey, 1986). Unlike other pen and paper measures which are designed to provide a relatively quick assessment of the content of an individual’s thoughts (‘what’ he or she thinks), measures of cognitive
51
Texas Tech University, Sara Dodd, December 2009
complexity are attempting to evaluate the process being used by an individual. As noted by Streufert himself, “Unfortunately, most individuals have never considered the ‘how’ of their own cognitive processes and would, consequently, find it very difficult to answer direct questions about that topic . . . Social desirability, acquiescent response set and other confounds likely distort response to direct assessment” (Streufert & Nogami, 1989, p. 110). Even so, objective pen and paper measures in some situations offer the best solution in terms of gathering information from participants who deal with multiple constraints upon their time and energy. The Driver-Streufert Complexity Index (DSCI) has been described by Driver as measuring a person’s self-concept of his or her decision-making style as well as liking for complexity, where the “self-concept measure predicts actual decisionmaking when a person is apparently consciously concerned with how he is making a decision” (Driver & Rowe, 1979, p. 159). This is an appropriate basis for selecting this instrument to assess cognitive complexity in the Leaderplex model because of the participant group being sampled. As noted by Yasai-Ardekani (1986), cognitively complex individuals “search for more information and spend more time in processing information, such differences being more pronounced under moderate levels of environmental complexity and external demand . . . [and] also pay more attention to complex information and less attention to simple, salient information” (p. 12). YasaiArdekani’s summary offers support for use of an objective measure wherein the 52
Texas Tech University, Sara Dodd, December 2009
participant is consciously considering how they use information in decision-making situations – surely a valid basis for assessing cognitive complexity in Extension professionals whose working environment is saturated with a wide variety of deliberate decision-making situations. The 60-item DSCI has been used extensively in the past 30-40 years, primarily by single research groups in field studies (Driver & Rowe, 1979; Streufert & Nogami, 1989), offering good reliability in test-retest correlations (.6 to .8). Sixty items, however, present another time challenge to the proposed study. Recently, de Janasz and Behson (2007) used a subset of ten items from the DSCI with a reliability estimate of .62 in their study of cognitive capacity as a mediating effect on how individuals process work-family conflict. While not the strongest or most desirable reliability, their study offers support for selecting a subset of items from the DSCI based on specific items that relate to the variable(s) of interest. Yasai-Ardekani synthesized the body of work built around cognitive complexity by noting specifically that individuals marked by this type of complexity “attend to broader ranges of information …better predict others’ strategies … [and] appear to others to have more accurate perceptions and greater tolerances for ambiguity” (1986, p. 12). With these traits as a basis, 20 items were selected from the DSCI for the measurement of cognitive complexity in a pilot study. Responses were scored on a 5point scale where 1 = Not at all characteristic of me and 5 = Extremely characteristic of me. The results from the pilot study determined which items ultimately were included in the final instrument (Appendix B). 53
Texas Tech University, Sara Dodd, December 2009
Range and Differentiation of Emotional Experience Scale (RDEES) Social complexity was measured with the Range and Differentiation of Emotional Experience Scale, or RDEES (Kang & Shaver, 2004). Kang and Shaver developed this instrument to test their hypothesis that “individuals with more complex emotional experience would be more attentive to their feelings, more open to experience, better able to understand others’ feelings, and better adjusted socially” (p. 694). Their 2004 validation study of the scale RDEES included two studies with three samples (n = 1129) in Study 1, and a peer sample in Study 2 (n = 95). A variety of behavioral and cognitive measures were utilized for cross-validation with the original 16-item scale. After factor analysis and further refinement, 14 items (7 items for Range2 and 7 items for Differentiation) ultimately were adopted for the final RDEES, answered on a 5-point scale, anchored by Does not describe me at all at the low end of the scale and Describes me extremely well at the high end of the scale (Appendix C), with an overall alpha coefficient of .85 (p. 696). Behavioral Repertoire Instrument (BR) Behavioral complexity was measured with a subset of a behavioral repertoire (BR) instrument developed and validated by Lawrence, Lenk, and Quinn (2009) and based on the Competing Values Framework (Appendix D). They used a recently modified version of the CVF (Cameron, Quinn, Degraff, & Thakor, 2006) in which the four models or quadrants of the original CVF received new, simplified labels 2
Kang and Shaver define Range as “breadth of emotional experience” (2004, p. 695). Results indicated that Range was indicative of intensity of experienced feelings whereas differentiation was associated with recognition of feelings being experienced.
54
Texas Tech University, Sara Dodd, December 2009
(presumably to make them more meaningful for organizational, non-academic audiences). Rational Goals became COMPETE, Internal Process became CONTROL, Human Relations became COLLABORATE, and Open Systems became CREATE. In addition, Lawrence et al. replaced the two roles in each quadrant (refer again to Figure 2) with three behaviors, in order to maximize behavioral repertoire but also to have enough indicators to identify first-order constructs with a relationship to secondorder constructs. Thus, COLLABORATE now represents the facilitator, mentor, and emphathizer roles. The CREATE quadrant shifts from innovator and broker to innovator, visionary, and motivator. COMPETE becomes producer, competitor, and driver and finally, CONTROL adds regulator to coordinator and monitor (p. 37).
55
Texas Tech University, Sara Dodd, December 2009
(See Figure 3.2 for the ‘reframed’ CVF).
Flexibility
Collaborate
Empathizer (.65)
Create
Motivator (.76)
Mentor (.63) Innovator (.79) Facilitator (.73)
Visionary (.75)
Internal Monitor (.78)
Competitor (.74)
Producer (.60)
Regulator (.85)
Control
External
Driver (.77)
Coordinator (.83)
Compete
Control
Figure 3.2. Competing Values Framework with reliability coefficients. A multidimensional instrument, Lawrence et al.’s BR measure was tested as a second-order model using structural equation modeling (SEM). A Bayesian circumplex model was utilized to test the spatial relationship of the CVF factors. The results of the second-order confirmatory analysis supported the theoretical orthogonal structure of the CVF. Reliability coefficients within each quadrant are above .70 in most cases (see Figure 3.2). In the BR instrument, each quadrant is represented with nine items (three 56
Texas Tech University, Sara Dodd, December 2009
for each role) for a total of 36 items (see Figure 3.3), answered in response to the stem “ I would describe myself as being skilled in the following …” and scored on a 5-point Likert-type scale where 1 = strongly disagree, 2 = disagree, 3 = neither agree nor disagree, 4 = agree, and 5 = strongly agree. Collaborate
Create
1. Encouraging participation 1a. Making it legitimate to contribute opinions. 1b. Employing participative decision making. 1c. Maintaining an open climate for discussion. 2. Developing people 2a. Encouraging career development. 2b. Seeing that everyone has a development plan. 2c. Coaching people on career issues. 3. Acknowledging personal needs. 3a. Being aware of when people are burning out. 3b. Encouraging people to have work/life balance. 3c. Recognizing feelings.
Control
4. Anticipating customer needs. 4a. Meeting with customers to discuss their needs. 4b. Identifying the changing needs of the customer. 4c. Anticipating what the customer will want next. 5. Initiating significant change. 5a. Initiating bold projects. 5b. Starting ambitious programs. 5c. Launching important new efforts. 6. Inspiring people to exceed expectations. 6a. Inspiring direct reports to be creative. 6b. Encouraging direct reports to try new things. 6c. Getting unit members to exceed traditional performance patterns.
Compete
7. Clarifying policies. 7a. Seeing corporate procedures are understood. 7b. Insuring the company policies are known. 7c. Making sure formal guidelines are clear to people. 8. Expecting accurate work. 8a. Emphasizing the need for accuracy in work efforts. 8b. Expecting people to get the details for their work right. 8c. Emphasizing accuracy in work efforts. 9. Controlling projects. 9a. Providing tight project management. 9b. Keeping projects under control. 9c. Closely managing projects.
10. Focusing on competition. 10a. Emphasizing the need to compete. 10b. Developing a competitive focus. 10c. Insisting on beating outside competitors. 11. Showing a hard work ethic. 11a. Showing an appetite for hard work. 11b. Modeling an intense work effort. 11c. Demonstrating full exertion on the job. 12. Emphasizing speed. 12a. Getting work done quicker in the unit. 12b. Producing faster unit outcomes. 12c. Providing fast responses to emerging issues.
Figure 3.3. Behavioral Repertoire Instrument
From these 36 items, a subset was selected for this study based on the applicability of each item to the Extension organizational culture. For example, several of the items in the Compete and Control quadrants were not geared to 57
Texas Tech University, Sara Dodd, December 2009
professionals in a non profit educational setting (e.g. 10c: Insisting on beating outside competitors and 12b: Producing faster unit outcomes) or were redundant (e.g., 8a: Emphasizing the need for accuracy in work efforts and 8c: Developing a competitive focus). In these situations, the most relevant items were selected and where appropriate, slightly modified for the Extension sample. The scale and anchors remained the same (Appendix D). The Behavioral Repertoire instrument also was assessed during the validation process for its ability to predict managerial leader effectiveness with several items designed to measure a supervisor’s overall performance and ability to lead change. The first five items for overall performance were developed and validated by Denison, Hooijberg, and Quinn (1995), with an alpha coefficient of .83. The remaining three items were added by Lawrence et al. to assess a leader’s ability to lead change. They reported .87 for reliability of the first five items, and .76 for the reliability of the final three. These same eight items were used in the study to obtain subordinate-reported measures of leader effectiveness with the Extension sample (Appendix E).
Pilot Study The survey was piloted with a Cooperative Extension district office in the southwestern United States to determine whether the instruments in the survey were understandable by individuals who met sampling criteria (county Extension agents, subject specialists, county and district administrators). The pilot study also was utilized to 58
Texas Tech University, Sara Dodd, December 2009
test the online data collection process; i.e., the ease of navigation through the survey by “real” users. Twenty-three Extension professionals in the district office received the e-mail invitation to participate in the pilot study; 12 completed the survey. While this number precluded using statistical procedures to test the reliability of the survey, respondents in the pilot study provided useful feedback through three open-ended questions at the end of the survey: “(1) How did you find the organization and layout of the survey? For example, was it easy to follow/navigate? (2) What changes would you make, if any, to the survey items and/or questions? (3) Any other comments or suggestions for improvement?” Of these, a few problems with page length and navigation were identified and corrected. Several comments indicated irritation and annoyance with reverse-coded items, particularly among the 20 cognitive complexity items. A few respondents questioned the relevance of the emotion-oriented items of the scale used to measure social complexity. Based on this feedback, the two longest cognitive complexity items were removed, leaving 18 items in that scale with the expectation that through data reduction procedures (factor analysis), some of these items would be eliminated from further analyses. The following brief paragraph was added to the survey introduction to address the concerns about relevance raised by respondents: “Some of the survey questions may seem repetitive or even irrelevant to your personal work experience. Since these items have been taken from established measures, please do your best to answer each one as honestly as possible.” On the same basis (items being taken from established measures), 59
Texas Tech University, Sara Dodd, December 2009
items which were reverse coded in the cognitive complexity and social complexity scales were retained. None of the behavioral complexity items were reverse coded, so these items were kept ‘as is’. It was determined that given the somewhat negative response generated by the cognitive complexity items, those responses should receive careful scrutiny in the preliminary phases of data analysis.
Data Collection Procedures Participants were recruited to the survey through an electronic mail message. The message originated from a senior administrative officer for each participating Extension organization and was delivered using the internal servers of the respective affiliated land grant institutions. The text of the e-mail provided a brief description of the survey and an invitation to participate (Appendix A). The e-mail also advised recipients of their rights as human subjects in an approved research study (that is, their right to confidentiality and to withdraw from the study at any time). Individuals who chose to proceed with participation in the survey were directed to the survey site via a hyperlink embedded in the e-mail. The survey software utilized for the study offers an option where IP addresses of computers used to complete the survey are not tracked or stored, thus the anonymity of participants was protected. The survey itself was administered on a secure Texas Tech University server. Responses were collected during for approximately three weeks during March and April, 2009. Each participant self-reported on the three complexity measures (cognitive, social, and behavioral). Additionally, each individual in a subordinate position 60
Texas Tech University, Sara Dodd, December 2009
completed the BR measure for his or her immediate supervisor, as well as the leader effectiveness tool described above, which was modified slightly to reflect Extension’s public service mission (see Appendix D).
Data Analysis Data collected to test the hypotheses were analyzed with SPSS. Correlation between the various complexity measures (cognitive and social, cognitive and behavioral, social and behavioral), and between the behavioral complexity and leader effectiveness measures were tested using Pearson’s Product Moment Correlation (r) (see Table 3.1). Regression analysis (β) was used to test the respective ability of perceived cognitive complexity and social complexity to predict perceived behavioral complexity (H1, H2, and H3). Likewise, regression also was used to test the predictive power of supervisor behavioral complexity on supervisor leader effectiveness (H4), and to answer a research question about the relationship between perceptions of one’s own behavioral complexity and that of supervisor behavioral complexity. Multivariate analysis of variance (MANOVA) and analysis of variance (ANOVA) procedures were used to compare group differences on the complexity and effectiveness measures by sex, age, academic background, job position and job tenure.
61
Texas Tech University, Sara Dodd, December 2009
CHAPTER IV RESULTS The purpose of this study was to gain empirical knowledge of the theoretical structure of the Leaderplex Model, a model which to the researcher’s knowledge has not been tested prior to this study. By utilizing a sample of highly educated professionals from Cooperative Extension organizations, this study further serves to provide insights into the model’s ability to contextualize the relationship hypothesized about behaviorally complex leaders and effectiveness. The data in this study were obtained through an online survey which used established scales to measure the different types of complexity and leader effectiveness. This chapter defines and describes how data were screened and prepared for analysis, the characteristics of the survey respondents, scale reliabilities, and the results of the tests for hypotheses and research questions.
Preliminary Analyses Data Preparation The sample for this study was drawn from a population of professionals employed by Cooperative Extension Services located in four different regions in the United States. Specifically, responses were obtained from individuals with a minimum of a bachelor’s degree currently working as agents/educators, subject specialists, program directors, and administrators from county, district, regional and state levels of Cooperative Extension organizations in four states (Texas, Ohio, Oregon, and Pennsylvania).
62
Texas Tech University, Sara Dodd, December 2009
Variable Coding Before screening the data for outliers, normality, and the assumptions for multivariate analysis, the values for variables which required post-coding were coded. For age, responses to the question “What year were you born?” were calculated by subtracting the current year (2009) from the year entered and coding this according to the following key: 35 years or younger = 1, 36 to 45 years = 2, 46 to 55 years = 3, and 56 years or older = 4. The state Cooperative Extension system by whom respondents are employed was coded as Texas = 1, Oregon = 2, Ohio = 3, and Pennsylvania = 4. Responses to questions about the academic field for bachelor’s, master’s, and doctoral degrees were coded according to the area of academic discipline. For example, the types of courses required for degrees in agricultural science or other physical sciences are different from those required for social/behavioral science degrees or applied degrees (e.g., education, family and consumer sciences, agricultural communication). Thus, the survey questions regarding academic areas for the three different levels of degrees allowed respondents to enter their own description of the degree which were post coded into two different sets of categories. The first category collapsed degree programs together in order to create cell sizes adequate for analyses of variance. This resulted in four groups, one for degrees in agriculture (non specific), agriculture science (Ag Sci), and physical sciences as Ag/Ag Sci/Phys Sci; a second group for degrees in agriculture education (Ag Ed), agriculture communication (Ag Comm), agriculture economics (Ag Econ), agriculture development (Ag Dev), agribusiness (Ag Bus) and family and consumer sciences education (FCSE) as 63
Texas Tech University, Sara Dodd, December 2009
Education; a third group for degrees in family and consumer sciences and other traditional degrees in human sciences, human ecology, or home economics were grouped as FCS/HE. Finally, degrees in business, liberal arts, fine arts, and social/behavioral sciences were grouped as Other. The second category expanded to yield nine different groups: agriculture (non specific), agricultural economics (Ag Eco), agribusiness (Ag Bus ), and agricultural development (Ag Dev); agricultural and physical sciences (Ag/Phys Sci); agricultural education and agricultural communication; family and consumer sciences/home economics (FCS); family and consumer sciences education or home economics education (FCSE); human sciences/human ecology (degree programs typically associated with colleges bearing these names); all other education degrees; applied, behavioral, and social sciences; and other (business, liberal arts, and fine arts). Tenure variables were created for responses to questions about length of time worked in current position, overall length of employment with Extension, length of relationship with current supervisor, and time spent (if any) working for other organizations in previous jobs. Tenure in current position and tenure with Extension were coded as 0 to 5 years = 1, 6 to 13 years = 2, 14 years or more = 3 (see Berrio, 2003). Tenure with supervisor was coded as 12 months or less = 1, 1 to 4 years = 2, and 5 years or more = 3. Previous work experience with another organization was coded as “no previous work experience” = 0, 1 – 5 years = 1, 6 – 13 years = 2, and 14 years or more = 3. Where respondents indicated that their current position with Extension was not one of the options provided, answers to “other” were coded to assign unique values to department chairs and deans, program coordinators/leaders and assistant or associate 64
Texas Tech University, Sara Dodd, December 2009
department heads, human resource managers, and county extension agents for program areas other than agriculture, family and consumer sciences, and 4-H/Youth. Job positions were collapsed into four groups, county extension agents, program/subject specialists, administration, and other. The administration job position category included county directors and district administrators, regional program directors, program leaders, department heads, and assistant, associate, and executive directors. Other represented all other jobs which did not fit into one of the above categories; for example, staff professionals such as human resource managers. Finally, the survey asked respondents to indicate how many supervisors and/or subordinates they had in their current position with Extension. Utilizing histogram charts generated by SPSS, these variables were post coded into different categories. For supervisors, three categories emerged: no supervisors, one supervisor, two or more supervisors. For subordinates, five categories with sizable frequencies in each appeared: zero subordinates, one subordinate, two subordinates, three to five subordinates, and six or more subordinates. Data Screening Missing Data Before conducting factor analysis to confirm the structure of the construct variables in the model, the data were screened for missing values. In accordance with IRB protocols for completely voluntary participation, respondents were able to skip any question or item they chose not to answer. Responses thus were screened for patterns of missing data that would impact the usefulness of each individual’s set of responses. If 65
Texas Tech University, Sara Dodd, December 2009
response sets from any of the scales for the key variables of interest (self-reported cognitive complexity, social complexity, and behavioral complexity) were missing more than a few items, the responses of those individuals were removed from the dataset. For example, if a respondent completed only half of the items in any one scale, this would mean that at least one or more dimensions in the construct could be under- or overrepresented in the scale score. In those situations, these responses were completely deleted from the dataset. From the original 321 responses, 294 usable responses were retained for further analysis. Data Reduction The pilot study feedback about the presence of multiple reverse coded items in both the cognitive and social complexity measures made it possible to assess the degree of attention or care respondents brought to answering multiple items. This was important not only because of the time and cognition required to answer 53 reflective items about the construct variables (21 for behavioral complexity, 18 for cognitive complexity, and 14 for social complexity), but also because responses to the pilot study indicated a level of frustration and impatience with the length of some items as well as the presence of reverse coded items. Since the primary purpose of the study was to “test” the structure of the Leaderplex model, it was important to carefully assess the responses to key variables in the model. Responses to the items used to measure the constructs of cognitive complexity (CC), social complexity (SC), and behavioral complexity (BC) were subjected to factor analysis to determine whether the items loaded on dimensions consistent with previous 66
Texas Tech University, Sara Dodd, December 2009
reliability/validation studies. If the items in each respective category loaded on the appropriate factors, and their reliability was confirmed through Cronbach’s alpha analyses, then it was assumed that the participants in this study read and responded to the items with levels of attention and comprehension consistent with individuals in previous studies. This would further identify the response set most suitable for further analyses. The cognitive complexity items present a challenge in terms of relating dimensionality to the sub-constructs of complexity – differentiation and integration. The measure of cognitive complexity utilized in this study was developed many years ago and has been altered comparatively little in the intervening years to reflect the growing attention being paid to the discrete dimensions of differentiation and integration. In comparison to the items used to measure social complexity and behavioral complexity, the cognitive complexity items are themselves rather complex, requiring the participant to read the stem statement carefully and take a few moments to clarify its meaning in order to provide a thoughtful response. Because the original instrument contains 60 items, it was important to choose items which offered the best face validity for the purpose of this study – assessing individual differences in the ability to cognitively differentiate as well as integrate. After the pilot study, the 18 items which were subsequently chosen for the survey required careful screening and analysis to determine which items offered the best representation of the differentiation and integration dimensions of cognitive complexity. The initial factor analysis used to test the dimensionality of the items chosen to measure cognitive complexity in this study seemed to demonstrate the participants’ confusion and uncertainty with assessing cognitive complexity. Using principal 67
Texas Tech University, Sara Dodd, December 2009
component analysis with a Varimax (orthogonal) rotation, six factors emerged initially. Two of the cognitive complexity items were duplicates; after these were eliminated, the second factor analysis yielded five factors with multiple atypical cross loadings. The fact that two factors representing the two dimensions of complexity did not emerge is perhaps because study participants, like the respondents in the pilot study, became impatient with the number, length, and wording of the CC items and as a result, moved as quickly as possible through this portion of the survey. Thus, it was important to screen the data further in order to identify participants who exhibited a lack of care in their survey responses. Upon the recommendation of a statistical consultant, J. B. Wilcox (personal communication, June 16, 2009), a procedure to identify “careless” respondents was performed. The procedure is based on the assumption that people who contradict themselves in their responses – that is, they agree with two contradictory statements before reverse coding – are exemplars of careless respondents and thus, their answers on all the scales may be suspect. The procedure includes first creating a variable by calculating within-person variance of the CC responses before the reversed items are recoded, then creating a second variable by computing the within-person variance of the reversed items after recoding. The unreversed answers should have greater variance than those that have been reversed. A third variable (CARE) is created as a ratio of the “after” variable divided by the “before” variable, where a result greater than one (1.0) likely indicates carelessness. Where CARE equals 1.0 (that is, equal to the midpoint), this may indicate somewhat sloppy or lazy responses, but not necessarily a lack of care or concern, 68
Texas Tech University, Sara Dodd, December 2009
and thus responses from those participants may be retained along with those where CARE is less than 1.0. The results of the CARE procedure with the original dataset (N=294, CARE ≤ 1.0) identified 87 “careless” respondents, leaving 207 in the sample. These 207 response sets were retained in a new dataset, labeled CAREFUL. The remaining 16 CC items then were subjected to a second factor analysis. The first extraction (principal component analysis with a Varimax (orthogonal) rotation) yielded five factors which explained 57.1% of the variance. Five items which did not load on the first two factors were deleted and the subsequent third extraction (also using principal component analysis with Varimax rotation) yielded a 2-factor structure which explained 43.19% of the variance, with all 11 items accounting for 100% of the common variance. Factor loadings from the rotated solution can be found in Table 4.1. Table 4.1 Factor Loadings for Cognitive Complexity (N = 196) Factor Loadings Integration
Differentiation
Integration Considering all aspects in decision making Seeking out problems which require many points of view Using contradictory information to generate more perspective Functioning with lack of clarity when solving problems Decision-making in ambiguous situations Seeking out diversity in making and reconsidering judgments
.693 .651 .703 .664 .611 .524
Differentiation Using multiple categories to form impressions of others Considering similarity/dissimilarity in forming acquaintances Ability to understand motives and ideas of others Attitudes toward dealing with differ rent kinds of people Using multiple criteria to select acquaintances
69
.469 .653 .434 .693 .783
Texas Tech University, Sara Dodd, December 2009
Factor 1 included six items which measured the individual’s perception of their ability to seek out and utilize information in situations which may be characterized as complex, ambiguous, or confusing. Labeling this factor “Integration” is consistent with the characterization of cognitively complex individuals as being more sophisticated information processors (Day & Lance, 2004; McGill, Johnson & Bantel, 1994). Factor 2 included five items which appear to measure an individual’s perception of the extent to which he/she identifies and applies different, potentially conflicting, information (particularly with regard to making judgments about other people). Labeling this factor “Differentiation” is, again, consistent with conceptualizations of differentiation offered in the cognitive complexity literature (Streufert & Swezey, 1986). The scores for these 11 items were retained in the CAREFUL dataset for further model testing and descriptive statistics. Factor analysis was also conducted to confirm that the Extension sample used in this study responded to the social complexity and behavioral complexity scales in ways consistent with the extensive validation studies of both instruments (Kalliath, Bluedorn, & Gillespie, 1999; Kang & Shaver, 2004; Lawrence, Lenk, & Quinn, 2009; Vilkinas & Cartan, 2006). The dimensionality of both scales was confirmed: For behavioral complexity, a four-factor structure emerged explaining 57.14% of the total variance. For social complexity, a two-factor structure emerged explaining 55.73% of the total variance.
70
Texas Tech University, Sara Dodd, December 2009
Reliabilities To provide further confirmation of the variables to include in further analysis, responses to all of the model constructs were subjected to reliability testing (Cronbach’s alpha). The results of this analysis are shown in Table 4.2. Table 4.2 Scale Reliabilities and Means Factor
Number of items
Mean
Alpha
11 14 21 20 8
3.63 3.68 4.03 3.77 3.80
.76 .89 .92 .96 .95
Cognitive Complexity Social Complexity Behavioral Complexity Supervisor Behavioral Complexity Leader Effectiveness Outliers and Normality
Finally, the responses to the construct variables were screened for outliers and normality using techniques available through the SPSS software package used for the analysis in this study. Analysis of the distribution of responses to the dependent variable measures identified three moderate outliers; these responses were examined and deemed to be not random and thus were retained for further analyses.
Description of the Sample After all screening and data reduction, the final sample size for further analyses was N=207. Females comprised 65.7% of the sample while 32.9% were male. Age ranged from 24 to 66, with a mean age of 47.2 years and almost 60% of the sample aged 71
Texas Tech University, Sara Dodd, December 2009
46 years and older. Of the four state Extension organizations included in the study, Extension professionals in Texas constituted 44% of respondents; Ohio and Pennsylvania each represented approximately 20% of the sample while Oregon was 13.5%. Reflecting the strong expectation for graduate degree achievement among Extension professionals, only 30 respondents (14.5%) indicated that a bachelor’s degree was their highest college degree attained while 119 (57.5%) had earned a master’s degree, and 48 (23.2%) a doctoral degree. In terms of academic discipline area, nearly 30% of bachelor’s degrees were earned in the fields of general agriculture, agriculture sciences, and the physical sciences. Degrees in agriculture education (Ag Ed), family and consumer sciences education (FCSE), and other education areas comprised approximately 20% of bachelor’s degrees while degrees in FCS and traditional FCS disciplines (such as Nutrition, Clothing and Textiles, Family Studies, and so on) comprised a further 13.5% of bachelor’s degrees. As Extension professionals in this sample progressed through their graduate studies, more master’s degrees were awarded in education programs (approximately 25%) than in general agriculture/agriculture and physical sciences (approximately 23%) or pure FCS programs (nearly 10%). At the doctoral level, 21 of 48 doctoral degrees were earned in the agriculture and physical sciences while 15 were earned in education-related fields (including Ag Ed and FCSE). All other degrees were earned in business administration, social/behavioral sciences, or the humanities/liberal arts. Participants also were asked to indicate the position they currently hold with their respective Extension organization. Forty-eight percent of the sample indicated that they 72
Texas Tech University, Sara Dodd, December 2009
were county extension agents or educators; of these, approximately 16% described their county position as agriculture-related, almost 20% were family and consumer science agents, and just over 12% described their position as 4-H/Youth. Almost 30% of respondents identified themselves as program or subject specialists, with the majority of these (35 of 61) working in this position at the state level. Almost 18% reported working in a position of formal leadership, 29 as county directors or district administrators, eight as program leaders, department heads, regional program directors, or associate/ assistant directors. No respondent identified himself or herself as an executive director, but there was one respondent who selected “other” to describe their Extension position as well as three missing responses. In terms of job tenure with Extension, fifty-three respondents indicated they had been with Extension five years or less (25.6%). Almost 23% reported six to 10 years of service with Extension, while approximately 24% had worked for Extension 11 to 20 years. The largest tenure group (27.5%) also had the longest tenure with Extension, 21 years or more. In addition, survey participants were asked about their Extension status relative to the number of individuals to whom they directly reported (supervisors) and subordinates (number of individuals whose work they directly supervised). Four respondents reported having no supervisor(s), which may or may not account for the four missing/other responses to the survey question about job position. Almost 40% of the sample indicated that they had only one individual to whom they reported, while the majority (57%) reported have two or more supervisors. With regard to the length of the 73
Texas Tech University, Sara Dodd, December 2009
supervisor/subordinate relationship, just over a quarter of the sample (26.1%) indicated that they had been with their supervisor 12 months or less. Approximately 30% had been reporting to their supervisor five years or more, while nearly half of the respondents (44.4%) had been with their supervisor one to four years. In terms of subordinates, 38 (18.4%) of respondents indicated that they had no one directly reporting to them. Almost 40% reported having one to two subordinates while 18.4% identified themselves as having three to five individuals whose work they supervised. Approximately 30% reported directing the work of six or more subordinates. Finally, the survey asked respondents whether they had work experience outside of Extension. Approximately 27% reported no work experience prior to joining Extension. Seventy-five respondents (36%) indicated one to five years tenure in their job prior to Extension, and 17.4% identified themselves as having six to 13 years previous work experience. Lastly, almost one-fifth of respondents (19.3%) had 14 years or more working for other organizations before joining Extension. Tables 4.3 and 4.4 list the socio-demographic and work-related characteristics of the sample.
74
Texas Tech University, Sara Dodd, December 2009
Table 4.3. Sociodemographic characteristics of the sample (N = 207) Trait
Frequency
Percent
68 136 3
32.9 65.7 1.4
41 40 66 53 7
19.8 19.3 31.9 25.6 3.4
30 119 48 10
15.2 60.4 23.2 4.8
61 41 28 46 31
29.5 19.8 13.5 22.2 15.0
Master’s Ag/Ag Sci/Phy Sci Educ (Ag, FCS, other) FCS/HE Other Missing
47 52 20 41 47
22.7 25.1 9.7 19.8 22.7
Doctoral Ag/Ag Sci/Phy Sci Educ (Ag, FCS, other) FCS/HE Other Missing
21 15 2 10 159
10.1 7.2 1.0 4.8 76.8
Gender Male Female Missing Age 35 years or younger 36 – 45 years 46 – 55 years 56 years or older Missing Education Highest level attained Bachelor’s only Master’s Doctoral (PhD or EdD) Missing Academic area – Category I Bachelor’s Ag/Ag Sci/Phy Sci Educ (Ag, FCS, other) FCS/HE Other Missing
75
Texas Tech University, Sara Dodd, December 2009
Table 4.3. Continued Sociodemographic characteristics of the sample (N = 207) Trait
Frequency
Percent
Academic area – Category II Bachelor’s Ag Sci/Phy Sci Ag Eco/Ag Bus/Ag Dev/Ag non spec Ag Ed/Ag Comm FCS/HE FCSE/HE Ed Human Sci/Human Ecol Education (all other) Applied/Behav/Soc Sci Other (Bus, Lib/Fine Arts) Missing
58 20 7 26 21 4 16 20 19 16
28.0 9.7 3.4 12.6 10.1 1.9 7.7 9.7 9.2 7.7
Master’s Ag Sci/Phy Sci Ag Eco/Ag Bus/Ag Dev/Ag non spec Ag Ed/Ag Comm FCS/HE FCSE/HE Ed Human Sci/Human Ecol Education (all other) Applied/Behav/Soc Sci Other (Bus, Lib/Fine Arts) Missing
42 14 10 18 7 2 35 22 10 47
20.3 6.8 4.8 8.7 3.4 1.0 16.9 10.6 4.8 22.7
Doctoral Ag Sci/Phy Sci Ag Eco/Ag Bus/Ag Dev/Ag non spec Ag Ed/Ag Comm FCS/HE Education (all other) Applied/Behav/Soc Sci Missing
20 4 4 2 11 7 159
9.7 1.9 1.9 1.0 5.3 3.4 76.8
76
Texas Tech University, Sara Dodd, December 2009
Table 4.4 Work-related characteristics of the sample (N = 207) Trait
Frequency
Percent
State Cooperative Extension Affiliation Texas Oregon Ohio Pennsylvania Missing
91 28 43 42 3
Current position with Extension County Extension Agent Agriculture Family and Consumer Sciences 4-H/Youth Other
44.0 13.5 20.8 20.3 1.4
34 39 25 1
16.4 18.8 12.1 0.5
Program/subject Specialist County District Urban State
9 15 2 35
4.3 7.2 1.0 16.9
County Director
27
13.0
District Administrator
2
1.0
Regional Program Director
2
1.0
Program Leader/Dept Administrator
3
1.4
Research or Program Assistant
5
2.4
Associate or Assistant Director
3
1.4
Other
1
0.5
Missing
3
1.4
77
Texas Tech University, Sara Dodd, December 2009
Table 4.4. Continued Work-related characteristics of the sample (N = 207) Trait
Frequency
Percent
Tenure with Extension 0 – 5 years 6 – 13 years 14+ years
58 62 87
28.0 30.0 42.0
Tenure in current position 0 – 5 years 6 – 13 years 14+ years
101 59 47
48.8 28.5 22.7
Tenure with Extension supervisor 12 months or less 1 – 4 years 5 years or more
54 92 61
26.1 44.4 29.5
Previous work experience No work experience prior to Extension 1 – 5 years 6 – 13 years 14+ years
56 75 36 40
27.1 36.2 17.4 19.3
Number of supervisors No supervisors One supervisor 2 or more supervisors Missing
4 78 118 7
1.9 37.7 57.0 3.4
Number of subordinates No subordinates One subordinate Two subordinates 3 – 5 subordinates 6 or more subordinates Missing
38 41 39 38 47 4
18.4 19.8 18.8 18.4 22.7 1.9
78
Texas Tech University, Sara Dodd, December 2009
Hypotheses Testing Correlation and regression analyses were used to test the structure of the Leaderplex model as well as relationships with independent variables. Correlation analysis was utilized to test the hypothesized positive relationship between the different types of complexity; specifically, that higher scores in cognitive complexity would be positively correlated with higher scores in social complexity; that higher scores in both cognitive and social complexity would be correlated with higher scores in behavioral complexity. The relationship between scores for supervisor behavioral complexity and supervisor leader effectiveness also was examined with the expectation that the relationship would be positive. Scores for the construct variables (the complexity variables and the leader effectiveness variable) were computed as grand means using mean scores from the respective dimensions in each construct. For example, mean scores were computed for the differentiation and integration dimensions in cognitive complexity (CC-D, CC-I) and for the range and differentiation dimensions in social complexity (SC-R, SC-D). The grand mean was then computed for the mean of the two dimensions in each complexity scale (CC, SC). For behavioral complexity (BC), means were computed for the four underlying dimensions of the Competing Values Framework (Collaborate, Create, Control, and Compete), and the grand mean was the mean of these four factors. For leader effectiveness (LE), the mean for the leader’s overall performance subscale and the mean for the leader’s ability to lead change subscale were averaged to obtain the grand mean for this variable. Scoring methods are illustrated in Table 4.5; the methods used for 79
Texas Tech University, Sara Dodd, December 2009
scoring the behavioral complexity and leader effectiveness measures are included and are discussed in greater detail in the next section. Table 4.5. Scoring Methods for Construct Variables Scale/Subscale Cognitive Complexity Differentiation Integration Grand Mean Social Complexity Differentiation Integration (Range)
Abbrev.
Procedure (all scores are within-person)
CC-D
Mean score on five CC items (identified as differentiation by factor analysis). Mean score on six CC items (identified as differentiation by factor analysis).
CC-I CC
Average of CC-D and CC-I
SC-D
Mean score on SC items 2, 4, 6, 8, 10, 12, 14
SC-R
Mean score on SC items 1, 3, 5, 7, 9, 11, 13
Grand Mean
SC
Behavioral Complexity (Self & Supervisor)
BC & Sup BC
Repertoire Collaborate (COL)
Average of SC-D and SC-R
Mean score on BC items 1-6
Create (CRE)
Mean score on BC items 7-12
Control (CON)
Mean score on BC items 13-17
Compete (COM)
Mean score on BC items 18-21
Grand Mean Differentiation
BR
Average of COL, CRE, CON, COM
BD
Variance between COL, CRE, CON, and COM Grand mean (BR) x Variance (BD)
Interaction Term Leader Effectiveness Overall Performance
Mean score on LE items 1-5
Ability to Lead Change Grand Mean
Mean score on LE items 6-8 LE
Average of Performance and Change scores 80
Texas Tech University, Sara Dodd, December 2009
Correlation Analysis Correlation analysis was conducted to examine the relationship between the key construct variables and also between those variables and selected independent variables. Pearson correlation coefficients were computed. The correlation matrix for the model components is provided in Table 4.6. Table 4.6 Construct variables correlation matrix CC gm CC grand mean SC grand mean
–
SC gm
BC gm
Supervisor BC gm
LE gm
.317**
.354**
.069
-.029
.254**
.054
.003
.301**
.187**
–
.866**
–
BC grand mean
–
Super. BC grand mean LE grand mean
–
Note: * p < .05. ** p < .01. Correlation analysis revealed significant positive relationships between cognitive complexity and social complexity (r = .32, p < .01), cognitive complexity and behavioral complexity (r = .35, p < .01), and social complexity and behavioral complexity (r = .25, p < .01). These findings offer support for the first and second hypotheses. Positive relationships also were revealed between behavioral complexity (reported on self) and supervisor behavioral complexity and supervisor leader effectiveness (r = .30, p < .01 and r = .19, p < .01, respectively).
81
Texas Tech University, Sara Dodd, December 2009
Regression Analyses Correlation analyses offered support for the hypotheses in this study, but the structure of the Leaderplex model also can be examined through regression analyses. For example, regression techniques make it possible to test whether perceptions of supervisor or managerial behavioral complexity have a predictive relationship to perceptions of overall effectiveness as a leader. This is a critical component of the Leaderplex model, for if behavioral complexity is not found to contribute to leader effectiveness in any significant way, then it becomes less meaningful to consider the antecedents of behavioral complexity. However, if behavioral complexity is a predictor of a leader’s effectiveness, then a further exploration of its source(s) is warranted. Because this study appears to be the first known empirical test of the complete Leaderplex model, there is no clear-cut precedent for examining the model’s structure (see Day & Lance, 2004). Thus, it is important to separate the components of the model into two parts to facilitate clear conceptualization and appropriate analysis. The front part of the model is comprised of the hypothesized antecedents of behavioral complexity, cognitive and social complexity (see Figure 4.1).
82
Texas Tech University, Sara Dodd, December 2009
Cognitive Complexity [Cognitive differentiation and cognitive integration]
Behavioral Complexity [behavioral repertoire and behavioral differentiation]
Social Complexity [social differentiation and social integration]
Figure 4.1 Front part of the Leaderplex Model
The ‘back’ part of the model (see Figure 4.2) includes the assessment of the supervisor’s behavioral complexity and its theorized relationship to that supervisor’s effectiveness as a leader. The regression analysis of this part of the model will be reported first.
Behavioral Complexity
Leader Effectiveness
Repertoire & Differentiation
Figure 4.2 Back part of Leaderplex Model
83
Texas Tech University, Sara Dodd, December 2009
Regression of Supervisor Behavioral Complexity into Leader Effectiveness By utilizing a behavioral complexity measure based on the four-factor structure of the Competing Values Framework (CVF), structural equation modeling (SEM) is not a suitable statistical tool because the assumption of linearity cannot be met (that is, there cannot be a single path between behavioral complexity as operationalized in this study (with multiple dimensions) and leader effectiveness. There is precedent, however, for utilizing a combination of scores (means, coefficients, and interaction terms) to determine which variables in the model have sufficient ability to predict the level of complexity and effectiveness of a leader’s behavior. Belasen and Frank (2008) recently conducted a study of the Competing Values Framework (CVF) in which their primary purpose was to validate the framework’s four quadrant/eight role structure (both the number and order of the roles) and also to “identify the personality traits which trigger the choice of leadership roles” (p. 127). Specifically, Belasen and Frank sought to determine whether personality traits fit the four dimensions of the CVF and whether personality traits could predict those dimensions (or roles). In order to assess whether levels of a multidimensional measure of behavioral complexity can predict leader effectiveness, the multi-step procedure they used provides an appropriate foundation and guidance in answering these questions (J.B. Wilcox, personal communication, May 25, 2009). Behavioral complexity in the Leaderplex model has been operationally defined for this study as both a range and a repertoire of behaviors, thus it is important for the data in the response set to be structured correspondingly for purposes of analysis. Thus, adapting procedures used by Hooijberg (1996) and Belasen and Frank (2008), range 84
Texas Tech University, Sara Dodd, December 2009
scores (within-person means) were calculated for each of the CVF dimensions (labeled collaborate, create, control, and compete) represented in the measures both for selfreported behavioral complexity (BC) and the assessment of supervisor behavioral complexity (SupBC). These mean scores capture the amount of the behavior reported in each quadrant or leader role (with higher scores representing “more” complexity, or repertoire). Next, again similar to Belasen and Frank’s procedure (and comparable to Hooijberg’s), within-person variance was calculated for these four means – thus capturing the degree to which the performance within these roles is perceived as being varied. That is, lower scores in this variable would suggest greater equivalence or balance between role behaviors or, as Hooijberg described it (1996, p. 928), a reflection of behavioral differentiation (BD). Thirdly, a grand mean score was computed from the four quadrant means to represent the overall level of behavioral complexity, or behavioral repertoire (BR). Finally, a term representing the interaction between the grand mean (BR) and the variance of the quadrants (BD) is calculated as the product of those two values. These three terms (grand mean, variance, and interaction) representing supervisor behavioral complexity (SupBC) were then used as independent variables in the multiple regression procedures described below. Because the current study was exploratory in nature (testing the Leaderplex model), there were minimal precedents for analyzing predictive relationships within the model. The Competing Values Framework measures which were utilized to measure 85
Texas Tech University, Sara Dodd, December 2009
behavioral complexity (behavioral repertoire and differentiation) have been studied at some length (see chapters II and III). However, there has been less attention given to discovering the most effective way to analyze the intricate relationship between an individual’s repertoire of leader behaviors and how those behaviors are varied in their application. Thus, different types of regression analysis were employed. The first regression analysis was conducted to consider the influence of both theorized dimensions of behavioral complexity (with the grand mean of Supervisor BC representing repertoire, and the variance term representing differentiation) as well as the interaction term (introduced into this analysis based on Belasen and Frank’s procedure). All three terms were entered into a multiple regression on Supervisor Leader Effectiveness (LE). The results of the regression are presented in Table 4.7. Table 4.7 Summary for multiple regression analysis for predicting leader effectiveness (N = 197) Variable Supervisor BC grand mean Supervisor BC variance
B .88
SE B .05
Beta .80**
-1.37
.52
-.48**
.38
.16
.43*
Supervisor BC interaction R²
.76**
F
202.9**
Note: ** p < .01, * p < .05 Collinearity diagnostics on this regression indicated the possible presence of multicollinearity between the variance and interaction terms, a not unexpected result given the close conceptual and mathematical relationships in the behavioral complexity construct. While there is little agreement on what the “cut off” statistics should be for 86
Texas Tech University, Sara Dodd, December 2009
tolerance and the variance inflation factor (VIF) (Lomax, 2007; Smith & Albaum, 2005), the strong correlation (r = .97, p < .01) in combination with other collinearity statistics (Tolerance = .04; VIF = 25.54) suggests caution and the need for further investigation. To further explore the structure of the relationship between behavioral repertoire and differentiation, a second regression procedure was conducted. This analysis was conducted as a hierarchical regression in three steps to determine how well each step, or model, predicted leader effectiveness (the criterion variable) over and above the other steps. The results of the regression are presented in Table 4.8. Table 4.8 Summary for hierarchical regression analysis for predicting leader effectiveness (N = 197) Step 1
R² .750
Adjusted R² . 749
R² change .750
2
.752
. 749
.002
3
.759
. 756
.007
df1 1
df2 195
Significance F change .00**
1.62
1
194
.204
5.84
1
193
.017*
F change 584.69
Note: ** p < .01, * p < .05 1. Predictor: grand mean of supervisor behavioral complexity 3. Predictor: grand mean of supervisor behavioral complexity, variance of supervisor behavioral complexity, and the interaction between the grand mean and variance of supervisor behavioral complexity The first step evaluated the predictive ability of the perceived overall amount of supervisor behavioral complexity (the grand mean of the four CVF-based scales). This measure accounted for a significant proportion of leadership effectiveness, R² = .75, adjusted R² = .75, F(1,195) = 584.69, p < .01. The second step of the regression added the variance (degree to which the supervisor behaviors are balanced or equivalent) to the 87
Texas Tech University, Sara Dodd, December 2009
overall mean score of supervisor behavioral complexity. The change between this step and the first was not significant. The third step of the regression added the interaction between the mean and variances scores. This step accounted for a slightly larger proportion of leader effectiveness, R² = .76, F(1,193) = 5.84, p < .05. The three predictor variables accounted for 76% of the variance in the dependent variable. The coefficient matrix was further examined to assess the contribution of the individual predictors (see Table 4.9). The results indicated that the grand mean and variance of supervisor behavioral complexity scores in addition to the interaction between the two variables have the ability to predict leader effectiveness. Table 4.9 Coefficients for predictors of leader effectiveness (N = 197) Step 1
Predictor Variables Grand Mean of Supervisor BC
B .96
SE B .04
Beta .87
p .00**
2
Grand Mean of Supervisor BC Variance of Supervisor BC
.94 -1.37
.04 .11
.85 -.05
.00** .20
3
Grand Mean of Supervisor BC Variance of Supervisor BC Interaction
.88 -1.37 .38
.05 .52 .16
.80 -.48 .43
.00** .009** .017*
Note: ** p < .01, * p < .05 As with the simple multiple regression, potential problems with multicollinearity emerged in the hierarchical regression between the variance and interaction terms. Again, this is not unexpected, given the difficulty not only in discriminating between how many roles a leader may perform and how differently they perform them across multiple situations, but also in obtaining distinct measures of those differences.
88
Texas Tech University, Sara Dodd, December 2009
Regression of Cognitive and Social Complexity onto Behavioral Complexity The front part of the model was the subject of two separate regressions. In the first regression, the grand means of cognitive complexity (CC) and social complexity (SC) were entered together in a stepwise multiple regression with self behavioral complexity (BC) as the dependent variable. This resulted in two models (presented in Table 4.10). The first model accounted for a modest proportion of BC, R² = .12, adjusted R² = .11, F(1,205) = 27.01, p < .01. The grand means for cognitive complexity and social complexity both were identified as contributing predictors. Table 4.10 Summary for multiple regression analysis for predicting behavioral complexity (N = 207) using grand means of cognitive and social complexity Step 1
R² .12
Adjusted R² .11
R² change .12
F change 27.01
df1 1
df2 205
2
.13
.125
.02
4.10
1
204
Significance F change .00** .044*
Note: ** p < .01, * p < .05. 1. Predictor: grand mean cognitive complexity (CC) 2. Predictors: grand mean CC, grand mean social complexity (SC) The coefficient matrix was further examined to assess the contribution of the individual predictors (see Table 4.11). The results indicated that levels of self-reported cognitive complexity and social complexity have an impact on self-reported behavioral complexity.
89
Texas Tech University, Sara Dodd, December 2009
Table 4.11 Coefficients for predictors of behavioral complexity (N = 207) Step 1
Predictor Variables Grand Mean of CC
B .35
SE B .07
Beta .34
p .00**
2
Grand Mean of CC
.31
.07
.30
.00**
Grand Mean of SC
.11
.06
.14
.04*
Note: ** p < .01, * p < .05 In order to more fully understand the influence of cognitive and social complexity, the second regression employed the means for the integration and differentiation dimensions from CC and SC. The four dimensions were entered as discrete independent variables on the same criterion variable, self behavioral complexity, in addition to the grand means for CC and SC. Specifically, variables for the means of cognitive integration (CC-I), cognitive differentiation (CC-D), social differentiation (SCD), social integration (SC-R, referred to as range by Kang and Shaver, 2004), and the grand means for both were entered stepwise into a multiple regression. The purpose was to determine whether the extracted dimensions would have contributions that could be discriminated. The results of the second regression analysis are presented in Table 4.12. Two models resulted. The first model accounted for a modest proportion of behavioral complexity, R² = .13, adjusted R² = .12, F(1,204) = 29.63, p < .01, while the second accounted for a somewhat larger proportion, R² = .17, adjusted R² = .16, F(1,203) = 9.93, p < .01. Two predictor variables could be distinguished, cognitive integration (CC-I) and social differentiation (SC-D).
90
Texas Tech University, Sara Dodd, December 2009
Table 4.12 Summary for multiple regression analysis for predicting behavioral complexity (N = 207) using all dimensions of cognitive and social complexity R² .13
Adjusted R² .12
R² change .13
F change 29.63
df1 1
df2 204
2
.17
.16
.04
9.93
1
203
Significance F change .00**
Step 1
.00**
Note: ** p < .01. 1. Predictor: mean of cognitive integration 2. Predictor: mean of cognitive integration, mean social differentiation The coefficient matrix was further examined to assess the contribution of the individual predictors (see Table 4.13). The results indicated that cognitive integration and social differentiation make significant contributions to this relationship, whereas cognitive differentiation and social integration (range) do not. Table 4.13 Coefficients for predictors of behavioral complexity in expanded regression (N = 207) Step 1
Predictor Variables Mean of cognitive integration
B .30
SE B .06
Beta .36
p .00**
2
Mean of cognitive integration
.25
.06
.30
.00**
Mean of social differentiation
.16
.05
.21
.00**
Note: ** p < .01
91
Texas Tech University, Sara Dodd, December 2009
Research Questions Correlation and Regression Analyses Correlation and regression analyses also were employed to explore the first research question, the relationship between self-reported behavioral complexity (BC) and supervisor behavioral complexity (SupBC). Previously reported in Table 4.6, scores on BC and SupBC were positively correlated (r = .30, p < .01). Regression analysis was conducted to determine whether BC predicted SupBC (the criterion variable). The first step evaluated the ability of the overall amount of BC (grand mean) to predict the perceived amount of the supervisor’s behavioral complexity. This measure accounted for a small proportion of scores for SupBC, R² = .09, adjusted R² = .09, F(1,195) = 19.39, p < .01. The second step of the regression added the variance (degree to which the behaviors are balanced or equivalent) to the overall grand mean of BC. The change between this step and the first was not significant. The third step of the regression added the interaction between the mean and variances scores. This step also was not significant. The grand mean of BC accounted for 9% of the variance in the dependent variable. The results of the regression are shown in Tables 4.13 and 4.14. Table 4.14 Summary for multiple regression analysis for predicting supervisor behavioral complexity (N = 197) using the grand mean of behavioral complexity Step 1
R² .09
Adjusted R² .09
R² change .09
F change 29.39
df1 1
Note: ** p < .01. 1. Predictor: grand mean behavioral complexity (CC) 92
df2 195
Significance F change .00**
Texas Tech University, Sara Dodd, December 2009
Table 4.15 Coefficients for predictor of supervisor behavioral complexity (N = 197) Step 1
Predictor Variables Grand Mean of BC
B .50
SE B .11
Beta .30
p .00**
Note: ** p < .01 Multivariate Analyses of Variance Multivariate analyses of variance (MANOVA) was performed to answer the second research question. The four categorical variables to be examined were gender, age, job position, and tenure with Extension (Barrio, 2003; Parker, 2004). The first MANOVA procedure examined the effects of these variables on behavioral complexity, supervisor behavioral complexity, and leader effectiveness. No significant differences were found. In the next MANOVA, however, the variables were assessed for their effects on cognitive complexity; specifically, the means for cognitive integration, cognitive differentiation, and the grand mean of the two factors. The results showed that there were significant differences due to gender (Wilks’ Lambda = .880, F = (2,136) = 9.267, p = < .01). No significant interactions between gender and the other categorical variables were found. Table 4.16 shows the results of MANOVA.
93
Texas Tech University, Sara Dodd, December 2009
Table 4.16 Multivariate analysis of variance of cognitive complexity for gender, age, job position, and Extension tenure Source Gender Age Job Extension tenure Gender*Age Gender*Extension tenure Gender*Job Age*Extension tenure Age*Job Extension tenure*Job Gender*Age*Extension tenure Gender*Age*Job Gender*Extension tenure*Job Age*Extension tenure*Job
Wilks’ λ .880 .954 .549 .985 .930 .969 .972 .971 .921 .976 .938 .903 .916 .914
F 9.267 1.072 .828 .503 1.670 1.086 .978 .409 .713 .282 .878 1.430 1.533 .622
df1 2 6 6 4 6 4 4 10 16 12 10 10 8 20
df2 136 272 272 272 272 272 272 272 272 272 272 272 272 272
p .000** .380 .549 .733 .128 .364 .420 .942 .780 .992 .554 .167 .146 .895
Note: ** p < .01 The third MANOVA procedure examined the effects of these variables on social complexity; specifically, the means for social integration (operationally defined as range by Kang and Shaver, 2004), social differentiation, and the grand mean of the two factors. The results showed that there were significant differences due to gender (Wilks’ Lambda = .809, F = (2,136) = 16.214, p = < .01). No significant interactions between gender and the other categorical variables were found. Table 4.17 shows the results of MANOVA.
94
Texas Tech University, Sara Dodd, December 2009
Table 4.17 Multivariate analysis of variance of social complexity for gender, age, job position, and Extension tenure Source Gender Age Job Extension tenure Gender*Age Gender*Extension tenure Gender*Job Age*Extension tenure Age*Job Extension tenure*Job Gender*Age*Extension tenure Gender*Age*Job Gender*Extension tenure*Job Age*Extension tenure*Job
Wilks’ λ .809 .966 .976 .976 .970 .980 .984 .907 .870 .915 .945 .960 .964 .896
F 16.214 .801 .563 .825 .712 .688 .539 1.367 1.239 1.038 .790 .559 .632 .775
df1 2 6 6 4 6 4 4 10 16 12 10 10 8 20
df2 137 274 274 274 274 274 274 274 274 274 274 274 274 274
p .000** .570 .760 .510 .640 .600 .707 .195 .238 .414 .638 .847 .750 .743
Note: ** p < .01 Analysis of Variance Univariate ANOVAs were performed to further investigate the effect of gender on the dependent variables for cognitive and social complexity. Significant gender differences were found in cognitive differentiation and in the grand mean of cognitive complexity, F (1,201) = 11.53, p < .01 and F (1,201) = 5.196, p < .05, respectively. The partial eta squared values for the two factors were .054 and .025, respectively. In terms of gender, the mean score of females was higher than males for both cognitive differentiation and overall scores for cognitive complexity. Significant gender differences were found in all three social complexity variables (range, differentiation, and the grand mean of the two), F (1,202) = 27.397, p < .01, F (1,202) = 38.133, p < .01, and F (1,202) = 43.969, p < .01, respectively. The partial eta squared values for the three factors were 95
Texas Tech University, Sara Dodd, December 2009
.119, .159, and .179, respectively. The Table 4.18 shows the results of the ANOVAs. Means and standard deviations are shown in Table 4.19. There were no significant differences for the other categorical variables in the self behavioral complexity measures. Table 4.18 Analysis of Variance by Gender for Cognitive and Social Complexity Source Cognitive Complexity Differentiation Grand Mean Social Complexity Differentiation Range Grand Mean
df1
df2
F
η²
1 1
202 202
3.555 5.196
.054 .025
.00** .02*
1 1 1
202 202 202
38.133 27.397 43.969
.119 .159 .179
.00** .00** .00**
Note: ** p < .01, * p < .05 Table 4.19 Means and Standard Deviations by Gender for Cognitive and Social Complexity
Cognitive Complexity Differentiation Grand Mean Social Complexity Differentiation Range Grand Mean
Gender
Mean
SD
Female Male Female Male
3.70 3.42 3.70 3.54
.53 .60 .46 .52
Female Male Female Male Female Male
3.71 3.15 4.03 3.49 3.87 3.32
.60 .63 .67 .76 .54 .61
96
p
Texas Tech University, Sara Dodd, December 2009
Summary of Data Analysis The results of the data analyses offer support for hypotheses 1 – 3: cognitive complexity and social complexity are related to each other as well as to behavioral complexity. Furthermore, the analyses suggest that higher levels of cognitive and social complexity can predict higher values of behavioral complexity. Likewise the fourth hypothesis was supported by the finding that a positive predictive relationship exists between supervisor behavioral complexity and supervisor leader effectiveness. The first research question regarding the relationship between self behavioral complexity and supervisor behavioral complexity was answered by correlation and regression analyses. These procedures showed that self behavioral complexity has a modest predictive relationship. Multivariate analyses of variance and univariate analysis of variance indicated some gender differences with cognitive and social complexity.
97
Texas Tech University, Sara Dodd, December 2009
CHAPTER V DISCUSSION OF RESULTS AND CONCLUSION
This chapter presents a summary of the study, including the background, findings, implications, and conclusions based on the analysis of the data. Limitations and recommendations for future research also are presented. Background Leaders and the act of leadership have been the subject of continuous human reflection, study, and speculation (Bass, 1990). In the modern era, examination of what leaders look like, what they do, and why it matters, has focused largely on the way in which leadership (or the lack thereof) impacts human endeavor. Much of what is found in contemporary leadership literature has its roots in the leadership scholarship that began after World War II – a global conflict in which the quality of leadership was a defining factor in the outcome (Bedeian & Hunt, 2006). The veterans of this war returned home and became the face of management and organizational growth in the American economy for many years. Over the next half century, the words ‘manager’ and ‘leader’ became so closely interwoven that it took scholars years to unravel the conceptual distinction between management and leadership, and to give that distinction the weight necessary to foster continued study. As articulated by Day and Halpin (2004), leadership “is the aggregate ability to create shared work that is meaningful to people and to add value to an organization. From this latter perspective, everyone can and should participate in leadership” (p. 12). If individuals in formal management or supervisory positions are the 98
Texas Tech University, Sara Dodd, December 2009
only subjects for studies of leadership, then a key component of the phenomenon of leadership has been overlooked. Another important development in the scholarship of leadership, particularly managerial leadership, has been the exploration of the links between leader behavior and complexity. Leadership researchers have turned to the considerable body of work that exists for understanding how different kinds of information (cognitive and social/emotional) are processed and how such processing relates to complex behaviors associated with effective leadership (Day & Halpin, 2004; Denison et al., 1995). The emergence of a new conceptual framework that brings together the differentiated and integrated components of cognitive and social complexity as they impact behavioral complexity (and leader effectiveness) was an important development. However, even though introduced over ten years ago, the Leaderplex model has yet to be empirically examined. This study responds to the call of Day and Lance (2004) for exploration of “unresolved questions about the leaderplex model, including what constitutes the content of complexity, how best to measure the various aspects of complexity, [and] the appropriate causal relationship among the various concepts ….” (p. 47).
Purpose and Method The purpose of this study was to assess the proposed structure and relationships of the Leaderplex model. Specifically, the model was deconstructed to assess the hypothesized positive relationships between cognitive, social, and behavioral complexity and the impact of behavioral complexity upon leader effectiveness. Professional 99
Texas Tech University, Sara Dodd, December 2009
employees of Cooperative Extension systems in four states were the participants in this study (N=207). The study was conducted as an online survey. Established validated measures were selected to assess each type of complexity as well as leader effectiveness. In addition, sociodemographic and work-related data were collected in order to understand how the model interacted with the Extension sample. Four hypotheses and two research questions guided the design of the survey.
Summary and Discussion of Findings Hypotheses 1-4 Relationships between Cognitive, Social, and Behavioral Complexity Correlation analysis revealed that scores on cognitive complexity (CC) were significantly and positively correlated to scores on social complexity (SC) (r = .32, p < .01). Likewise, both cognitive complexity and social complexity on their own were positively correlated with behavioral complexity (CC and BC, r = .35, p < .01; SC and BC, r = .25, p < .01). While the strength of these relationships is modest, the correlations are significant, indicating that as a respondent’s CC increased, the more likely his or her SC also increased. Thus H1-3 were supported. Of further interest is the positive relationship revealed between behavioral complexity (reported on self) and supervisor behavioral complexity and supervisor leader effectiveness (r = .30, p < .01 and r = .19, p < .01, respectively). Again, while not a strong relationship, the existence of a significant correlation between how respondents’ perceive their own behavioral complexity and how they perceive the behavior and 100
Texas Tech University, Sara Dodd, December 2009
effectiveness of their supervisors offers emerging support for the relationships hypothesized in the model. The distinction in behavioral complexity between repertoire and differentiation is shown to be subtle both conceptually and empirically. Although the regression analyses revealed some issues with multicollinearity, the indicators were moderate to weak. This suggests that perceptions of variation in the use of different leader behaviors, and the interaction of that variance with overall behavioral repertoire, merits continued investigation. Regression analyses demonstrated a modest but significant ability of self-assessed levels of cognitive complexity and social complexity to predict levels of self behavioral complexity. While the overall amount of the two variables (represented in the grand means) accounted for 12.5% of the predictive relationship, cognitive integration and social differentiation accounted for more (16%). The predictive ability of cognitive integration may be attributable in part to the semantic framing of the cognitive integration (CC-I) and differentiation (CC-D) items – if different items had been selected for the study, the results likewise may have been different. However, it also may be attributable to the nature of the organizational environment from which the sample for the study was drawn. The items which comprised CC-I emphasized the gathering and utilization of information making decisions under ambiguous or uncertain conditions. The items for CC-D, on the other hand, were framed more toward the quantity of information used in interpersonal situations. In the Extension setting and culture, stability in practices and personnel is perhaps more of a norm than it would be in a typical for-profit organization. 101
Texas Tech University, Sara Dodd, December 2009
While the reasons and implications for turnover among Extension agents have been studied recently (Chandler, 2005; Strong & Harder, 2009), what is not clear is how Extension professionals compare to other highly educated employees working in professional capacities in commercial organizations in terms of attrition. However, in the state Extension systems that participated in this study, over 40% of the sample have worked for Extension 14 years or more; nearly 75% of the sample has been with Extension at least six years or more. Thus, the implication for the suggested stronger influence of the cognitive integration items may reflect the likelihood that the Extension professionals in this study deal with a relatively stable coworker population. In other words, if the participants in the study are not put into work situations where they must form relationships with new colleagues or clients on a continuous basis, then it may be logical that they do not have the need to exercise a high level of cognitive differentiation. The other significant contributor to the relationship between CC, SC, and BC was social differentiation. This result may at first appear to contradict the finding that cognitive integration rather than cognitive differentiation had a stronger predictive relationship to overall behavioral complexity. These items (see Appendix C) are most closely related to what is often referred to as emotional intelligence, “the ability to monitor one’s own feelings and emotions, to discriminate among them, and to use this information to guide one’s thinking and actions” (Salovey & Mayer, 1990, p. 189, as cited in Kobe, Reiter-Palmon, & Rickers, 2001, p. 158). Salovey and Mayer further assert that emotional intelligence is a “subset” of social intelligence, defined as the “ability to adapt to and act accordingly in a variety of social situations” (Kobe et al., p. 157). The 102
Texas Tech University, Sara Dodd, December 2009
ability to make behavioral adaptations should be preceded, logically, by social and emotional awareness (whether that awareness is intuitive or deliberately cultivated); that awareness seems to be reflected more closely in the social differentiation items than the social integration/range items. Relationship between Supervisor Behavioral Complexity and Leader Effectiveness As described in the previous chapter, the correlation analyses revealed a strong positive correlation between the grand means for supervisor behavioral complexity (SupBC) and leadership effectiveness (LE), r = .87, p < .01, providing support for H4. The subsequent regression analysis found a strong predictive relationship between the two, with SupBC explaining 75% of the variance (β = .80, t = 18.28, p = .000) in the LE score. Furthermore, the multiple regression procedure found that the addition of the terms for variance and the interaction between the SupBC grand mean and its variance raised the relationship to 76% and remained statistically significant. The negative coefficient for the SupBC variance (β = -.48, t = -2.63, p = .009) makes sense because the closer the variance is to zero, the more ‘equivalent’ the behaviors are perceived across all four roles. The coefficient for the interaction term (β = .43, t = 2.42, p = .017) requires a closer look at the components of behavioral complexity as hypothesized in the Leaderplex model, particularly given the potential problems with multicollinearity that were associated with the variance and interaction terms used in the regression procedures. The terms used for the regression between SupBC and LE (grand mean, variance, and interaction term) must be carefully considered in the framework of Leaderplex. Hooijberg, Hunt, and Dodge defined BC as a function of behavioral repertoire and 103
Texas Tech University, Sara Dodd, December 2009
behavioral differentiation. In this context, behavioral repertoire represents a collection of roles – a “portfolio” (p. 387) – that the leader can choose from according to the situation (and the expectations of those being affected). Behavioral repertoire applies not only to the number of roles an effective leader may call upon, but also the extent to which more roles (rather than fewer) are used, and used frequently. Another way to describe this particular component of behavioral repertoire is ‘balance’ – someone who consistently relies upon just one or two leadership roles cannot truly be said to be in possession of a repertoire of leader behaviors. As was discovered during the development of the Leaderplex model, “leaders who have a broad repertoire of leadership roles and who perform those roles frequently are seen as more effective by subordinates, peers, and superiors.” (p. 388) Thus, it seems reasonable to put forth the grand means of the four roles from the BC measure, as well as the variance between them, as appropriate measures of the overall size and balance of the behavioral repertoire perceived in the Extension professionals in this study. The other component to behavioral complexity articulated in the Leaderplex model is behavioral differentiation. It is this component which has been considered to be the most analogous to the variance term that was utilized in the regression analyses for the fourth hypothesis. According to Hooijberg et al.: The concept of behavioral differentiation suggests that managerial leaders who vary the performance of their leadership roles, depending on the relationship they have with the people with whom they interact, will function more effectively than those who do not. (p. 389) 104
Texas Tech University, Sara Dodd, December 2009
From this description, it would appear that higher levels of behavioral differentiation should generally be considered a good thing, yet Hooijberg (1996) found that differentiated behaviors were viewed positively by superiors, but negatively by subordinates – one group viewed the behaviors as appropriately adaptive and flexible while the other viewed such behaviors as at best inconsistent, and at worst, “lacking in integrity” (Hooijberg et al., p. 390). So, perhaps a case can be made that the variance measures gathered from one group (subordinates) in conjunction with the interaction term used in the analyses for this study (the product of the SupBC mean and variance scores) may serve to provide another way of looking at behavioral differentiation. It may be that the interaction term represents not only the extent to which different leader behaviors are observed, but also the extent to which these behaviors are performed differently – a concept at the heart of the development of the Leaderplex Model (Hooijberg et al., 1997). For example, if a respondent has scored their supervisor as having relatively high overall behavioral complexity (grand mean of collaborate, create, control, and compete quadrants) of 4.0 and the variance between those quadrants means is .10, the product of those terms is .40. Another respondent scores their supervisor BC = 3.75, with a variance of .50, with the product of 1.88. Does the higher interaction score for the second respondent indicate a higher level of behavioral differentiation, or merely a less developed repertoire? As the regression analysis for this hypothesis seems to suggest, the higher the interaction term is, the more impact it had on the R2, but is this attributable more to the nature of the Extension sample and/or the research design for this study? Subsequent studies will be 105
Texas Tech University, Sara Dodd, December 2009
important in order to better understand the influence of the variance and interaction terms in defining behavioral differentiation. Research Questions Relationship between Behavioral Complexity (self) and Supervisor Behavioral Complexity As has already been noted, correlation analysis revealed that scores on self behavioral complexity and supervisor behavioral complexity were positively correlated, r = .30, p < .01. While not a strong relationship, the existence of a significant correlation between how respondents’ perceive their own behavioral complexity and how they perceive the behavioral complexity of their supervisors offers another element of structural consistency to the Leaderplex model. Likewise, the subsequent regression analysis showed that perception of one’s own behavioral complexity accounted for almost 10% of how the supervisor’s behavioral complexity was evaluated. This result is consistent with the work of multiple researchers who have found that self-conception gives structure to the ways in which individuals respond to leader actions (see van Knippenberg et al., 2005). Engle and Lord (1997) found that when subordinates perceived themselves similarly to their supervisors, this predicted the quality they assigned to interactions between them. The nature of this similarity and the accompanying feeling of “liking” mediates not only perceptions of the supervisor’s behaviors, but it also has a moderating effect on the continued development of the subordinates’ own leadership identity and implicit leadership theories (Lord & Hall, 2005). 106
Texas Tech University, Sara Dodd, December 2009
Given Berrio’s findings (2003) about the strong “clan” culture of Extension, it perhaps is somewhat surprising (and possibly of concern to the organization) that the relationship between self behavioral complexity and supervisor behavioral complexity was not somewhat stronger. As many researchers have reported, Extension finds itself in an operating environment where change is the norm (Hoag, 2005; Ilvento, 1997); McDowell, 2001; Parker, 2004). The implications of being an Extension professional working in this environment range from concerns about work load to financial remuneration/incentives to career development opportunities. The impact of organizational change on these types of concerns can be moderated by the quality of leadership (Strong & Harder, 2009). If Extension professionals identify less and less with their supervisors, and/or feel increasingly insecure in the organization’s ability and willingness to invest in professional development, the more challenging it may become for Extension in terms of recruiting and retention. Relationship between Gender, Cognitive Complexity, and Social Complexity The multivariate analyses of variance revealed significant gender differences among the Extension respondents and scores for cognitive and social complexity (although not for behavioral complexity). One-way ANOVAs revealed that mean scores for cognitive differentiation, social differentiation, and social integration (range) all were higher for women than for men. There were no significant differences between males and females on the cognitive integration scale. The higher self-report scores among women on the constructs of both social complexity and cognitive complexity are of interest when considered in the context of 107
Texas Tech University, Sara Dodd, December 2009
previous studies. Rudd (2000) found gender differences between self-assessed and observed leadership style strengths and weaknesses among Florida county extension directors. He reported that while all of the county directors ranked themselves as fairly high on leadership practices, females consistently scored themselves lower and males consistently ranked themselves higher.3 This finding aligns with research that has found gender differences in self-assessment in a number of categories such as intelligence, performance appraisal, and leadership practices (Fletcher, 1999; Furnham, 2001; Rudd (2000). Regardless of category, males consistently bring more confidence to evaluating themselves in a positive light while females tend to underrate or judge themselves more harshly. The female Extension professionals in the current study, however, appear not to conform in the areas of social complexity and cognitive differentiation. In his assessment of gender differences and the use of 360° performance appraisal, Fletcher found an association between women’s greater openness and willingness to disclose and their ability to give and receive accurate feedback. While in some settings (for example, a job interview) this quality may be seen in a negative light, it may have important benefits in an environment where those in authority are being asked to lead substantive and potentially unpopular organizational change. Parker’s study (2004) examined the leadership styles of agricultural communications and information technology managers from Cooperative Extension units across the United States. She used an assessment tool based on the Competing Value Framework (Quinn, 1988) that also served as the theoretical basis for the instrument used 3
Conversely, observers placed the female extension directors higher on four out of five leadership practices; the one practice on which females scored themselves higher than males was in the category of enabling others.
108
Texas Tech University, Sara Dodd, December 2009
in this study to measure behavioral complexity. Her findings did not indicate significant gender differences except in the Producer role, which correlates to the compete role in the behavioral repertoire (Lawrence, Lenk, & Quinn, 2009) used in the current study 4. In Parker’s study, women scored higher than men in this role, which may seem counterintuitive to commonly held perceptions about female managers as primarily mentoring and participative in management style. McGee’s qualitative study of women in executive Extension roles (1994) provides yet another perspective, that of the importance of early life experiences (particularly with strong fathers), ongoing support from colleagues and mentors as well as families, and the minimization of gendered behavior in the organizational setting. Whatever the reasons may be, it is an interesting finding – one worthy of further exploration -- that female Extension professionals in this study bring to their work the levels and types of complexity that are related to the enactment of effective leader behaviors.
Conclusions Implications The primary purpose of this study was to examine empirical support for the Leaderplex model. Cognitive complexity and social complexity interact in such a manner as to impact and even predict behavioral complexity. Behavioral complexity, in turn, impacts perceptions of leader effectiveness to the extent that careful thought and attention should be given to how individuals can build and develop a repertoire of behaviors, and 4
In this study, compete was represented by these items: Modeling an intense work effort; demonstrating full exertion on the job; providing fast responses to emerging issues, emphasizing the need to compete for external resources.
109
Texas Tech University, Sara Dodd, December 2009
learn how to use that repertoire in different ways. For Extension, some key findings emerge: First, something in the culture and structure of Extension either attracts individuals who are already behaviorally complex (or emergent) or at the least provides an environment where these behaviors are stimulated, developed, and valued. Secondly, female Extension professionals seem to bring a more balanced array of cognitive and social processing to the workplace than do their male counterparts. This finding in and of itself suggests that perhaps it is time for Extension leaders to make a more deliberate assessment of the sources of gender differences in the behaviors of their professional employees. Given the dynamic environment in which many state Extension organizations find themselves, there is value in exploring further where the Extension leaders of the future may be most in need of targeted professional development.
Limitations The limitations of this study can be found in two main areas, measurement and design. First, identifying and selecting the most appropriate instruments to examine the structure of the Leaderplex model was a significant challenge to this study. Measurement There is widespread agreement among scholars of leadership and of complexity in general that the lack of objective measures for complexity constructs (cognitive complexity in particular) continues to hamper the development of theory. As discussed at some length in Chapter III, the measure of cognitive complexity considered to be the most “valid” is a lengthy pen and paper measure which is time-consuming and expensive 110
Texas Tech University, Sara Dodd, December 2009
both to administer and to score. Unless it is possible to have a captive audience (e.g., college students) or paid participants for a sample it is difficult to ask respondents to invest more than 30 minutes on only one measure. The social complexity measure used in this study originally was designed to measure emotional complexity (Kang & Shaver, 2004). While social complexity and emotional complexity often are considered virtually interchangeable terms for the same construct, it would be useful to adapt the scale with wording more appropriate for respondents in organizational settings. Some respondents in a work environment may find the “emotion” vocabulary of some of the items to be incongruous, such that it affects their reactions and responses and introduces unintended biases. Lastly, while the behavioral complexity instrument developed by Lawrence, Lenk, and Quinn (2009) is the most timely and construct-relevant measure for behavioral complexity, it does present some challenges in testing the theoretical structure of Leaderplex. Because it has a multidimensional foundation, the behavioral repertoire instrument makes it difficult to take advantage of more sophisticated statistical analysis procedures. Design Technology issues and concerns related to human subjects caused design issues that could not be circumvented. Ideally, the Leaderplex model should be assessed using true and objective 360° evaluation. To really understand the relationships between the different types of complexity and an individual’s leader effectiveness, responses should be collected from the group(s) of persons who interact the most with that individual – 111
Texas Tech University, Sara Dodd, December 2009
subordinates but also peers, supervisors, and external stakeholders. The logistics of conducting such a comprehensive survey were beyond the scope of this study. Other design issues were the result of trying to collect a considerable amount of data from respondents. Some work-related questions were not included because of the length of the survey. For example, the gender of supervisor was not asked and thus it was not possible to fully explore possible gender difference in the different types of complexity as well as leader effectiveness. In addition, while the survey asked about the program area in which county agents worked, the same question was not asked of program and subject specialists, thus eliminating the possibility of determining whether there were differences in the dependent variables according to the job subject matter. Recommendations for Future Research The results offer promising opportunities for continued research, both for continued validation of the Leaderplex model and also for Cooperative Extension organizations. In order to fully understand how behavioral complexity works in the environment of Cooperative Extension, a second study should be undertaken with Extension professionals from different states. A subsequent study should incorporate improvements to the survey design identified above, but it should remain comparable in order to supplement the sample size gathered in this study. The second study further should receive deeper analysis on the relationship between the different quadrants of the behavioral complexity measure (collaborate, create, control, and compete) and categorical variables such as gender, job type/program area, and stakeholder relations. Qualitative research also may be helpful in continued refinement of the model and in 112
Texas Tech University, Sara Dodd, December 2009
examining in depth some of the elements of cognitive and social complexity. This in turn may encourage studies which produce an objective measure for cognitive complexity which is easier to administer, as well as a social complexity measure better suited for use in organizational settings. In terms of the Leaderplex model itself, this exploratory study offers promising tentative support for the structural integrity of the model. Identifying new or improved measures for cognitive and social complexity for future tests of the model will strengthen the ability of the model to influence the ongoing study of what it means to behave like a leader.
113
Texas Tech University, Sara Dodd, December 2009
REFERENCES Albaum, G.S., & Smith, S.M. (2005). Fundamentals of marketing research. Thousand Oaks, California: Sage Publications. Baker-Brown, G., Ballard, E. J., Bluck, S., Vries, B. d., Suedfeld, P., & Tetlock, P. E. (1992). The conceptual/integrative complexity scoring manual. In C. P. Smith, J. W. Atkinson, D. C. McClelland & J. Veroff (Eds.), Motivation and personality: Handbook of thematic content analysis. (pp. 401-418). New York: Cambridge University Press. Bartunek, J. M., Gordon, J. R., & Weathersby, R. P. (1983). Developing "complicated" understanding in administrators. The Academy of Management Review, 8(2), 273284. Bass, B. M. (1990). Bass & Stogdill's Handbook of Leadership: Theory, Research, and Managerial Applications (Third ed.). New York: The Free Press. Bedeian, A. G., & Hunt, J. G. (2006). Academic amnesia and vestigial assumptions of our forefathers. The Leadership Quarterly, 17, 190-205. Belasen, A., & Frank, N. (2008). Competing values leadership: Quadrant roles and personality traits. Leadership & Organization Development Journal, 29(2), 127143. Berrio, A.A. (2003, April). An organizational culture assessment using the competing values framework: A profile of Ohio State University Extension. Journal of Extension, 41(2), Article 2FEA3. Retrieved May 22, 2009, from http://www.joe.org/joe/2003april/a3.php. Bieri, J., Atkins, A. L., Briar, S., Leaman, R. L., Miller, H., & Tripodi, T. (1966). Clinical and social judgment: The discrimination of behavioral information. New York: John Wiley & Sons, Inc. Buenger, V., Daft, R. L., Conlon, E. J., & Austin, J. (1996). Competing values in organizations: Contextual influences and structural consequences. Organization Science, 7(5), 557-576. Burleson, B. R., & Caplan, S. E. (1998). Cognitive complexity. In J. C. McCroskey, J. A. Daly, M. M. Martin & M. J. Beatty (Eds.), Communication Personality Trait Perspectives. (pp. 233-286). Cresskill, New Jersey: Hampton Press, Inc. Calori, R., Johnson, G., & Sarnin, P. (1994). CEOs' cognitive maps and the scope of the organization. Strategic Management Journal, 15(6), 437-457. 114
Texas Tech University, Sara Dodd, December 2009
Cameron, K. S., Quinn, R. E., Degraff, J., & Thakor, A. V. (2006). Competing values leadership: Creating value in organizations. Cheltenham, UK: Edward Elgar Publishing Limited. Chandler, G. D. (2005). Organizational and individual factors related to retention of county extension agents employed by Texas Cooperative Extension. Dissertation Abstracts International, 65(12), 4432A. (UMI No. 3157047). Day, D. V., & Halpin, S. M. (2004). Growing leaders for tomorrow: An introduction. In D.V. Day, S.J. Zaccaro, & S.M. Halpin (Eds.), Leader Development for Transforming Organizations: Growing Leaders for Tomorrow (pp. 3-22). Mahway, New Jersey: Lawrence Erlbaum Associates. Day, D. V., & Lance, C. E. (2004). Understanding the development of leadership complexity through latent growth modeling. In D.V. Day, S.J. Zaccaro, & S.M. Halpin (Eds.), Leader Development for Transforming Organizations: Growing Leaders for Tomorrow (pp. 41-69). Mahway, New Jersey: Lawrence Erlbaum Associates. deJanasz, S. C., & Behson, S. J. (2007). Cognitive capacity for processing work-family conflict: An initial examination. Career Development International, 12(4), 397411. Denison, D. R., Hooijberg, R., & Quinn, R. E. (1995). Paradox and performance: Toward a theory of behavioral complexity in managerial leadership. Organization Science, 6(5), 524-540. Driver, M. J., Brousseau, K. R., & Hunsaker, P. L. (1990). The dynamic decision maker: Five decision styles for executive and business success. New York: Harper & Row. Driver, M. J., & Rowe, A. J. (1979). Decision-making styles: A new approach to management decision making. In C. L. Cooper (Ed.), Behavioral problems in Organizations (pp. 141-182). Englewood Cliffs, NJ: Prentice-Hall, Inc. Engle, E. M., & Lord, R. G. (1997). Implicit theories, self-schemas, and leader-member exchange. Academy of Management Journal, 40, 988-1010. Ensle, K. M. (2005, June). Burnout: How does Extension balance job and family? Journal of Extension, 43(3), Article 3FEA5. Retrieved September 25, 2009, from http://www.joe.org/joe/2005june/a5.php. Fletcher, C. (1999). The implication of research on gender differences in self-assessment and 360 degree appraisal. Human Resource Management Journal, 9(1), 39-46. 115
Texas Tech University, Sara Dodd, December 2009
Furnham, A. (2001). Self-estimates of intelligence: Culture and gender difference in self and other estimates of both general (g) and multiple intelligences. Personality and Individual Differences, 31, 1381-1405. Halberstad, J. B., Niedenthal, P. M., & Setterlund, M. B. (1996). Cognitive organization of different tenses of the self mediates affect and decision making. In L. L. Martin & A. Tesser (Eds.), Striving and feeling: Interactions among goals, affect, and self-regulation (pp. 123-150). Mahway, New Jersey: Lawrence Erlbaum Associates. Hall, R. J., Workman, J. W., & Marchioro, C. A. (1998). Sex, task, and behavioral flexibility effects on leadership perceptions. Organizational behavior and human decision processes, 74(1), 1-32. Hart, S. L., & Quinn, R. E. (1993). Roles executives play: CEOs, behavioral complexity, and firm performance. Human Relations, 46(5), 543-565. Hoag, D. L. (2005). Economic principles for saving the Cooperative Extension Service. Journal of Agricultural and Resource Economics, 30(3), 397-410. Hooijberg, R. (1996). A multidirectional approach toward leadership: An extension of the concept of behavioral complexity. Human Relations, 49(7), 917-946. Hooijberg, R., Hunt, J. G., & Dodge, G. E. (1997). Leadership complexity and development of the leaderplex model. Journal of Management, 23(3), 375-408. Huffman, W. E., & Just, R. E. (2000). Setting efficient incentives for agricultural research: Lessons from principal-agent theory. American Journal of Agricultural Economics, 82(4), 828-841. Hunt, J. G. (1991). Leadership: A new synthesis. Newbury Park, CA: Sage. Ilvento, T. W. (1997). Expanding the role and function of the Cooperative Extension System in the university setting. Agriculture and Resource Economics Review, (26), 153-163. Janasz, S. C. d., & Behson, S. (2007). Cognitive capacity for processing work-family conflict: An initial examination. Career Development International, 12(4), 397411. Jaques, E., & Clement, S. D. (1991). Executive leadership: A practical guide to managing complexity. Arlington, VA: Cason Hall & Co. 116
Texas Tech University, Sara Dodd, December 2009
Journal of Extension National Job Bank. (2008). Retrieved May 3, 2008, from http://jobs.joe.org/ Kalliath, T. J., Bluedorn, A. C., & Gillespie, D. F. (1999). A confirmatory factor analysis of the competing values instrument. Educational and Psychological Measurement, 59, 143-158. Kang, S.-M., Day, J. D., & Meara, N. M. (2005). Social and emotional intelligence: Starting a conversation about their similarities and differences. In R. Schulze & R. D. Roberts (Eds.), Emotional intelligence: an international handbook. (pp. 91105). Gottingen, Germany: Hogrefe & Huber Publishers. Kang, S.-M., & Shaver, P. R. (2004). Individual differences in emotional complexity: Their psychological implications. Journal of Personality, 72(4), 687-725. Kobe, L. M., Reiter-Palmon, R., & Rickers, J. D. (2001). Self-reported Leadership Experiences in Relation to Inventoried Social and Emotional Intelligence. Current Psychology, 20(2), 154-163. Larson, J. R., Jr. (1982). Cognitive mechanisms mediating the impact of implicit theories of leader behavior on leader behavior ratings. Organizational behavior and human performance., 29, 129-140. Larson, L. L., & Rowland, K. M. (1974). Leadership style and cognitive complexity. The Academy of Management Journal, 17(1), 37-45. Lawrence, K. A., Lenk, P., & Quinn, R. E. (2009). Behavioral complexity in leadership: The psychometric properties of a new instrument to measure behavioral repertoire. Leadership Quarterly, 20, 87-102. Lomax, R.G. (2007). Statistical concepts: A second course. (3rd ed.). Mahway, NJ: Lawrence Erlbaum Associates. Lord, R. G., & Brown, D. J. (2004). Leadership processes and follower identity. Mahway, NJ: Lawrence Erlbaum Associates. Lord, R. G., & Hall, R. J. (2005). Identity, deep structure and the development of leadership skill. Leadership Quarterly, 16, 591-615. Lepley, T. L. (2003). Work, life, and effect of job on family satisfaction of Texas extension agents. Unpublished dissertation. Texas A&M University, College Station, TX.
117
Texas Tech University, Sara Dodd, December 2009
Marshall, W.H. (1973/2001). Issues affecting the future of home economics. Journal of Home Economics, September 1973. Reprinted in Journal of Family and Consumer Sciences, 93(4), 1-3. Mayer, J. D., & Salovey, P. (1997). What is Emotional Intelligence? In P. Salovey & D. J. Sluyter (Eds.), Emotional development and emotional intelligence: Educational implications. New York: BasicBooks. McDowell, G. R. (2001). Land-Grant Universities and Extension into the 21st Century: Renegotiating or Abandoning a Social Contract. (1st ed.). Ames, Iowa: Iowa State University Press. McGee, B. D. (1994). Women CEOs in the Cooperative Extension system: Seeking connection between early life experiences and leadership development. Unpublished dissertation. Texas A&M University, College Station, TX. McGill, A. R., Johnson, M. D., & Bantel, K. A. (1994). Cognitive complexity and conformity: Effects on performance in a turbulent environment. Psychological Reports, 75, 1451-1472. Mumford, M. D., Zaccaro, S. J., Harding, F. D., Jacobs, T. O., & Fleishman, E. A. (2000). Leadership skills for a changing world: Solving complex social problems. The Leadership Quarterly, 11, 11-35. Parker, K. L. (2004). Leadership styles of Agricultural Communications and Information Technology Managers: What does the Competing Values Framework tell us about them? Journal of Extension, 42(1), Article 1FEA1. Retrieved September 8, 2009, from http://www.joe.org/joe/2004february/a1.php. Paulhus, D. L., & Martin, C. L. (1988). Functional flexibility: A new conception of interpersonal flexibility. Journal of Personality and Social Psychology, 55(1), 88101. Quinn, R. E. (1988). Beyond rational management. San Francisco, CA: Jossey-Bass. Quinn, R. E., Faerman, S. R., Thompson, M. P., & McGrath, M. R. (2003). Becoming a master manager: A competency framework (3rd ed.). New York: John Wiley & Sons. Quinn, R. E., & Rohrbaugh, J. (1981). A competing values approach to organizational effectiveness. Public Productivity Review, 5(2), 122-140. Rasmussen, W. D. (1989). Taking the university to the people: Seventy-five years of Cooperative Extension. Ames, Iowa: Iowa State University Press. 118
Texas Tech University, Sara Dodd, December 2009
Richards, M.V. (2000). The postmodern perspective on home economics history. Journal of Family and Consumer Sciences, 92(1), 81-84. Rudd, R. D. (2000). Leadership styles of Florida's county Extension directors: Perceptions of self and others. Paper presented at the 27th Annual National Agricultural Education Research Conference, San Diego, CA. Samter, W. (2002). How gender and cognitive complexity influence the provision of emotional support: A study of indirect effects. Communication Reports, 15(1), 516. Samter, W., Burleson, B. R., & Basden-Murphy, L. (1989). Behavioral complexity is in the eye of the beholder: Effects of cognitive complexity and message complexity on impressions of the source of comforting messages. Human Communication Research, 15(4), 612-629. Satish, U. (1997). Behavioral complexity: A review. Journal of Applied Social Psychology, 27(23), 2047-2067. Streufert, S., & Nogami, G. Y. (1989). Cognitive style and complexity: Implications for I/O Psychology. In C. L. Cooper & I. Robertson (Eds.), International review of industrial and organizational psychology 1989. Chichester, New York: John Wiley & Sons. Streufert, S., & Swezey, R. W. (1986). Complexity, Managers, and Organizations. Orlando, FL: Academic Press. Strong, R., & Harder, A. (2009, February). Implications of Maintenance and Motivation Factors on Extension Agent Turnover. Journal of Extension, 47(1), Article 1FEA2. Retrieved September 11 2009, from http://www.joe.org/joe/2009february/a2.php. Suedfeld, P., Tetlock, P. E., & Streufert, S. (1992). Conceptual/integrative complexity. In C. P. Smith, J. W. Atkinson, D. C. McClelland & J. Veroff (Eds.), Motivation and personality: Handbook of thematic content analysis (pp. 393-400). New York: Cambridge University Press. United States Department of Agriculture. USDA Cooperative State Research, Education, and Extension Service website. Retrieved November 27, 2007, from http://www.csrees.usda.gov/qlinks/extension.html United States Department of Agriculture. About us: CREES Overview. Retrieved September 4, 2009, from http://www.csrees.usda.gov/about/background.html 119
Texas Tech University, Sara Dodd, December 2009
van Knippenberg, D., van Knippenberg, B., De Cremer, D., & Hogg, M.A. (2005). Research in leadership, self, and identity: A sample of the present and a glimpse of the future. The Leadership Quarterly, 16, 495-499. Woehr, D. J., Miller, M. J., & Lane, J. A. S. (1998). The development and evaluation of a computer-administered measure of cognitive complexity. Personality and Individual Differences, 25, 1037-1049. Yasai-Ardekani, M. (1986). Structural adaptations to environments. The Academy of Management Review, 11(1), 9-21. Yukl, G. (2002). Leadership in Organizations (5th ed.). Upper Saddle River, NJ: Prentice-Hall.
120
Texas Tech University, Sara Dodd, December 2009
Appendix A Recruitment Email Memo to:
Extension professional
From:
Director’s name Name of state
Subject:
Cooperative Extension
Important research opportunity
Name of state Cooperative Extension has been asked to participate in an academic survey of leadership behaviors among Extension professionals. This research has the potential to provide Extension with valuable information about the effectiveness of our organization and its leadership processes. If you would like to participate, please use the link below to navigate to the online version of the survey. The IP addresses of computers used to complete the survey will not be tracked or stored. Responses will be aggregated (that is, individual respondents cannot be identified by their answers). Your completion of the survey is completely voluntary and your job duties and/or performance are in no way impacted should you choose not to participate. You are free to leave blank any questions you do not want to answer, and you may exit the survey at any time. Completing the survey should take approximately 15-20 minutes. Should you choose to participate in this survey, your participation is anonymous – we are not asking for names and cannot link survey responses with individuals. This research has been approved by the Texas Tech University Institutional Review Board for the Protection of Human Subjects, Protocol # 501397. If you have questions about your rights as a participant, you may contact the Office of Research Services at Texas Tech University, Lubbock, Texas 79409. If you have any questions about this study, please contact Dr. Karen Alexander (Principal Investigator),
[email protected], or Sara Dodd (co-PI),
[email protected], Texas Tech University, P.O. Box 41210, Lubbock, TX 794091210 or, (806) 742-3000, Ext. 229. Click on the link below to enter the survey: https://www.surveymonkey.com/s.aspx?sm=j9syTODCTIvBT1vWaB2eng_3d_3d
121
Texas Tech University, Sara Dodd, December 2009
Appendix B Subset of Items from the Driver-Streufert Complexity Index (DSCI) (Driver et al., 1990) 1. In social activities, at gatherings and at work, I like dealing with one person at a time, and preferably with a person like myself. 2. In evaluating a new or changed situation, I look for diverse points of view, and often form several possible judgments which may or may not modify my previous outlook. 3. In making new friends, I prefer those who are similar to me in values and opinions. 4. In confusing or ambiguous situations, I put off decisions indefinitely. 5. In solving problems, I function extremely well when neither problem nor solution is clear. 6. I have considerable difficulty in understanding the motives and ideas of others. 7. I prefer situations where there is a single problem with one possible solution. 8. I feel extremely happy when I have many distinct, unrelated projects going. 9. In a discussion, I like taking a different point of view from my own. I learn more about my own view as well as others in this way. 10. In forming impressions of others, I use basically the same few, reliable categories. 11. In considering problems and situations, I greatly enjoy and seek out problems that may require many points of view. 12. When a considerable amount of new and apparently contradictory information becomes available on a topic about which I have a strong opinion, I am not affected by the new information, since I rarely take strong positions in any area. 13. I prefer situations where there are a number of different kinds of problems that can be solved in the same basic manner. 14. In making friends, I use many criteria, with similarity in values and opinions not being of great consequence for me. 15. I enjoy being in groups with few fixed rules and many diverse personalities. 16. In doing work, I have liked having no direct supervision but someone to talk over problems with. 17. When someone suggests that I should change my behavior, I go along, if after careful consideration of the various interpretations of what he/she said, it makes sense in terms of my views. 18. In considering problems and situations, I hesitate to solve problems that involve many points of view. Scale: 1 to 5 Anchors: 1 = Not at all characteristic of me 5 = Extremely characteristic of me 122
Texas Tech University, Sara Dodd, December 2009
Appendix C Range* and Differentiation** of Emotional Experience Scale (RDEES) (Kang & Shaver, 2004) 1. 2. 3. 4. 5. 6.
I don’t experience many different feelings in everyday life. (Reverse-coded) I am aware of the different nuances or subtleties of a given emotion. I have experienced a wide range of emotions throughout my life. Each emotion has a very distinct and unique meaning to me. I usually experience a limited range of emotions. (Reverse-coded) I tend to draw fine distinctions between similar feelings (e.g., depressed and blue; annoyed and irritated). 7. I experience a wide range of emotions. 8. I am aware that each emotion has a completely different meaning. 9. I don’t experience a variety of feelings on an everyday basis. (Reverse-coded) 10. If emotions are viewed as colors, I can notice even small variations within one kind of color (emotion). 11. Feeling good or bad – those terms are sufficient to describe most of my feelings in everyday life. (Reverse-coded) 12. I am aware of the subtle differences between feelings I have. 13. I tend to experience a broad range of different feelings. 14. I am good at distinguishing subtle differences in the meaning of closely related emotion words. Scale: 1 to 5 Anchors: 1 = Does not describe me very well 5 = Describes me very well *Odd-numbered items represent Range (or integration). **Even-numbered items represent Differentiation.
123
Texas Tech University, Sara Dodd, December 2009
Appendix D Subset of Behavioral Repertoire Instrument (Lawrence, Lenk, & Quinn, 2009) Agreement with each statement indicated on a 5-point Likert-type scale (1 = strongly disagree, 2 = disagree, 3 = neither agree/disagree, 4 = agree, 5 = strongly disagree. Items to be randomized. Adapted for Extension [italics indicates modification in language for different reporting levels and/or Extension circumstances; italics don’t appear on the instrument presented to respondents]. “I would describe
[myself and/or my supervisor]
as being skilled in the following . . .”
1. Employing participative decision making. 2. Maintaining an open climate for discussion. 3. Encouraging career development. 4. Coaching people on career issues. 5. Being aware of when people are burning out. 6. Encouraging people to have work/life balance. 7. Identifying the changing needs of the client/direct reports. 8. Anticipating what the client/direct reports will want next. 9. Initiating bold projects. 10. Launching important new efforts. 11. Encouraging colleagues/clients to try new things. 12. Getting team members to exceed traditional performance patterns. 13. Seeing that Extension procedures are understood. 14. Emphasizing the need for accuracy in work efforts. 15. Expecting people to get the details of their work right. 16. Providing tight program management. 17. Keeping programs under control. 18. Emphasizing the need to compete for external resources. 19. Modeling an intense work effort. 20. Demonstrating full exertion on the job. 21. Providing fast responses to emerging issues.
124
Texas Tech University, Sara Dodd, December 2009
Appendix E Leader Effectiveness Instrument (Denison et al., 1995; Lawrence et al., in press) 1. Meeting of professional performance standards: Above most standards 1 2 3 4 5
Below most standards (reverse-coded)
2. Comparison to person’s professional peers: Worse than peers 1 2
3 4 5
Better than peers
3. Performance as a role model: Poor role model
1
2
3 4 5
Excellent role model
4. Overall professional success: A professional success
1
2
3 4 5
A professional failure (reverse-coded)
5. Overall effectiveness as a leader: Ineffective leader
1
2
3 4 5
Effective leader
1
2
3 4 5
Pursues large, quantum
6. Conceiving change efforts: Pursues small, incremental changes changes
7. Leading change: Leads in bold, new directions
1 2 3 4 5
Pursues the status quo (reverse-coded)
1 2 3 4 5
Has little impact (reverse-coded)
8. Having impact: Is responsible for profound changes
125
Texas Tech University, Sara Dodd, December 2009
Appendix F Demographic and Work Environment Questions Demographic: Gender Age Academic background
(What year were you born?) (fill-in-the-blank, then postcoded)
Work Environment: Extension position
(Select from county extension agent-Ag., county extension-agent-FCS, county extension agent4H/Youth, county program/subject specialist, district program/subject specialist, program/subject specialist (urban), program/subject specialist (state), county director, district administrator, associate director, executive director, other)
Primary supervisor’s position
(Same options as for Extension position)
Years employed by Extension
(less than 1 year, 1-5 years, 6-10 years, 11-15 years, 16-20 years, 21 years or more)
Tenure in current position
(less than 1 year, 1-5 years, 6-10 years, 11-15 years, 16-20 years, 21 years or more)
Number of individuals to whom you report
(less than 1 year, 1-3 years, 4-6 years, 7-9 years, 10 years or more)
Number of individuals who report to you
(none, 1-5, 6-10, 11 or more)
Previous work experience o Best descriptor of previous position (management, sales, professional practice, technical, R&D, other) o Type of organization (public service/non profit, health care, technology, industrial/mfg, business services/financial, consumer goods and services, other) o Tenure in this position (blank provided)
126
Texas Tech University, Sara Dodd, December 2009
Appendix G IRB Proposal (see next page)
127
Texas Tech University, Sara Dodd, December 2009
128
Texas Tech University, Sara Dodd, December 2009
BEHAVIORAL COMPLEXITY AND EFFECTIVENESS AMONG COOPERATIVE EXTENSION PROFESSIONALS: A TEST OF THE LEADERPLEX MODEL Proposal for Research Using Human Subjects
Faculty Principal Investigator:
Karen Alexander, Ph.D.
Co-Principal Investigator:
Sara L. Dodd, Doctoral Candidate
June 7, 2008
129
Texas Tech University, Sara Dodd, December 2009
BEHAVIORAL COMPLEXITY AND EFFECTIVENESS AMONG COOPERATIVE EXTENSION PROFESSIONALS: A TEST OF THE LEADERPLEX MODEL Proposal for Research Using Human Subjects
I. RATIONALE The purpose of this study is to add to the body of knowledge about behavioral complexity in leaders. Specifically, the Leaderplex model (Hooijberg, Hunt, and Dodge, 1997) will be utilized to study groups of leaders from multiple levels of an organizational entity. Hooijberg et al. introduced Leaderplex at a time when researchers’ interest in measuring individual differences between managerial leaders began to shift to a deeper exploration of the complexity revealed by studying those differences. Scholars increasingly recognized that cognitive complexity was a necessary but not sufficient condition to explain leader effectiveness, and thus other sources of complexity began to emerge in the literature; for example, social and/or emotional intelligence, affective complexity, behavioral complexity and so on. No one, however, has undertaken an empirical test of what Hooijberg et al. were the first to suggest: Behavioral complexity is antecedent/correlated to leader effectiveness, while cognitive and social complexity are antecedent/correlated to behavioral complexity. However, it is the simultaneous interaction of these three sources/types of complexity that has the most positive influence upon the ability of an individual to lead others effectively. The model, design, and sampling strategies planned for this study further offer a valuable opportunity to explore managerial leader behavior and organizational culture within a large public service/education institution. The institution in question, the Cooperative Extension Service, operates within a dynamic context – adjusting to a changing client base and fluid demographics as well as generational changes among its professional staff and paradigm shifts in higher education (McDowell, 2001). Extension provides a particularly apt sample for a test of behavioral complexity in leaders because of the inherently complex environment in which it historically has functioned and continues to function. The information which the proposed research will produce has the potential to offer Extension decision-makers timely and relevant information as they adapt to the evolving academic and client communities of the 21st century.
130
Texas Tech University, Sara Dodd, December 2009
II. SUBJECTS (a) Specific population Professionals working with the Cooperative Extension Service in multiple states will be recruited for participation in this study. The sample will include county Extension agents and specialists, county and district administrators, regional program directors, urban program directors, state level program directors and subject specialists, as well as associate directors (senior state administrative levels). Cooperative Extension Services in several states in the Midwest, Southwest, Pacific Northwest, and East Coast regions of the United States will be invited to participate, providing useful geographic and demographic variation in the sample. (b) Recruitment method Extension professionals will be invited to participate through electronic mail at their employing institutions (land grant universities). Obtaining access to institutional e-mail addresses will not be necessary because the e-mail invitations to participate will be co-signed or forwarded by senior Extension administrators (e.g., Directors or Executive Directors), who have the authority to send blanket emails through the internal servers at each institution. The email invitation is itself public record because the land grant universities that host Extension are state-supported institutions. The internal email method of recruitment has been utilized successfully by the co-P.I. with another study whose sample included Extension employees. Decision-makers with the state Extension organizations that have been identified for sampling in this study have existing collaborative relationships with either the faculty P.I., the co-P.I., or members of the co-P.I.’s dissertation committee. The text of the e-mail advises and assures recipients of their rights as human subjects with regard to confidentiality, anonymity, and voluntary participation. Participants explicitly are told they have the option to skip any questions they do not want to answer and that they may withdraw from the survey at any time. Further assurances will be given that participation in the survey is in no way tied to conditions of employment or work responsibilities. In other words, there is no penalty to employees if they choose not to participate in the survey. The e-mail will include a hyperlink to the survey, with an explicit 131
Texas Tech University, Sara Dodd, December 2009
assurance that the IP address of any computer used to complete the survey will not be tracked or stored. See Appendix A for text of e-mail invitation.
III. PROCEDURES The online survey will be developed using Survey Monkey. It will be administered through a secure server at Texas Tech University; IP addresses of computers used to complete the survey will not be tracked or stored by the researchers. Instruments in the survey will include three previously validated construct measures (one each for cognitive, social, and behavioral complexity), one previously validated and extensively used leader effectiveness measure, and questions about demographics and previous work experience (Driver, Brousseau, & Hunsaker, 1990; Kang & Shaver, 2004; Lawrence, Quinn, & Lenk, in press). When respondents enter the survey web site, they will read a brief statement explaining the purpose of the study and how the survey may be navigated. The confidential, anonymous, and voluntary nature of the study will be reiterated, and instructions will be provided on how to exit the survey at any time the participant chooses. This introductory page of the survey will also provide participants with contact information for the principal investigator and co-principal investigator. A copy of the online survey is attached (Appendix B). It includes an introduction, sections for each construct being measured (see above), and sections for ratings of overall leader effectiveness, questions about previous work experience and general demographic information. The last page of the survey provides contact information for participants who are interested in obtaining the results of the study. The survey will be piloted with a sample drawn from one district office located near Texas Tech University. If indicated by the results of the pilot study, modifications to the instruments in the survey will be resubmitted for IRB approval before data is collected from a larger sample.
IV. ADVERSE EVENTS AND LIABILITY Because the research involves less than minimum risk to participants, no specific liability plan is offered.
V. CONSENT FORM
132
Texas Tech University, Sara Dodd, December 2009
Because the research involves less than minimum risk to participants, no consent form is attached.
ATTACHMENTS: Appendix A
E-mail text for participant recruitment
Appendix B
Print version of online survey
REFERENCES: Driver, M.J., Brousseau, K.R., & Hunsaker, P.L. (1990). The dynamic decision maker: Five decision styles for executive and business success. New York: Harper & Row. Hooijberg, R., Hunt, J.G., & Dodge, G.E. (1997). Leadership complexity and development of the leaderplex model. Journal of Management, 23, 375-408. Kang, S.M., & Shaver, P.R. (2004). Individual differences in emotional complexity: Their psychological implications. Journal of Personality, 72, 687-725. Lawrence, K.A., Quinn, R.E., & Lenk, P. (in press). Behavioral complexity in leadership: The psychometric properties of a new instrument to measure behavioral repertoire. Leadership Quarterly. McDowell, G.R. (2001). Land-Grant Universities and Extension into the 21st Century: Renegotiating or Abandoning a Social Contract. Ames, IA: Iowa State University Press.
133
Texas Tech University, Sara Dodd, December 2009
Appendix A
Memo to:
Extension professional
From:
Director’s name Name of state
Subject:
Cooperative Extension
Important research opportunity
Name of state Cooperative Extension has been asked to participate in an academic survey of leadership behaviors among Extension professionals. This research has the potential to provide Extension with valuable information about the effectiveness of our organization and its leadership processes. If you would like to participate, please use the link below to navigate to the online version of the survey. The IP addresses of computers used to complete the survey will not be tracked or stored. Responses will be aggregated (that is, individual respondents cannot be identified by their answers). Your completion of the survey is completely voluntary and your job duties and/or performance are in no way impacted should you choose not to participate. You are free to leave blank any questions you do not want to answer, and you may exit the survey at any time. Completing the survey should take approximately 15-20 minutes. Should you choose to participate in this survey, your participation is anonymous – we are not asking for names and cannot link survey responses with individuals. This research has been approved by the Texas Tech University Institutional Review Board for the Protection of Human Subjects, Protocol # 501397. If you have questions about your rights as a participant, you may contact the Office of Research Services at Texas Tech University, Lubbock, Texas 79409. If you have any questions about this study, please contact Dr. Karen Alexander (Principal Investigator),
[email protected], or Sara Dodd (co-PI),
[email protected], Texas Tech University, P.O. Box 41210, Lubbock, TX 79409-1210 or, (806) 742-3000, Ext. 229. Click on the link below to enter the survey: https://www.surveymonkey.com/s.aspx?sm=j9syTODCTIvBT1vWaB2eng_3d_3d
134
Texas Tech University, Sara Dodd, December 2009
135
Texas Tech University, Sara Dodd, December 2009
Appendix B Copy of the online survey begins on next page.
136
Texas Tech University, Sara Dodd, December 2009
137
Texas Tech University, Sara Dodd, December 2009
138
Texas Tech University, Sara Dodd, December 2009
139
Texas Tech University, Sara Dodd, December 2009
140
Texas Tech University, Sara Dodd, December 2009
141
Texas Tech University, Sara Dodd, December 2009
142
Texas Tech University, Sara Dodd, December 2009
143
Texas Tech University, Sara Dodd, December 2009
144
Texas Tech University, Sara Dodd, December 2009
145
Texas Tech University, Sara Dodd, December 2009
146
Texas Tech University, Sara Dodd, December 2009
147
Texas Tech University, Sara Dodd, December 2009
148
Texas Tech University, Sara Dodd, December 2009
149