If benchmarking is carried out using best-in-class companies, these goals are likely to be stretch ... learning from the point of view of the host in a benchmarking.
IJOPM 17,10
1046
Benchmarking and operational performance: some empirical results Christopher A. Voss, Pär Åhlström and Kate Blackmon London Business School, London, UK
International Journal of Operations & Production Management, Vol. 17 No. 10, 1997, pp. 1046-1058. © MCB University Press, 0144-3577
Introduction In order to understand what practices are necessary to reach world class standards, many organizations have begun to use benchmarking as a way of acquiring knowledge. Benchmarking can be defined as the search for industry best practices that lead to superior performance (Camp, 1989). Pioneered by Xerox, benchmarking has been widely adopted by companies as an improvement initiative (Port and Smith, 1992). At the core of successful benchmarking lies a regular and documented worldwide scan for organizations that are skilled at what they do, regardless of industry (Garvin, 1991). These organizations are then visited with the aim of gaining a better understanding of their processes and ways of working. These findings are used to stretch the imagination and develop new goals, as well as finding new ways of operating. Thus, benchmarking is both a means by which new practices are discovered and understood, as well as a goal setting process (Camp, 1989). As “a process for measuring your performance against best-in-class companies, then using the analysis to meet and surpass the best-in-class companies” (Pryor and Katz, 1993, p. 7), benchmarking is one way of identifying and understanding the practices needed to reach new goals. By identifying how superior companies organize their processes, a company can seek to adopt and adapt these practices. Benchmarking can also be used as a goal-setting process, an aid in setting performance objectives to achieve performance improvements (Venetucci, 1992). If benchmarking is carried out using best-in-class companies, these goals are likely to be stretch goals, which are important for performance improvements and learning (Roth et al., 1994). Benchmarking can be an effective tool for planning and implementing change processes that lead to organizational improvement when the knowledge gained is converted into a detailed action plan to improve competitive advantage (Pryor and Katz, 1993). The inclusion of benchmarking in the Baldrige Quality Award reflects its popularity (Hackman and Wageman, 1995). This is also reflected in the management literature (see for example Sweeney, 1994; Vaziri, 1992; Venetucci, 1992), which mainly focuses on:
•
how to go about benchmarking;
•
what to benchmark (Partovi, 1994); and
•
learning from the point of view of the host in a benchmarking undertaking (Langowitz and Rao, 1995).
Existing research on the links between operational performance and benchmarking has relied mainly on anecdotal evidence for the benefits of benchmarking and has taken the link between benchmarking and performance as self-evident. This article sets out to address this gap in knowledge by testing whether there is a relationship between benchmarking and performance. The main questions investigated in doing so are: •
To what extent have firms adopted benchmarking?
•
Does benchmarking lead to higher performance?
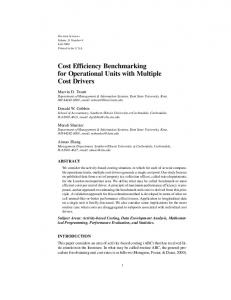
Apart from treating the link between benchmarking and performance as given, research on the mechanisms through which benchmarking (supposedly) leads to increased performance is lacking. Therefore, a second aim of this article is to identify possible mechanisms through which benchmarking may lead to increased performance. We propose that benchmarking promotes performance directly through identification of practices and performance goals. Furthermore, benchmarking increases a firm’s understanding of its position relative to competitors, which is beneficial for performance. Finally, we argue that benchmarking is a part of a learning organization, which has links to increased performance. This article begins by examining empirical evidence about the extent to which a large sample of European manufacturers have adopted benchmarking, using data collected from structured interviews with over 600 managers in the UK, Germany, The Netherlands, and Finland. It next looks at whether benchmarking has led to improved operational performance in this sample. The mechanisms by which benchmarking is linked to higher performance are then examined, as well as factors associated with higher levels of use of benchmarking. Research methodology The data used in this article were taken from “Made in Europe”, a study of operational practice and performance in European manufacturing companies conducted between 1993 and 1994. This study focused on the relationship between operations practice and performance (Voss and Hanson, 1993). The model underlying the study is that companies’ competitive capabilities are based on six critical areas of manufacturing – organization and culture, logistics, manufacturing systems, lean production, concurrent engineering, and quality. Data were collected on each company’s adoption of best practice and performance in each of these crucial areas (see Figure 1).
Benchmarking and operational performance 1047
IJOPM 17,10
1048
The central hypothesis of the study was that the adoption of best practice has a direct link to the attainment of high operational performance, which in turn leads to superior business performance and competitiveness: • Practice refers to the established processes which an organization has put in place to improve the way it runs its business, ranging from organizational aspects such as teamwork and employee involvement to the use of techniques such as kanban. • Operational performance refers to the measurable aspects of the outcomes of an organization’s processes, such as reliability, production cycle time, and inventory turns. Operational performance in turn affects business performance measures such as market share and customer satisfaction. Total quality Concurrent engineering
Figure 1. The world class manufacturing model (adapted from Voss and Hanson (1993))
Lean production Manufacturing systems
Business performance
Logistics Organization and culture
A structured interview technique was used to gather the data in a sample of 660 European plant sites. A plant was defined as a self-contained unit, with its own personnel, facilities, products and management structure. The sample is described in more detail in Voss et al. (1995). Copies of the interview guide were pre-mailed to the research co-ordinator, who formed a multifunctional team spanning several organizational layers to prepare responses. The teams were typically co-ordinated by the plant manager or the head of a functional area such as manufacturing or quality. The aim of this stage of the process was to achieve a consensus between the various participants in the team on the organization’s practice and performance. The plant was then visited by a trained facilitator, who met with management and the team on site, to review with them the assessment of the plant’s practices and performance. The site visit also included a plant tour. The process was focused on achieving a convergence between the team’s scores and the facilitators’ impressions. Feedback to each plant included a report comparing its performance to other plants in its industry and to the sample as a whole. Practices and performance questions were asked in each of the six areas outlined in Figure 1, plus business performance. For each item, respondents
were asked to position their manufacturing site on a 1 to 5 scale, with three descriptive anchor points explicitly defined for each item: 1 = basic level of practice or performance; 3 = average levels; and 5 = good practice or performance. Use of benchmarking by companies Respondents were asked to indicate the extent to which the manufacturing site used benchmarking, using a 1 to 5 scale (see Figure 2). Table I indicates the percentage of respondents at each point on the benchmarking scale. Most sites (88 per cent) were participating in some benchmarking; however, few (7 per cent) were using it at best practice level, and the majority of sites (39 per cent) had attained only average levels. 1
2
None
Number Percentage
3
4
2
78 12
128 19
1049
5
Benchmarks within own Regular, documented organization or group benchmarks against competition and world class standards beyond company’s industry
1
Benchmarking and operational performance
Figure 2. Use of benchmarking by companies
Benchmarking use 3 4
5
Total
256 39
46 7
660 100
152 23
Table I. Benchmarking practice levels
Increased levels of benchmarking were associated with higher levels of both practice and performance (See Table II). Overall practice was computed as the total of all manufacturing practices measured, and overall performance as the total of all performance measures. Both practice and performance averages increased markedly at higher levels of benchmarking. To facilitate an initial comparison between high and low performers, we defined a high performing group – the leaders – as the top 10 per cent and the low performing group – the laggers – as the bottom 10 per cent of sites in terms of aggregate practice and performance. The leaders had nearly twice the score of the laggers in benchmarking usage (see Table III).
1-2 Overall practice Overall performance
2.91 2.98
Benchmarking use 3 4-5 3.23 3.22
3.54 3.42
Total 3.22 3.21
Table II. Overall practices and performance at different levels of benchmarking
IJOPM 17,10
1050
Linking benchmarking and performance The high usage of benchmarking by successful sites leads to the proposition that benchmarking is associated with superior performance. To test whether there is a link between the use of benchmarking and performance, we constructed two indexes of performance: operational performance and business performance. Details of scale construction and statistical methodology are presented in the Appendix. Benchmarking use
Table III. Leaders vs laggers
Leaders (top 10 per cent of the sample) Laggers (bottom 10 per cent of the sample) Average
3.80 2.06 2.94
Operational performance is an index constructed by summing 17 questionnaire items measuring performance in quality, productivity, and cycle time. Indicators of good performance included: • process variance less than product design tolerance; low product failure rates in service; low warranty claims costs; low defect rates; and low scrap, rework, and recycling costs; • 25-50 per cent of production cycle time devoted to performing valueadded work on materials; processing orders in hours, rather than days, with minimum expediting; the ability to perform equipment changeovers in minutes, rather than days; • high inventory turns; the ability to deliver products faster than competitors without holding finished goods inventory; consistently meeting 95 per cent or better customer delivery commitments; • new products delivered to market faster than competitors’, with high initial yields. Business performance is an index constructed from the six items that measured the site’s ability to deliver value to customers, including: • high levels of customer satisfaction; • an increasing market share; • positive cash flow; • return on assets better than competitors’; • low product costs; • high productivity growth. In order to test whether benchmarking has a significant effect on operational performance and business performance, ordinary least squares (OLS) regression was used to test the following hypotheses:
H1: Operational performance is positively related to benchmarking. H2: Business performance is positively related to benchmarking. The results of the tests are shown in Table IV. As can be seen from Table IV, the use of benchmarking is significantly related to both operational and business performance. This result supports the assertions on the benefits of benchmarking made in the literature. However, the causality of this relationship is not clear from these tests. Whether benchmarking leads to better performance, or whether better performing companies use benchmarking more, is an unanswered question.
Dependent variable
Operational performance Coefficient p (t-test)
Business performance Coefficient p (t-test)
Constant Benchmarking use Goodness of fit
2.750 0.000 0.155 0.000 R2 = 0.112, p = 0.000
3.095 0.000 0.122 0.000 R2 = 0.052, p = 0.000
Benchmarking and operational performance 1051
Table IV. Benchmarking and two measures of performance – regression results
The mechanism of benchmarking In the above section we have put forward evidence that benchmarking is associated with performance at the site level. The next step is to consider the mechanisms that may lie behind its effectiveness. We will examine two areas, and use the study data to test propositions concerning each. Benchmarking and understanding It can be argued that one mechanism through which benchmarking leads to improved performance is through helping a company gain an understanding of its strengths and weaknesses in both its processes and its performance. Understanding will lead in turn to focused and effective improvement activities. We therefore set out to test the relationship between benchmarking and understanding. To develop a measure of understanding, we compared respondents’ views of their competitiveness with their competitive capability as measured in the study. Study participants were asked: “To what extent do you consider your site able to compete with the best of your competitors elsewhere in the world?” The results of this question are displayed in Table V. From the Table we see that two-thirds of respondents (68 per cent) thought that they were completely
Frequency Percentage of responses
Completely
Mostly
Partially
Not at all
Total
117 18
329 50
208 32
6 1
660 100
Table V. Ability to compete with best competitors anywhere in the world
IJOPM 17,10
1052
or mostly competitive with their best competitors, while only one-third (33 per cent) thought that they were only partially or not at all competitive. Clearly, not all competitors within an industry can measure up to best practice standards. Managers’ self-opinions, in the absence of evidence to the contrary, seem to be biased towards over-estimating their sites’ competitiveness. We can postulate that companies that do not use benchmarking are likely to be over-optimistic about their position relative to competitors. The value of benchmarking is that the data help companies make a realistic assessment of their capabilities. This in turn provides a greater incentive and focus for improvement. To investigate the existence of an indirect link between benchmarking and operational performance, we constructed the Optimism Index, which indicates the extent to which the manufacturing site is realistic in its assessment of its own position, strengths, and weaknesses vis-à-vis competitors. The site’s selfassessment was measured using the self-opinion item described above. The optimism index compares “Ability to compete successfully”, which reflects the manager’s opinion of the company’s position, strengths, and weaknesses relative to competitors, with the actual measure of operational performance. Three positions were defined: • If managers’ opinion of how well the company performs is greater than actual performance, they are optimistic. • If managers’ opinion of how well the company performs is equal to actual performance, they are realistic. • If managers’ opinion of how well the company performs is lower than actual performance, they are pessimistic. We would expect that companies that benchmark are likely to be less optimistic in their assessment of their own capabilities than companies that do not make competitive comparisons. Over-optimism from lack of information, on the other hand, leads to complacency, and can be taken as an indicator of lack of understanding. This leads to the hypothesis: H3: Over-optimism is negatively related to benchmarking. Furthermore, realistic companies will focus their improvement agendas on real needs, while companies that do not use benchmarking are likely to be overoptimistic about their position relative to competitors, and may choose agendas that are not related to real internal and external needs. Thus, the higher the degree of understanding of its competitive positioning, the more likely a company is to use the increased knowledge gained through benchmarking appropriately. This leads to the hypothesis: H4: Over-optimism is negatively related to operational performance. The two hypotheses were statistically tested using ordinary least squares (OLS) regression analysis. The results are shown in Tables VI and VII below.
As the results in Tables VI and VII indicate, there is a moderately strong relationship between benchmarking and understanding, as well as between understanding and operational performance. Both relationships were significant at the p = 0.05 level and were in the expected direction. However, particularly the percentage variance in understanding that was explained by benchmarking was low. This indicates that there are many other factors that affect the respondents’ understanding of their own competitive positioning, which is to be expected. The important finding in view of the purpose of this study is that the effect of benchmarking was found to be significant.
Dependent variable
Understanding Coefficient p (t-test)
Constant Benchmarking use Goodness of fit
–0.508 0.000 –0.070 0.026 R2 = 0.006, p = 0.026
Dependent variable
Operational performance Coefficient p (t-test)
Constant Benchmarking use Goodness of fit
–3.246 0.000 –0.132 0.000 R2 = 0.052, p = 0.000
Benchmarking and organizational learning As well as understanding the company’s competitive positioning vis-à-vis its competitors, benchmarking may also be linked to broader concepts of organizational learning, specifically the “learning organization” (Senge, 1990). The learning organization, the subject of considerable recent attention in the management literature, argues that learning is necessary for a company to survive in the increasingly turbulent competitive environment. Along these lines, the concept of “the knowledge factory” has been proposed as – “an accelerated learning organization driven by dynamic processes that create superior knowledge and translate that knowledge into competitive capabilities and core competencies” (Roth et al., 1994). “The knowledge factory” has been used to describe a learning organization in which knowledge, as opposed to capital, is the limiting factor of production (Roth et al., 1994), and the strategy for acquiring knowledge – how the organization will adapt to and exploit knowledge from its environment is key (Roth and Marucheck, 1994). This definition contains two important elements. “Strategy to acquire knowledge” concerns how the organization will adapt to and exploit knowledge
Benchmarking and operational performance 1053
Table VI. Benchmarking vs understanding
Table VII. Understanding vs operational performance
IJOPM 17,10
1054
from its environment. Benchmarking can be seen as a strategy for knowledge acquisition, a relationship that has been previously suggested by Garvin (1993), who cites “learning from others through benchmarking” as a building block in his vision of the learning organization. “Predisposition for organizational learning” indicates the capabilities that can be identified and leveraged within the organization to bolster learning. It is described as organizational awareness that a portfolio of learning opportunities exists (Roth and Marucheck, 1994). Without at least some prior related knowledge, firms are not likely to benefit from benchmarking. This concurs with the finding reported by Port (1992): benchmarking will not improve performance unless a company already has a comprehensive quality programme. Based on this argument, we predict a positive relationship between what we choose to term “an organization’s predisposition for learning” and benchmarking. This relationship is based on our proposition that benchmarking is a vital part of the learning company’s repertoire for performance improvements. To test this prediction, we developed an index termed “learning orientation” for measuring an organization’s predisposition for learning by summing scores from five questionnaire items: vision, shared vision, mission and goals; quality vision, management style; and employee involvement. Central to the learning organization is a corporate-wide initiative to move the employees in a unified direction (Roth and Marucheck, 1994). Evidence of a best practice learning orientation included: • leadership by management; • extensive cross-functional communication, with management vision communicated to individuals and departments; • written mission statement and published improvement plans; • relatively flat organizational structure; • key manufacturing goals of leadership in quality, service and product cycle time, rather than cost reduction; • a high level of employee involvement; participation, empowerment and teamwork; • an emphasis on total quality management, including zero defects, quality control in process, design for manufacturability, and quality as everyone’s job. The items in the index together reflect this initiative to guide the actions and learning of employees. Management style and employee involvement reflect the usage of what Senge (1990) terms “team learning”, one of the five disciplines of the learning organization, where employees at all levels are involved in the learning process and allowed to learn. The organization must open its
boundaries to ensure a fresh flow of ideas and the chance to consider competing perspectives (Garvin, 1993). The relationship between learning orientation and benchmarking was tested using ordinary least squares (OLS) regression. The following hypothesis was tested and the results are shown in Table VIII: H5: Learning orientation is positively related to benchmarking.
Benchmarking and operational performance 1055
The results show a strong association between benchmarking and the organization’s learning orientation. The percentage variance explained is satisfactory and the correlation is significant at the p = 0.000 level. This supports the notion that companies that are oriented towards learning are likely to use benchmarking more. Benchmarking can, in this light, be seen as an excellent way of learning from the external environment.
Dependent variable
Benchmarking use Coefficient p (t-test)
Constant Learning orientation Goodness of fit
0.668 0.004 0.670 0.000 R2 = 0.133, p = 0.000
Discussion This study clearly points to a link between benchmarking and performance, which has been proposed in the literature but not previously empirically tested with a large sample. The results of the regression analysis show that the use of benchmarking is linked strongly to both improved operational performance and business performance. This result supports the assertions on the benefits of benchmarking made in the managerial literature. Besides this more direct relationship between benchmarking and performance, an indirect link between benchmarking and performance has been demonstrated. Benchmarking has been shown to increase understanding about where a unit is positioned relative to its competitor, which leads to a number of benefits: • Companies who over-estimate their competitiveness (viewing themselves through rose-coloured spectacles) may become complacent, and thus delay adopting improvement programmes and be overtaken by competitors. • Companies who are realistic, however, will increase their chances of identifying the areas in which improvement will have the most competitive leverage, and thus be able to compete on a more level playing-field. It can be argued that companies who underestimate their competitiveness may become stuck in a vicious cycle of failing to improve and falling further behind;
Table VIII. Benchmarking vs learning orientation
IJOPM 17,10
1056
or panicking and adopting any or every programme in an attempt to catch up and ending up in another vicious cycle. Finally, learning orientation has been linked to benchmarking. This supports both the “knowledge factory” concept, which has been proposed to be important in the manufacturing context (Roth and Marucheck, 1994; Roth et al., 1994), and the overall concept of the “learning organization” (Senge, 1990). Based on these arguments and on the results of the data analysis, we now propose a relationship between learning, benchmarking, understanding and performance, summarized in the research model (Figure 3): •
• • •
Benchmarking is a vital part of the learning company’s repertoire for performance improvements and learning organizations will be more likely to use benchmarking. Benchmarking promotes higher performance directly through helping a company to identify practices and set challenging performance goals. Benchmarking increases a company’s understanding of its strengths and weaknesses relative to competitors. This understanding in turn benefits performance, since improvement agendas will be focused on real needs. Learning orientation
Benchmarking
Understanding
Manufacturing performance Figure 3. The research model
Business performance
Conclusions This study contributes to operations management by integrating theory and empirical data to investigate whether benchmarking, as an organizational learning tool, leads to improved performance. This is important because few studies have to date tested the links between best practices and performance. Three mechanisms by which benchmarking leads to improved operational and business performance were proposed and tested. Benchmarking describes a set of empirical practices that have been diffused through the practitioner community as part of a broader set of “best practices”, including total quality management (TQM), just-in-time (JIT) and many others. In common with other such practices, researchers have initially focused on
describing the content of these practices and the extent to which they have been adopted, without fully comprehending how they fit into the broader theoretical context of manufacturing strategy, or considering the way that they contribute to performance. In many cases, the links between “best practices” and improved performance are assumed to be self-evident. Without demonstrable positive links to improved performance, however, improvement initiatives such as benchmarking may be classed by managers as just more “fads” or “buzzwords”, the proliferation of which have led to initiative “burnout” in many cases. Disseminating information on best practices is one of the key tasks of management research, but it is not sufficient to offer prescriptions based on small samples or vague generalities. Operations management in particular must set, as one of its research goals, the testing of whether such initiatives are indeed linked to improved performance, and what mechanisms come into play. References Camp, R.C. (1989), Benchmarking: The Search for Industry Best Practices that Lead to Superior Performance, ASQC Quality Press, Milwaukee, WI. Garvin, D.A. (1991), “How the Baldrige Award really works”, Harvard Business Review, November-December, pp. 80-93. Garvin, D.A. (1993), “Building a learning organization”, Harvard Business Review, July-August, pp. 78-91. Hackman, J.R. and Wageman, R. (1995), “Total quality management: empirical, conceptual, and practical issues”, Administrative Science Quarterly, Vol. 40 No. 2, pp. 309-42. Langowitz, N.S. and Rao, A. (1995), “Effective benchmarking: learning from the host’s viewpoint”, Benchmarking for Quality Management & Technology, Vol. 2 No. 2, pp. 55-63. Partovi, F.Y. (1994), “Determining what to benchmark: an analytic hierarchy process approach”, International Journal of Operations & Production Management, Vol. 14 No. 6, pp. 25-39. Port, O. (1992), “Quality”, Business Week, 30 November, pp. 66-72. Port, O. and Smith, G. (1992), “Beg, borrow – and benchmark”, Business Week, 30 November, pp. 74-5. Pryor, L.S. and Katz, S.J. (1993), “How benchmarking goes wrong (and how to do it right)”, Planning Review, Vol. 21 No. 1, pp. 6-11. Roth, A.V. and Marucheck, A. (1994), “The knowledge factory: paradigm for accelerated learning”, University of North Carolina, Working Paper, Kenan-Flagler Business School, Chapel Hill, NC. Roth, A.V., Marucheck, A.S., Kemp, A. and Trimble, D. (1994), “The knowledge factory for accelerated learning practices”, Planning Review, Vol. 22 No. 3, pp. 26-46. Senge, P.M. (1990), The Fifth Discipline: The Art and Practice of the Learning Organization, Century Business, London. Sweeney, M.T. (1994), “Benchmarking for strategic manufacturing management”, International Journal of Operations & Production Management, Vol. 14 No. 9, pp. 4-15. Vaziri, H.K. (1992), “Using competitive benchmarking to set goals”, Quality Progress, October, pp. 81-5. Venetucci, R. (1992), “Benchmarking: a reality check for strategy and performance objectives”, Production and Inventory Management Journal, Vol. 33 No. 4, pp. 32-6.
Benchmarking and operational performance 1057
IJOPM 17,10
1058
Voss, C. and Hanson, P. (1993), Made in Britain: The True State of Britain’s Manufacturing Industry, IBM United Kingdom Limited/London Business School, London. Voss, C., Blackmon, K., Hanson, P. and Oak, B. (1995), “The competitiveness of European manufacturing – a four country study”, Business Strategy Review, Vol. 6 No. 1, pp. 1-25. Appendix: Details of statistical methodology This appendix contains information and details on the measures that were used in the study. The means, standard deviations, and Pearson product-moment correlations for each of the four variables that were utilized are shown in Table AI. Construct reliability of each of the multi-item indices was examined by calculating Cronbach’s alpha for learning orientation, manufacturing performance, and business performance), as shown in Table AII. The minimum cut-off point of at least 0.70 was met by each of these scales. Construct validity was examined using factor analysis with varimax rotation. The regression equations were calculated using the multiple regression routine of the computer program SPSS‚ using standard ordinary least squares (OLS) procedures.
Variable
Table AI. Descriptive statistics
Table AII. Construct reliability and validity
n
Mean
Benchmarking X1 Understanding X2 Learning orientation X3 Operational performance Y1 Business performance Y2
660 660 660 660 660
2.939 0.304 3.392 3.185 3.452
Variable
n
Items
Cronbach’s alpha
660 660 660 660 660
1 1 5 17 6
– – 0.706 0.807 0.708
Benchmarking Understanding Learning orientation Operational performance Business performance
Key
SD
X1
X2
1.083 1.000 0.871 –0.087 1.000 0.593 0.366 0.037 0.429 0.336 –0.231 0.568 0.232 0.107
X3
Y1
Y2
1.000 0.496 0.361
1.000 0.499
1.000