Benchmarking Data Curation Systems. Patricia C. Arocena. â. University of Toronto. Boris Glavic. Illinois Institute of Technology. Giansalvatore Mecca.
Benchmarking Data Curation Systems Patricia C. Arocena∗ University of Toronto Ren´ee J. Miller∗ University of Toronto
Boris Glavic Illinois Institute of Technology Paolo Papotti Arizona State University
Giansalvatore Mecca University of Basilicata Donatello Santoro University of Basilicata
Abstract Data curation includes the many tasks needed to ensure data maintains its value over time. Given the maturity of many data curation tasks, including data transformation and data cleaning, it is surprising that rigorous empirical evaluations of research ideas are so scarce. In this work, we argue that thorough evaluation of data curation systems imposes several major obstacles that need to be overcome. First, we consider the outputs generated by a data curation system (for example, an integrated or cleaned database or a set of constraints produced by a schema discovery system). To compare the results of different systems, measures of output quality should be agreed upon by the community and, since such measures can be quite complex, publicly available implementations of these measures should be developed, shared, and optimized. Second, we consider the inputs to the data curation system. New techniques are needed to generate and control the metadata and data that are the input to curation systems. For a thorough evaluation, it must be possible to control (and systematically vary) input characteristics such as the number of errors in data cleaning or the complexity of a schema mapping in data transformation. Finally, we consider benchmarks. Data and metadata generators must support the creation of reasonable goldstandard outputs for different curation tasks and must promote productivity by enabling the creation of a large number of inputs with little manual effort. In this work, we overview some recent advances in addressing these important obstacles. We argue that evaluation of curation systems is itself a fascinating and important research area and challenges the curation community to tackle some of the remaining open research problems.
1
Introduction
A curated database is a valuable asset that has been created and maintained with a great deal of human effort [13]. The term data curation has been used as an umbrella term to encompass the activities required to maintain and add value to data over its lifetime, and more specifically the tools and algorithms that attempt to reduce human curation effort by automating some of these important activities. Some data curation tasks that have received significant attention in the database literature include data cleaning (identifying and repairing errors in data), entity resolution (identifying and resolving duplicates in data), data transformation (exchanging or translating Copyright 2016 IEEE. Personal use of this material is permitted. However, permission to reprint/republish this material for advertising or promotional purposes or for creating new collective works for resale or redistribution to servers or lists, or to reuse any copyrighted component of this work in other works must be obtained from the IEEE. Bulletin of the IEEE Computer Society Technical Committee on Data Engineering ∗
Supported by NSERC
47
data), data integration (including data federation), data provenance (understanding the origin of data), metadata or schema discovery, data and metadata profiling (including statistical profiling of data and data usage), and data archiving. Some of these tasks, such as data profiling [1], are also important to operational data management, for example, statistical profiles can be used to improve query performance. In this paper, we focus on the use of these tasks to curate data by improving the value or quality of information. In contrast to basic data management problems like query or transaction processing, data curation has not benefitted from the availability of commonly accepted benchmarks which can be used to compare systems, resolve discrepancies, and advance the field. As a result, evaluation and comparison of systems have relied on a few real data and metadata scenarios (for example, the Illinois Semantic Integration Archive1 , the Sherlock@UCI2 data cleaning and entity resolution data sets or the more recent annealling standard [30]). Large scale sharing of real scenarios is simply not feasible due to the inherent value and proprietary nature of many data resources. And importantly, real scenarios do not provide control over many of the input characteristics that may impact the performance or efficacy of a system. As a result, researchers rely on ad hoc scenario generators with knobs to control a few selected data or metadata characteristics. At first sight it may be surprising that evaluations of data curation tasks are not up to par with evaluations of query performance in database management systems. However, as we will explain in the following, the different nature of data curation problems imposes unique challenges for evaluations which are not faced when evaluating query performance. From a high-level view, any empirical evaluation of an algorithm roughly follows this pattern: 1) identify relevant input parameters, reasonable values of these parameters, and output measures; 2) select an input parameter to be varied systematically; 3) vary the selected parameter while keeping all other parameters fixed; 4) run the system on input generated for each parameter value; and 5) evaluate the system output using a selected set of output measures. This process is necessarily iterative with the results of one iteration in the evaluation influencing the parameters considered in the next. The papers in this special issue of the IEEE Data Engineering Bulletin consider the problem of assessing or improving data quality, often this may be done in the context of a specific curation task. In contrast, in our work, we are seeking to understand the principles behind evaluating a specific curation system that seeks to improve data value or quality in a specific, quantifiable way. We consider the problem of assessing whether a system has achieved a specific goal of improving data quality or whether it has reduced the human effort needed to achieve a specific curation goal. To illustrate some of the challenges, in this paper we will concentrate on two specific data curation tasks: data exchange and constraint-based data repair.
1.1
Evaluating Data Exchange Systems
Data exchange systems take as input a pair of schemas (typically named source and target), an instance of the source schema, and a mapping specifying a relationship between the schemas [15]. They output a transformation of the source instance into a target instance that must satisfy the mapping. However, different systems may create target instances that differ, for example, on how much redundancy they contain [16] and the transformation code they produce may differ in performance [24]. Consider the simple example schemas in Figure 1 that are related by mappings m1 , m2 and m3 . Assume we want to compare two data exchange systems E1 and E2 . In this example, system E1 creates a target instance J1 and system E2 creates a target instance J2 . Both instances satisfy the mapping specification and in fact both are universal solutions [15]. To evaluate and compare these, we need to select an appropriate output measure. As with traditional data management problems, output measures may be performance-based, for example, the response time to perform data exchange. Unlike traditional data management, the accuracy of the system is also an important output measure. For data exchange, an output measure may compare the quality of two exchanged instances, as suggested by Alexe et al. [2]. This measure considers one output superior to another 1 2
http://pages.cs.wisc.edu/˜anhai/wisc-si-archive/ http://sherlock.ics.uci.edu/data.html
48
S OURCE I NSTANCE PStat t1 : t2 : t3 :
Name Giovinco Giovinco Pirlo
Season 2012-13 2014-15 2015-16
Team Juventus Toronto N.Y.City
G 3 23 0
Stdm t1 : t2 :
Team Toronto N.Y.City
Stadium BMO Field Yankee St.
JuveDB t1 : t2 :
Name Giovinco Pirlo
Season 2012-13 2014-15
M APPINGS m1 . PStat(name, seas, team, goals) → ∃N Player(name, seas, team, goals), Team(team, N) m2 . Stdm(team, stdm) → Team(team, stdm) m3 . JuveDB(name, seas) → ∃N Player(name, seas, ‘Juv.′ , N), Team(‘Juv.′ , ‘Juv.Stadium′ ) S OLUTION J1
Player t1 : t2 : t3 : t4 :
Name Giovinco Giovinco Pirlo Pirlo
Season 2012-13 2014-15 2015-16 2014-15
Team Juventus Toronto N.Y.City Juventus
Goals 3 23 0 N1
Team t1 : t2 : t3 :
Name Toronto N.Y.City Juventus
Stadium BMO Field Yankee St. Juventus St.
S OLUTION J2
Player t1 : t2 : t3 : t4 : t5 :
Name Giovinco Giovinco Pirlo Giovinco Pirlo
Season 2012-13 2014-15 2015-16 2012-13 2014-15
Team Juventus Toronto N.Y.City Juventus Juventus
Goals 3 23 0 N1 N2
Team t1 : t2 : t3 : t4 : t5 : t6 :
Name Juventus Toronto N.Y.City Toronto N.Y.City Juventus
Stadium N3 N4 N5 BMO Field Yankee St. Juventus St.
Figure 1: Example Data Exchange Scenario With Two Data Exchange Solutions if it contains less redundancy (in this example J1 would be preferred over J2 ). Alternatively, if we know what the expected output is, then we can measure the difference between an output produced by a system and the expected one, often referred to as a gold standard. For data exchange, the output measure typically involves comparing (potentially large) database instances and these measures can be complex [2, 25]. Since a systematic comparison involves many different input scenarios, we must have efficient (and shared) implementations of these measures. Of course, a real comparison of systems E1 and E2 must consider not just a few example scenarios, but should include sets of input scenarios that differ on specific input parameters. For data exchange, these input parameters might include the size of the schemas, the size of the mapping, or the complexity of the mappings and schemas. They could also include parameters that measure metadata quality, such as how normalized a schema is (for example, a fully normalized schema may guarantee minimal redundancy in the data [22]). Agreement on what are the right input parameters (for example, how mapping complexity is characterized and controlled) and what are reasonable values for these parameters, is an important part of benchmarking. In addition to the data generators that are commonly available for benchmarking query processing, we need metadata generators that can efficiently generate schemas, schema constraints, and mappings in such a way as to provide control over chosen input parameters.
1.2
Evaluating Constraint-based Data Repairing
In data cleaning, business rules or constraints are often used to express expectations or rules that data should satisfy [20]. Data that is inconsistent with a set of constraints can be cleaned (or repaired) by using evidence in the data. A common example is to select a repair that has the minimal number of changes (or the minimal cost changes) to be consistent with the constraints. Consider the player relation in Figure 2 and assume we are given the following constraints:
49
(i) A functional dependency (FD) stating that Name and Season are a key for the table: d1 : Player : Name, Season → Team, Stadium, Goals. (ii) And, a second FD stating that Team implies Stadium: d2 : Player : Team → Stadium. Player t1 : t2 : t3 : t4 : t5 : t6 :
Name Giovinco Giovinco Pirlo Pirlo Vidal Vidal
Season 2012-13 2014-15 2014-15 2015-16 2014-15 2015-16
Team Juventus Toronto Juventus New York City Juventus Bayern
Stadium BMO Field BMO Field Juventus Stadium Yankee Stadium Juventus Stadium Allianz Arena
Goals 3 23 5 0 8 3
Figure 2: Example Dirty Database The database in Figure 2 is dirty with respect to d2 . A possible repair, that may be created by a data repair system is to change t1 [Stadium] to the value “Juventus Stadium”. There are, however, many possible alternative repairs, like, for example, changing t1 [T eam] to the value “Toronto”, or changing both t3 [Stadium] and t5 [Stadium] to the value “BMO Field”. To evaluate a data repair algorithm, we must know the expected “gold-standard” output. Then we can use a simple recall and precision measure to evaluate the accuracy of the system (or a weighted recall-precision measure where credit is given for selecting a repair that is close to the desired value). In addition, to evaluate repair systems, we must have a dirty data generator, that is a data generator that can introduce errors into the data in a systematic way. Again, we must have agreement as to what are the important input parameters for error generation. Certainly we should be able to control the number of errors, but also the quality of the errors – what makes an error hard or easy to repair? The generator should be able to introduce errors in data of different sizes and having different constraints. Ideally, the generator would handle a large class of constraints as a wide variety of constraint languages have been used in cleaning. Error generation could also be coupled with constraint generation to generate different number or types of constraints. And again, it must be possible to generate dirty data efficiently, giving the user (the system evaluator) as much control over the chosen input parameters as possible.
1.3
Evaluating Data Curation
The two examples of data exchange and data repair illustrate the following requirements for large-scale evaluation of data curation tasks. (a) Quality of the Outputs. Unlike query evaluation where there is one fixed expected output of a system (the unique query result) and a small number of performance related measures to be considered (e.g., throughput, mean latency, or memory consumption), in data curation there may be multiple acceptable outputs for a task that exhibit different quality. This is complicated by the fact that the quality of an output may be a multifaceted combination of potentially conflicting quality measures. For instance, if a database that violates a set of constraints should be cleaned by removing tuples causing violations, then two important measures of the quality of a cleaned database are the number of remaining constraint violations (how clean is the solution) and the number of tuples that got removed (how much information is lost). Obviously, both measures cannot be fully optimized simultaneously. Many established quality measures are computationally hard or non-trivial to implement, such as measures for data exchange quality that require comparing potentially large database instances on criteria that include how well they preserve source information [2, 25]. A rigorous comparison of solutions for a data curation task has to take multiple quality measures into account to complement performance
50
metrics.3 When comparing two data curation algorithms we are interested in understanding their performance as well as the quality of the produced results. For example, if we are faced with the task of cleaning a very large dataset and have to decide which cleaning algorithm to apply to the problem, then to make an informed decision we need to not only know what is the quality of solutions produced by the algorithms, but also how well the performance scales over the input size. Challenge. The community needs to agree on common measures of output quality to use in evaluating data curation tasks and share implementations of these measures. When exact computation is infeasible on large or complex output, research is needed on developing approximate measures that are still effective measures of output quality. (b) Input Parameters. As our examples illustrate, the input to data curation tasks can be quite complex. To evaluate query performance the input parameters that are typically considered are hardware and software of the machine used for the experiments, size of the dataset, data distribution, and complexity of the queries. Input parameters for data curation tasks are more diverse and each task may have its own set of relevant parameters. For example, in data cleaning one may evaluate an algorithm varying the number of errors in the input dataset and the data size for a fixed schema, while for data exchange the schema size is an important input parameter. For constraint or schema discovery, the amount of redundancy in the data may be an important parameter [4]. For data profiling, the relative independence (or dependence) of attribute distributions may be important [1]. Furthermore, creating an input that conforms to a specific input parameter setting may be non-trivial for some parameters. For example, an important input parameter for constraint-based data cleaning is the number of constraint violations in the input dataset. However, introducing a given number of errors into a clean database is known to be a computationally hard problem [6]. Challenge. The community must agree on the important input parameters (which may include parameters that vary the quality of the input) for different curation tasks. We must develop and share data and metadata generators that are able to efficiently generate input scenarios for data curation systems. Furthermore, these generators must be able to systematically vary the value of input parameters independently. Providing this fine-grained control of input characteristics while still efficiently generating large numbers of input scenarios is an important research challenge. (c) Benchmarks. It is important that researchers be able to rely on common benchmarks to test their systems and compare results. In the context of data curation, benchmarks need to provide inputs to the system and establish which measures need to be used to assess the quality of outputs. Notice that some quality measures compare the quality of a solution against a gold standard, that is, a solution that is considered to be the correct or canonical solution for an input. Producing such a gold standard for some curation tasks can be highly complicated. Challenge. We should use data and metadata generators to create new, community-accepted benchmarks for different curation tasks. In addition to generating varied input scenarios, these benchmarks should include when possible - a gold standard output for each input scenario. Given these challenges, it is more understandable that the standard of experimental evaluations of data curation systems is still quite low. Most researchers do not have the time and resources to implement complex quality metrics and solve the sometimes complex problems that arise when creating realistic inputs that conform with specific input parameter settings. It is often simply not feasible to spend this amount of effort “just” to evaluate a single system. A reasonable approach to improve the situation is 1) to make implementations of community-approved quality metrics publicly available and 2) to develop benchmarking solutions which enable the generation of synthetic, but realistic, metadata and data that conform to specific input parameters. This 3
To avoid confusion, in this work we use the term performance metric to refer to measures of the runtime performance of an algorithm (e.g., average runtime or memory consumption) and quality metric to refer to a measure of the quality of a solution produced by a curation algorithm.
51
Domain Data Exchange
Constraint-based Data Repair
Discovery of Constraints or Data Quality Rules
Example Input Parameters Schema and relation size Degree of schema normalization Mapping size and complexity Amount and type of mapping incompleteness Data size No. of errors “Hardness” of errors No. of constraints Redundancy in the data Data size
Example Output Measures Preservation of source information Size of target data Redundancy in target data Similarity to gold-standard target No. of repairs No. of errors remaining in repair Similarity of repair to gold standard Precision and Recall compared to a gold standard
Figure 3: Exemplary Input Parameters and Output Quality Measures for Data Curation generation should require little user effort and it should be easy to recreate an input scenario produced by a benchmarking solution to make evaluations repeatable, e.g., by sharing the small configuration file that was used as an input for a benchmark generator instead of sharing the potentially large scenario itself. In this paper, we consider the state-of-the-art in addressing these three evaluation challenges for two data curation tasks: data exchange and constraint-based data repair. Note that the purpose of this work is not to give a comprehensive overview of all quality metrics and benchmark generators that have been proposed, but rather to outline what are the major roadblocks for experimental evaluation of data curation solutions as well as discuss a few exemplary quality measures (as introduced in IQ Meter and others [25]) and systems that generate input scenarios for data curation tasks (BART [6] and iBench [5]). Figure 3 shows some exemplary relevant input parameters that we may want to vary for an evaluation and some meaningful output quality measures. The remainder of this paper is organized as follows. We discuss output quality measures in Section 2, input parameters in Section 3, and benchmarking systems in Section 4. In Section 5, we briefly describe some new evaluations of curation systems that use these benchmarking systems. We conclude and discuss future work in Section 5.
2
Quality of the Outputs
In many fields, there are widely accepted quality measures that allow for the evaluation of solutions. Some, like precision and recall are pervasive and easy to compute, but require the existence of a gold standard output. Others, including metrics for clustering quality [26] that may be used to evaluate curation tasks like schema discovery [4], are computationally expensive. For data curation, the study of quality metrics is in its infancy. A (non-comprehensive) set of notable exceptions include metrics for evaluating matchings [8] and recent approaches for measuring the quality of data exchange solutions [2, 25]. Given that data curation tools often try to reduce human curation effort, some of these output measures try to quantify how well a tool succeeds in automating curation [3, 23, 25]. An important role of benchmarking is to enable the sharing of a standard suite of performance and quality metrics. For many curation tasks, these metrics may be computationally expensive and non-trivial to implement. In this section, we delve deeper into output measures for data exchange and data repair focusing on a few exemplary measures that illustrate the complexity of measuring the quality of a data curation system’s output.
52
2.1
Data Repair Accuracy Measures
Let us start by discussing accuracy measures for data repairing. Here, there is a natural measure in terms of (weighted) precision and recall. To see this, consider our example in Figure 2. Assume a repair algorithm is executed over the dirty database, that we denote by Id . The algorithm will apply a number of changes to attribute values, which we will call cell changes, of the form t1 [Stadium] := “JuventusStadium′′ , to Id in order to obtain a repaired instance, denoted by Irep . We call Chrep the set of cell updates applied by the system to repair the database. There are multiple – in fact, exponentially many – repairs that can be generated using this strategy. Typically, a notion of minimality of the repairs [10] has been used to discriminate among them (where minimality applies to the set of cell changes that create a repair). However, there are usually many repairs that minimally change the database, not necessarily all of the same quality. Many researchers have in fact adopted a different approach to their evaluations. We can assume that the dirty database, Id , has been generated starting from a clean database, I , and by injecting errors for the purpose of the evaluation. We know, therefore, the gold standard for this experiment, i.e., the original, clean version of the database. We also know the set of changes Chd that are needed to restore the dirty instance Id to its original clean version. Finally, since the only modification primitive is that of cell updates, the three instances I , Id and Irep all have the same set of tuple ids. In this framework, a natural strategy to measure the performance of the algorithm over this database instance is to count the differences between the repaired instance and the correct one. In fact, the quality of the repair can be defined as the F-Measure of the set Chrep , measured with respect to Chd . That is, compute the precision and recall of the algorithm in restoring the dirty instance to its clean state. The higher the F-measure, the closer Irep is to the original clean instance I . An F-measure of 1 indicates that the algorithm has changed the instance to its clean state by fixing all errors within the database, i.e., Irep = I. Notice that many data repairing algorithms not only use constant values to repair the database, but also variables [25]. A cell may be assigned a variable when the data-repairing algorithm has detected that the cell is dirty, but it cannot establish the original constant value. Data-repairing algorithms have used different metrics to measure the quality of repairs with constants and variables. Precision and recall may be computed using the following measures: (i) Value: count the number of cells that have been restored to their original values; (ii) Cell-Var: in addition to cells restored to their original values, count (with, for example, 0.5 score) the cells that have been correctly identified as erroneous and marked with a variable (in this case, changing a dirty cell to a variable counts 0.5); (iii) Cell: count with a score of 1 all of the cells that have been identified as erroneous, both those that have been restored to their original value, and those that have been marked with a variable (in this case, changing a dirty cell to a variable counts 1).
2.2
Quality Measures For Data Exchange
The notion of quality for data exchange systems is more elaborate and there are many proposals in the literature for comparing the output of two data exchange algorithms [12, 2, 25]. IQ Meter [25] proposed two main building blocks for evaluating different data exchange systems: a measure of the quality of the solution with respect to a gold-standard solution, and a measure of the user-effort in designing the transformation with a given tool. Both measures were designed for a nested-relational data model for the source and target databases, capable of handling both relational data and XML trees. Measuring Output Quality with IQ-Meter. Given a data exchange scenario, this measure assumes that a
53
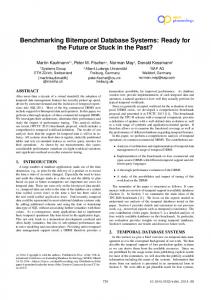
gold standard has been given in terms of the output instance expected from the data exchange. An algorithm then determines the similarity of the output instance of a transformation tool with respect to this expected instance. Given the nested-relational data model, instances can be compared with traditional metrics such as tree or graph edit distance, but none of these can be used with large datasets because of their high complexity. Moreover, typical tree and graph-comparison techniques would not work in this setting. It is common in data transformations to generate synthetic values in the output – called labeled nulls in data-exchange and surrogate keys in Extract-Transform-Load (ETL) systems. These are placeholders used to join tuples, and their actual values do not have any business meaning. Therefore the measure needs to check if two instances are identical up to the renaming of their synthetic values. We may say that we are looking for a technique to check tree or graph isomorphisms, rather than actual similarities. Unfortunately, techniques for tree and graph isomorphisms are extremely expensive over the size of the instances. A more efficient quality measure relies on the following key-idea: the instances to be compared are not arbitrary trees, but rather the result of data exchange. Since they are instances of a fixed known schema, this means that we know in advance how tuples are structured, how they should be nested into one another; and in which ways they join via key-foreign key relationships. The quality measure abstracts these features in a set-oriented fashion, and then compares them by using precision, recall, and ultimately F-measures to derive the overall similarity. More specifically, for each instance, it computes: (i) a set of tuple identifiers, also called local identifiers, one for each tuple in the instance; (ii) a set of nested tuple identifiers, called global identifiers, which capture the nesting relationships among tuples; (iii) a set of pairs of tuple identifiers, called join pairs, one for each tuple t1 that joins a tuple t2 via a foreign key. It then compares the respective sets to compute precision, recall, and the overall F-Measure that gives the level of similarity. In addition to the measure of similarity, this metric provides feedback about errors in terms of missing and extra tuples in the generated output. Other measures of accuracy for the data exchange setting have also been proposed [2, 12]. In particular, two similarity measures have been used to quantify the preservation of data associations from a source database to a target database [2]. Notice that in these approaches a gold-standard target instance is not provided for evaluation, therefore the authors focus their effort in measuring similarity between the original dataset and the result of the transformation. The first measure materializes data associations (joins of two or more relations) using the given referential constraints such as foreign keys or constraints logically implied by these constraints. Once all the associations are computed on the source and on the target, the similarity can be measured. Despite the different use case, this measure is reminiscent of the features discussed above in the IQ-Meter set-oriented measure. However, the second type of association in [2] pushes the idea further by considering all the natural joins that exist among the tuples of two relations. This measure, inspired by the notion of full disjunction, captures more associations than the one based only on the given constraints, and ultimately leads to a more precise measure of the similarity of two instances. The IQ-Meter User Effort Measure. There are several possible ways to estimate user effort [3, 23, 25]. Basic techniques rely on the time needed to completely specify a correct transformation, or on the number of user interactions, such as clicks in the GUI [3]. A more sophisticated measure computes the complexity of the mapping specification provided through a data transformation tool GUI [25]. The IQ-Meter measure models the specification as an input-graph with labeled nodes and labeled edges. Every element in the schemas is a node in the graph. Arrows among elements are edges among nodes in the graph. If the tool provides a library of graphical elements – for example to introduce system functions – these are modeled as additional nodes. Extra information entered by the user (e.g., manually typed text) is represented as labels over nodes and edges. The measure evaluates the size of such graphs by encoding their elements according to a minimum description length technique, and then by counting the size in bits of such description. Experience shows that this model is general enough to cover every data transformation, spanning from schema mapping transformations to ETL ones, and provides more accurate results with respect to previous metrics based on point-and-click counts. 54
Figure 4: IQ Comparison of Three Transformation Systems over Four Scenarios The most prominent feature of the two measures is that they enable us to plot quality-effort graphs to compare different systems over the same transformation scenario, as shown in Figure 4. Each plot shows how the quality achieved by a data transformation system varies with different levels of efforts. Intuitively, the size of the area below the curve in the plot for a given system is proportional to the amount of effort that is required to achieve high quality outputs with this system. Higher quality with lesser effort means higher effectiveness for the given task, and ultimately “more intelligence”.
3
Input Parameters
In data curation, often the goal is to ensure the curated output is of higher quality than the input data (and/or metadata). Hence, in evaluating a system, it is important to understand what are the important characteristics of this input data or metadata that can influence the performance of the system (as judged by both traditional performance metrics and also by data or metadata quality metrics). In this section, we review recent work on identifying important input parameters. In the next section, we consider how modern data and metadata generators provide flexible control over the values of some of these parameters so each can be used as an independent variable in system evaluations.
3.1
Input Parameters for Data Exchange
A data exchange scenario is a source schema (optionally with a set of constraints), an instance of the source schema, a target schema (optionally with constraints), and a mapping from the source to the target. Important input parameters include the size of the metadata, the size of the source data, and also the size and complexity of the mapping. We detail below how the complexity or quality of the input metadata has been characterized. In contrast to data repair, where the characteristics of the data to be cleaned play a major role, in data exchange, the characteristics of the metadata typically are the deciding factor for a system’s performance. Metadata Parameters. An important input characteristic for data exchange and mapping operators like mapping composition or mapping adaptation is the relationship between the source and target schema. In evaluating a mapping composition system, Bernstein et al. [9] use target schemas that were created from a source using a set of schema evolution primitives (for example, an add-attribute primitive). Yu and Popa [31] used a similar set of primitives to evaluate a mapping adaptation system. STBenchmark [3] generalized this idea to use a set of mapping primitives. Each primitive describes a specific relationship between a source and target schema (for example, vertically partitioning one relation into two fragments). Two additional mapping quality dimensions identified in the iBench system are (1) the degree to which mappings reuse or share source and target relations (metadata sharing) and (2) the amount of incompleteness in a mapping. Metadata sharing directly influences how intertwined the produced mappings are. This in turn determines the degree to which data from the source must be merged in the target (if target metadata is shared) or the data from the source has to be copied to different places in the target (if source metadata is shared). As metadata sharing is increased, some data exchange systems can produce redundant target data or data with too 55
much incompleteness (labelled nulls) thereby decreasing the accuracy of these methods compared to a goldstandard output or decreasing the quality of the output when using an output measure based on the amount of redundancy and incompleteness in the target instance. The number and complexity of mappings is another input parameter that can influence the performance of a data exchange or mapping system (such as a mapping inversion system or mapping composition system). The complexity of a mapping includes the language of the mapping which may be global-as-view (GAV), localas-view (LAV), source-to-target (ST) tuple-generating-dependencies (TGDS), full ST TGDS, or other mapping languages [29]. In addition, the number of joins (in the source or target) used in a mapping may influence the performance of a data exchange system. For mapping languages that permit the modeling of incompleteness (that is, existentials in the target expression), the amount of incompleteness is also an important parameter that may influence system performance. In addition to mapping characteristics, schema characteristics can influence system performance. These include the number and type of constraints in the schemas (for example, keys only vs. general FDs). By changing the constraints, a user can control whether a schema is normalized. The number and type of constraints may influence the performance or quality of the output of a data curation system. For example, the amount (and type) of target equality-generating-constraints (such as keys) may influence how hard it is for a data exchange system to create a consistent target instance.
3.2
Input Parameters for Data Repair
In constraint-based cleaning, data dependencies are used to detect data quality problems [20]. In quantitative data cleaning, distributional models are used and values that deviate from a distribution (outliers) are considered to be errors [19]. Data cleaning, or repair, is typically done by minimizing the number or cost of changes needed to create a consistent database [11, 21], or by finding a repair whose distribution is statistically close to the original data [28]. There are two main aspects that must be taken into consideration when evaluating constraint-based data repairing systems: the role of constraints and the role of the data. Constraint Parameters. Different repair algorithms have been developed for different fragments of first-order logic. While the most popular are FDs and conditional functional dependencies (CFDs), lately there have been some proposals to handle also denial constraints [14]. Of course, constraint languages differ in expressive power which leads to different sets of rules and ultimately to different repairs. Another parameter to consider is the number of constraints, or rules, in a cleaning scenario. A larger number of constraints usually leads to a better repair, as more external information, expressed in the rules, is enforced over the dirty data. However, a larger number of constraints also leads to a higher execution time in the detection and repair process. Data Parameters. While the role of constraints is quite evident for data cleaning, a more subtle but equally important role is played by the features of the data, and especially of the errors. Recently, BART4 [6] identified two important properties of errors: detectability and repairability. When evaluating a constraint-based repair algorithm, we want to make sure that the dirty input database used in the evaluation only contains errors that are detectable by the system in question. After all, an error that cannot be detected, cannot be repaired. To reason about detectability, we need a notion for determining whether a cell change is involved in a constraint violation. This notion assumes the existence of a clean gold standard database and a cell change is assumed to describe a difference between the gold standard and the dirty database. Consider our database in Figure 2. Assume now that the dirty cell (in bold) has been restored to its original, clean value (“Juventus Stadium”), i.e., we have a clean database and want to introduce errors in it. To start, 4
Bart: Benchmarking Algorithms for data Repairing and Translation
56
consider the following cell change: ch1 = ⟨t1 .Season := 2012-13⟩ that updates tuple t1 as follows: Player t1 :
Name Giovinco
Season 2012-13
Team Juventus
Stadium Juventus Stadium
Goals 3
This change does not introduce a violation to any of the constraints in our example. Therefore, any datarepairing tool that relies on the constraints to detect dirtiness in the database will not be able to identify it. We call this an undetectable change. When we introduce errors into clean data for the purpose of benchmarking, it is important to control the number and the behavior of the errors, but it is hard to control the exact number of errors that are guaranteed to be detectable using a given set of constraints. In fact, this requirement turns the complexity of the errorgeneration process into an NP-complete problem [6]. Once an error has been detected, the second step in the cleaning process is to repair it. Of course, some errors are easier to repair than other. Back to our example, a change that indeed introduces a detectable error is the following: ch2 = ⟨t1 .Season := 2014-15⟩. After this update, tuples t1 and t2 violate FD d1 , which states that Name and Season are a key for the table: Player t1 : t2 :
Name Giovinco Giovinco
Season 2014-15 2014-15
Team Juventus Toronto
Stadium Juventus Stadium BMO Field
Goals 3 23
This change is easily detected using the constraints. Still, it is quite difficult for an automatic data-repairing algorithm to restore the database to its clean state. Notice, in fact, that after this change, the original value 2013-14 has been removed from the active domain of the dirty database. There is no evidence in the dataset to guide an algorithm to guess the correct value for a repair. Therefore, a correct repair cannot be found by any repair algorithm that uses the values in the database as the candidates for repair. BART uses the notion of repairability of an error to characterize this aspect. In the case above, it would assign repairability 0 to change ch2 . Different detectable changes may have quite different repairability values. As an example, consider now change ch3 = ⟨t1 .Stadium := Delle Alpi⟩. The change is detectable using FD d2 . The redundancy in the example dirty database may be used to repair it: Player t1 : t3 : t5 :
Name Giovinco Pirlo Vidal
Season 2013-14 2014-15 2014-15
Team Juventus Juventus Juventus
Stadium Delle Alpi Juventus Stadium Juventus Stadium
Goals 3 5 8
The new dirty tuple t1 is involved in two violations of d2 , one with t3 , another with t5 . In both cases, the new stadium value Delle Alpi is in conflict with value Juventus Stadium. By a straightforward probabilistic argument, BART would calculate a 2/3 repairability for this error, and rank it as a medium-repairability error. In other cases, errors may have higher repairability, even 1 in some cases. Consider, for example, the case in which an additional CFD states that every person with age 40 is named Anne. Since this knowledge is part of the constraint, any tool would easily restore a dirty age value (̸= 40) for a person named Anne to its gold standard, clean state.
4
Benchmarking
We consider how modern data and metadata generators provide flexible control over the values of some of the input parameters we have identified so each can be used as an independent variable in system evaluations. We focus on the BART error generator that can be used to evaluate data repair systems and the iBench metadata generator that can be used to evaluate data exchange and mapping operators.
57
4.1
Data Repair: BART
BART is an open-source system that introduces algorithms that guarantee a compromise between control over the nature of errors and scalability [6]. BART introduces a new computational framework based on violationgeneration queries for finding candidate cells (tuple, attribute pairs) into which detectable errors can be introduced. While these queries can be answered efficiently, determining if detectable errors can be introduced is computationally hard. To overcome this issue, optimizations for violation-generation queries are introduced. In particular, extracting tuple samples, along with computing cross-products and joins in main memory, brings considerable benefits in terms of scalability. Moreover, the authors identify a fragment of denial constraints (DCs) called symmetric constraints that considerably extend previous fragments for which scalable detection techniques have been studied. The main benefit of this subclass it that algorithms for detecting and generating errors with symmetric constraints have significantly better performance than the ones based on joins and allow the introduction of controllable errors over large datasets. The Error-Generation Problem. BART permits users to declarative specify how to introduce errors into a clean dataset for benchmarking purposes. The input of the tool is an error-generation task E, which is composed of four key elements: (i) a database schema S; (ii) a set Σ of DCs encoding data quality rules over S; (iii) an instance I of S that is clean with respect to Σ; and (iv) a set of configuration parameters to control the errorgeneration process. These parameters specify, among other things, which relations can be changed, how many errors should be introduced, and how many of these errors should be detectable. They also let the user control the degree of repairability of the errors. Use Cases. BART supports several uses cases. The main one consists of generating a desired degree of detectable errors for each constraint. In addition, users may specify a range of repairability values for each constraint. In this case, BART estimates the repairability of changes, and only generates errors with estimated repairability within that range. In addition to detectable errors, BART can generate random errors of several kinds: typos (e.g., ‘databse’), duplicated values, bogus or null values (e.g., ‘999’, ‘***’). Random errors may be freely mixed with constraint-induced ones. Finally, BART can introduce outliers in numerical attributes.
4.2
Data Transformation: iBench
iBench [5] is an open-source system that supports the creation of metadata for a variety of integration tasks including but not limited to data exchange, data integration, and mapping operators. As a metadata generator, iBench can be used to generate independent schemas with an arbitrary or controlled set of mappings between them. The user has at his disposal, the ability to control over thirty distinct metadata dimensions. We now overview how iBench advances the state-of-the-art in benchmarking data-transformation systems. The Metadata-Generation Problem. Intuitively, iBench takes a metadata-generation task Γ and produces an integration scenario that fulfills the task. Here an integration scenario is a tuple M = (S, T, ΣS , ΣT , Σ, I, J, T ), where S and T are schemas, ΣS and ΣT are source and target constraints, Σ is a mapping between S and T, I is an instance of S satisfying ΣS , J is an instance of T satisfying ΣT , and T is a program that implements the mapping Σ. A user writes a metadata-generation task (or configuration) Γ by specifying minimum and maximum values for a set Π of input parameters. Note that iBench users do not need to specify every input parameter, rather only the ones they want to control. For example, a user may request an integration scenario with independent schemas of up to five attributes per relation and with only LAV mappings.5 To do this, he creates a simple metadata-generation task, specifying that the input parameters πSourceRelSize (number of attributes per source relation) and πT argetRelSize 5
Recall that LAV mappings have a single relation atom in the source [29].
58
Targetaaaaa Homeaa Teamaaaa Stdmaaaa Addressaa Teamaa Idaa aaaa Nameaaa Playera Nameaaa Seasona Idaa aaaa Goalsa a
Source . Stdmaaaa a Teamaaaa Stadiumaa aaaa PStataaaaaa Nameaaa Seasonaa Teamaaaa Goalsaaa
Figure 5: A Sample Integration Scenario Output by iBench (number of attributes per target relation) be between two and five, and that the input parameter πSourceM apSize (number of source atoms per mapping) be exactly one. We show in Figure 5 an integration scenario fulfilling these requirements. Note that both the source and target relations have up to five attributes. The black solid lines in the figure represent mapping correspondences (variables that are shared between the source and the target), and the two LAV mappings being output here are as follows: one takes a source relation Stdm(Team,Stadium) and copies it to a target relation Home(Team,Stdm,Address), and another mapping takes a source relation PStat(Name,Season,Team,Goals) and vertically partitions it into two target relations, Team(Id,Name) and Player(Name,Season,Id,Goals). iBench supports two kinds of input parameters, scenario parameters that help control the characteristics of integration scenarios to generate arbitrary independent metadata, and primitive parameters that help control the precise relationship between the source and target schemas. As shown in our example above, typical scenario parameters include controlling the schema size and complexity, the number of mappings and the complexity of the mapping language (from using ST TGDS to richer second-order TGDS [17] which are useful in evaluating integration tasks like mapping composition), and the amount and type of constraints per relation. Notice for example that in Figure 5, the second mapping creates two target keys for Team and Player, and a foreign key between them. Primitive parameters, on the contrary, act over individual mapping primitives where each mapping primitive is a parameterized integration scenario encoding a common transformation pattern (e.g., vertical or horizontal partitioning). Using primitive parameters, for instance, a user can constrain these scenarios to use a particular type of join (i.e., Star or Chain), or use a different number of partitions when constructing the mapping expressions. Mapping generation, with the level of control provided by iBench, is computationally hard [5], and moreover there may be metadata tasks for which no solution exists. iBench employs a holistic approach in examining the input requirements, and may choose to relax some scenario parameters to produce a solution. Suppose a user requests an integration scenario with source relations with exactly two attributes (scenario parameter) and requests the use of a vertical-partitioning primitive that partitions a source relation into three fragments (primitive parameter). This task has conflicting requirements, as in order to create a target mapping expression with three fragments we need to have a source relation with at least three attributes. In this case, iBench’s best-effort algorithm chooses to obey the restriction on number of partitions and violate the restriction on source relation size, that is, in the presence of conflicts, primitive parameters have precedence over scenario parameters. Still any output generated by iBench is guaranteed to be a correct solution with respect to the relaxed constraints. Use Cases. iBench supports several use cases. The first, main use case deals with generating integration scenarios that have independent schemas with random mappings and constraints. iBench can generate arbitrary 59
constraints such as FDs (including keys) and inclusion dependencies (including foreign keys), and the user can easily specify the percentage of constraints per relation, as well as the size of keys, for example. In the second use case, a user can request the generation of primitive-based parameterized scenarios. Notice that these scenarios can be used as a gold standard. Also, using a combination of scenario and primitive input parameters, a user can easily ask for a mix of independent and primitive-based scenarios. This allows for the creation of scenarios with some redundancy. By using metadata sharing, the third use case, we can use iBench to create even more realistic and complex scenarios where the degree of source and target sharing among mappings can be also controlled. Notice that in practice, most integration scenarios exhibit mappings that reuse source or target relations. A fourth use case allows users to import real-world integration scenarios (i.e., schema, mappings, data) into iBench, and systematically vary and scale them along with any other requested metadata. This feature is crucial for evaluating systems that exploit very specific transformation patterns [5]. The main innovation here has been to view the characteristics of metadata as independent variables which can be systematically controlled (via the input parameters of iBench) to generate flexible, diverse metadata in a fast, scalable way.
5
Success Stories
We now discuss some successful evaluations using the iBench and BART systems and the quality measures introduced in Section 2, focusing specifically on how these approaches enabled these evaluations.
5.1
Measuring Success Rates of Mapping Translation in Data Exchange
Arocena et al. [7] proposed an approach for rewriting second-order TGDS into equivalent first-order mappings (ST TGDS or nested mappings). Testing whether a second-order TGD is equivalent to an ST TGD or nested mapping is undecidable [18], hence this approach is correct, but not complete, meaning it may not be able to rewrite the second-order input mapping even if an equivalent first-order mapping exists. Given this incompleteness result it was important to evaluate the algorithm’s success rate over a broad range of realistic mappings and compare this rewriting algorithm to alternative approaches (such as an earlier rewriting technique by Nash et al. [27]). The evaluation goal here was to answer the question: “How often do these algorithms succeed in practice?”. iBench was used to generate schemas, schema constraints (including keys and FDs), and schema mappings expressed as second-order TGDS. The iBench system enabled the systematic (and efficient) generation of a large number of diverse mappings (over 12 million), in which the degree and complexity of incompleteness (i.e., the Skolem functions used for modeling value invention) could be controlled. This comprehensive evaluation would not have been possible without using an efficient metadata generator like iBench that provides control over both mapping and schema characteristics. A small collection of realworld scenarios would have not been representative enough to show the differences in algorithms. Relying on a few synthetic scenarios would have not been realistic enough. These experiments depended on the following specific features of iBench: efficient schema and mapping generation (both in terms of computational resources and in terms of user effort where the user only needs to set a few configuration parameters), the ability to generate second-order TGD mappings, support for varying the type and amount of incompleteness in mappings, and varying the type and amount of schema constraints.
5.2
Evaluating the Quality per Effort Ratio of Data Transformation Systems
The IQ metric for transformation quality and user effort was used to answer the question “how much user effort is it required with a particular system to reach a certain data-transformation quality?”. In this evaluation [25], the IQ metric was essential because it enabled two very important results: 1) a level comparison of user effort among systems that use very diverse means of user interaction to create a data transformation task (e.g., a mappingbased system may have a GUI that focuses on the task of schema matching and mapping generation while the 60
actual data transformation step is automatic once a mapping has been designed, while an ETL tool focuses on building a workflow out of basic data transformation steps such as surrogate key generation); and 2) a fair comparison of output quality by comparing the transformed data to a gold standard. An important property of the IQ quality measure is that it measures the quality of the final output (target instance) instead of the generated mappings. This makes the measure applicable for comparing data-transformation systems as diverse as ETL tools and data exchange systems.
5.3
Evaluating the Effect of Repairability on Data Cleaning Quality
BART was used to evaluate how the repairability of a dirty instance affects the quality of the repairs produced by data-cleaning systems [6]. Though preliminary, this evaluation demonstrated that different algorithms show different trends with respect to how repairability affects quality. BART was essential to this evaluation because it enabled the generation of dirty instances with a guaranteed number of errors that are detectable by the constraints, while at the same time controlling how hard these errors are to repair (repairability). BART helped greatly reduce the amount of effort needed to generate the multitude of dirty versions of a dataset. Creating several dirty versions of a clean dataset amounted to just changing a few configuration parameters. Importantly, BART was designed with performance in mind. The actual error-generation process is highly efficient and, thus, it is feasible to generate many large dirty instances for an experiment within very reasonable time.
6
Conclusion and Future Work
We have discussed some of the important challenges in evaluating data curation tasks where both the performance of a system and the accuracy (or quality) of the curation result must be considered. We have presented some of the important input parameters (the independent variables in an evaluation) that have been identified, along with accuracy measures. We motivated the need for data and metadata generators that can efficiently produce suites of input data or metadata for curation systems conforming to specific settings of the input parameters. We focused our discussion on two curation tasks, data exchange and data repair, and discussed the state-of-the-art in evaluating these important tasks. Much remains to be done in understanding the research challenges inherent in evaluating these and other data curation tasks. We feel this is an area that is ripe for innovation. As data curation lies at the heart of data science, we need evaluation standards and tools that inspire confidence in our solutions and drive the field forward.
References [1] Z. Abedjan, L. Golab, and F. Naumann. Profiling Relational Data: A Survey. The VLDB Journal, 24(4):557–581, 2015. [2] B. Alexe, M. A. Hern´andez, L. Popa, and W.-C. Tan. MapMerge: Correlating Independent Schema Mappings. The VLDB Journal, 21(2):191–211, 2012. [3] B. Alexe, W. Tan, and Y. Velegrakis. Comparing and Evaluating Mapping Systems with STBenchmark. PVLDB, 1(2):1468–1471, 2008. [4] P. Andritsos, R. J. Miller, and P. Tsaparas. Information-Theoretic Tools for Mining Database Structure from Large Data Sets. In SIGMOD, pages 731–742, 2004. [5] P. C. Arocena, B. Glavic, R. Ciucanu, and R. J. Miller. The iBench Integration Metadata Generator. PVLDB, 9(3):108–119, 2015. [6] P. C. Arocena, B. Glavic, G. Mecca, R. J. Miller, P. Papotti, and D. Santoro. Messing-Up with BART: Error Generation for Evaluating Data Cleaning Algorithms. PVLDB, 9(2):36–47, 2015.
61
[7] P. C. Arocena, B. Glavic, and R. J. Miller. Value Invention in Data Exchange. In SIGMOD, pages 157–168, 2013. [8] Z. Bellahsene, A. Bonifati, F. Duchateau, and Y. Velegrakis. On Evaluating Schema Matching and Mapping. In Schema Matching and Mapping, pages 253–291. Springer, 2011. [9] P. A. Bernstein, T. J. Green, S. Melnik, and A. Nash. Implementing Mapping Composition. The VLDB Journal, 17(2):333–353, 2008. [10] L. Bertossi. Database Repairing and Consistent Query Answering. Morgan & Claypool, 2011. [11] P. Bohannon, M. Flaster, W. Fan, and R. Rastogi. A Cost-Based Model and Effective Heuristic for Repairing Constraints by Value Modification. In SIGMOD, pages 143–154, 2005. [12] A. Bonifati, G. Mecca, A. Pappalardo, S. Raunich, and G. Summa. The Spicy System: Towards a Notion of Mapping Quality. In SIGMOD Conference, pages 1289–1294, 2008. [13] P. Buneman, J. Cheney, W.-C. Tan, and S. Vansummeren. Curated Databases. In PODS, pages 1–12, 2008. [14] X. Chu, I. F. Ilyas, and P. Papotti. Discovering Denial Constraints. PVLDB, 6(13):1498–1509, 2013. [15] R. Fagin, P. Kolaitis, R. Miller, and L. Popa. Data Exchange: Semantics and Query Answering. TCS, 336(1):89–124, 2005. [16] R. Fagin, P. Kolaitis, and L. Popa. Data Exchange: Getting to the Core. ACM Transactions on Database Systems, 30(1):174–210, 2005. [17] R. Fagin, P. Kolaitis, L. Popa, and W. Tan. Composing Schema Mappings: Second-Order Dependencies to the Rescue. ACM Transactions on Database Systems, 30(4):994–1055, 2005. [18] I. Feinerer, R. Pichler, E. Sallinger, and V. Savenkov. On the Undecidability of the Equivalence of Second-Order Tuple Generating Dependencies. Information Systems, 48:113–129, 2015. [19] J. Hellerstein. Quantitative Data Cleaning for Large Databases. In Technical report, UC Berkeley, Feb 2008. [20] I. F. Ilyas and X. Chu. Trends in Cleaning Relational Data: Consistency and Deduplication. Foundations and Trends in Databases, 5(4):281–393, 2015. [21] S. Kolahi and L. V. S. Lakshmanan. On Approximating Optimum Repairs for Functional Dependency Violations. In ICDT, pages 53–62, 2009. [22] S. Kolahi and L. Libkin. An Information-Theoretic Analysis of Worst-Case Redundancy in Database Design. ACM Transactions on Database Systems, 35(1), 2010. [23] S. Kruse, P. Papotti, and F. Naumann. Estimating Data Integration and Cleaning Effort. In EDBT, pages 61–72, 2015. [24] B. Marnette, G. Mecca, and P. Papotti. Scalable Data Exchange with Functional Dependencies. PVLDB, 3(1):105– 116, 2010. [25] G. Mecca, P. Papotti, S. Raunich, and D. Santoro. What is the IQ of your Data Transformation System? In CIKM, pages 872–881, 2012. [26] M. Meila. Comparing Clusterings: an Axiomatic View. In ICML, pages 577–584, 2005. [27] A. Nash, P. A. Bernstein, and S. Melnik. Composition of Mappings Given by Embedded Dependencies. TODS, 32(1):4, 2007. [28] N. Prokoshyna, J. Szlichta, F. Chiang, R. J. Miller, and D. Srivastava. Combining Quantitative and Logical Data Cleaning. PVLDB, 9(4):300–311, 2015. [29] B. ten Cate and P. G. Kolaitis. Structural Characterizations of Schema-Mapping Languages. In ICDT, pages 63–72, 2009. [30] T. Vogel, A. Heise, U. Draisbach, D. Lange, and F. Naumann. Reach for Gold: An Annealing Standard to Evaluate Duplicate Detection results. J. Data and Information Quality, 5(1-2):5:1–5:25, 2014. [31] C. Yu and L. Popa. Semantic Adaptation of Schema Mappings when Schemas Evolve. In VLDB Conference, pages 1006–1017, 2005.
62