SENSORCOMM 2011 : The Fifth International Conference on Sensor Technologies and Applications
Benchmarking for Wireless Sensor Networks Jono Vanhie-Van Gerwen, Stefan Bouckaert, Ingrid Moerman, Piet Demeester Department of Information Technology (INTEC) Ghent University - IBBT Ghent, Belgium Email:
[email protected]
Abstract—While the number of Wireless Sensor Network (WSN) protocols steadily increases, the evaluation methods have largely remained the same. Although experimentallysupported research is gaining popularity, protocol evaluation and comparison remains difficult due to a lack of performance analysis methodologies. This work introduces a wireless-benchmarking workflow that is designed to support experimentally-driven analysis of WSN protocols. This methodology and the accompanying benchmark concepts are designed to increase the value of experimental performance evaluation compared to the current ad-hoc approaches applied by many researchers. Finally, we present a proof of concept implementation used to perform experiments based on the proposed workflow. Keywords-Wireless Sensor Networks; benchmarking; performance; evaluation.
I. I NTRODUCTION Wireless Sensor Networks (WSNs) are evolving into a more mature research field, with more and more protocols being developed and publicly released. The use cases for WSNs are equally fast expanding into new domains, such as Wireless Building Automation [1] and Cognitive Networks [2]. Recently, the interest of the research community in experimentally-driven research in wireless networks is increasing. This observation is reflected in the topics of international conferences that increasingly welcome experimentally-driven research, and the recent interest of the European Commission in experimental facilities [3]. Still, when WSN protocols are developed, research efforts are often focused on the isolated programming of single layer protocols with little regard for other layer functionality or restrictions. This leads to protocols that exist in a vacuum and perform well on a theoretical basis, but have problems when deployed under real-life circumstances [4], [5]. Many of these protocols are furthermore validated using ad-hoc created experimental tests, specifically aimed at the strengths of a specific protocol, leaving little room for objective comparison with other protocols. Currently, there exists no fixed set of accepted testing methods, scenarios, parameters or metrics to be applied on a protocol under test. This lack of standardization significantly increases the difficulty for a developer to assess the relative performance of their protocols compared to the current state of the art. As a solution to these problems, we introduce a
Copyright (c) IARIA, 2011.
ISBN: 978-1-61208-144-1
benchmarking methodology for WSN research to increase the value of performance evaluations. We define WSN benchmarking as the measurement and evaluation of wireless sensor protocols, devices and networks, relative to a reference evaluation, under well documented conditions. As a result, benchmarking differs from traditional ad-hoc experiments by following a commonly accepted methodology that covers the entire experiment life cycle, making experiments reproducible and the results directly comparable with other research results. In WSN research, this requires not only evaluating the device or protocol under test, but also measuring or modeling the wireless environment. We have used the presented workflow in our previous work [6], where the real-life performance of five popular MAC and routing protocols for TinyOS [7] was evaluated. While [6] focuses on the results, this papers complements it by focusing on the used experimentation methods and the developed implementation to reach these results. Our methodology is specifically aimed at real-life experimentation and testbeds. Simulations can reduce the duration of tests dramatically. Unfortunately, the real-life value of the obtained results does not necessarily increase [8]. To truly know the performance and characteristics of a network protocol, it should be benchmarked in multiple reallife environments under various realistic conditions. Within the European seventh Framework Programme, the CREW (Cognitive Radio Experimentation World) project [9] targets the development of an open federated test platform, facilitating experimentally-driven research on cognitive radio, cognitive networking, and spectrum sensing. An important aspect of CREW is the creation of a wireless benchmarking framework, which should allow fair comparison of wireless (cognitive) solutions, by creating a reproducible test environment, as well as traffic and interference models needed for emulating realistic applications and interference sources, eventually establishing a methodology for the evaluation of cognitive radio concepts. After first reviewing the related work, the benchmarking workflow is presented in Section III, together with the concepts that drive it. Next, the proof of concept implementation of our WSN benchmarking methodology is discussed in Section IV, before presenting our future work in section V.
134
SENSORCOMM 2011 : The Fifth International Conference on Sensor Technologies and Applications
Control interface Benchmark management & monitoring
Benchmark scenario
Code
Scheduling
WSN network
Parameter Evaluation
Benchmark result feedback
Figure 1.
Although benchmarking of (wireless) networks is currently a research topic in multiple European research projects such as CREW [9], BonFIRE [10], or OneLab(2) [11], few benchmarking frameworks for wireless network protocol design are currently found in literature. Among the work that can be found, TinyBench [12] focuses solely on the internal metrics of a single sensor node; In the work of Kim et. al. [13], only a single layer in the protocol stack per benchmark execution is observed. Similarly, in [14], the authors explore black-box benchmarking of application protocols in network protocol stacks. As their focus is only on the performance of the application, they choose not to measure the performance of individual networking protocols. Benchmarks of individual characteristics of WSNs are furthermore also found in [15], where the authors develop a benchmarking methodology to evaluate the performance of sensor processors. To this end, the authors compose different basic benchmarking applications based on modular application building blocks. In contrast with our presented benchmarking approach, the works cited above analyze only a single protocol layer. While this simplifies analysis and benchmark execution, the approach cannot provide information on layer incompatibilities between different sets of protocols, nor gives information on the overall performance of a network which is built based on the protocols under test. Benchmarking on a larger scale and scope by evaluating a complete protocol stack while observing an entire sensor network delivers a better insight into the real-life performance of a WSN application. In other studies such as [16] and [17], the term ‘benchmarking’ is used to evaluate the performance of a network as a whole. In the former technical note, the authors give an overview of do’s and don’ts and hints for the performance analysis of Wireless LAN access points in terms of throughput and rate vs. range performance. In the latter document, the authors note that no third-party benchmarking solutions seem to be available and then resort to an ad-hoc benchmarking approach to compare the three wireless mesh networking platforms, mainly in function of throughput and
ISBN: 978-1-61208-144-1
Evaluation
Benchmarking workflow
II. R ELATED WORK
Copyright (c) IARIA, 2011.
Analysis
coverage predictability. Unfortunately, while these authors do compare the overall performance of different wireless solutions, the lack of generic benchmarking solutions makes that their approach can only be used for their specific cases. Ad-hoc benchmarking solutions may lead to faster results when only needing to compare a fixed set of wireless protocols or wireless devices once, however, the reproducibility and level of details obtained through these tests is generally limited. To the best of our knowledge, none of the related works present a sustainable benchmarking workflow, fully and flexibly supporting the benchmarking of wireless sensor solutions on testbeds. In the next sections, we present our generally applicable benchmarking solution, which was successfully used to reliably evaluate the performance of multiple full wireless networking stacks [6]. III. B ENCHMARKING WORKFLOW In Figure 1, we propose a benchmarking workflow responsible for defining, executing and analyzing individual experiments. By incorporating the entire experiment life cycle in our methodology, benchmark integrity and correctness is enforced. We describe the separate components in further detail to indicate their individual importance. A. Benchmark scenario A benchmark is fully defined by a scenario. A scenario is the global description of a benchmark and is based on reallife use cases or artificial test environments. For example, a scenario could describe the specific traffic patterns and network load of an intrusion detection use case. Such scenario properties are defined using three different scenario components: (i) criteria, (ii) parameters and (iii) metrics. It is the detailed description of these scenarios that can form a baseline for benchmark standardization. A criterion defines the focus of a benchmark, and the characteristics to be examined. To establish a broad view on the performance of a sensor network, it is generally necessary to combine multiple criteria in the evaluation, depending on the requirements of a specific deployment or comparison. If the scenario is based on a real-life use case, the criteria should be chosen to reflect the most important
135
SENSORCOMM 2011 : The Fifth International Conference on Sensor Technologies and Applications
characteristics of the use case. For example, when node lifetime in a battery powered network is important, energy efficiency is an appropriate criterion. A scenario contains a number of parameters, allowing fine grained control over the execution of a benchmark. Depending on the scope of a parameter, two categories are distinguished, i.e. internal and external parameters. External parameters control the node behavior, e.g. the amount of data it sends, to whom, and at what rate. The scenario dictates in what range the external parameters can vary while staying in the same scenario, e.g. for a building automation temperature monitoring scenario the reporting interval can vary between five seconds and ten minutes. External parameters are also responsible for defining the environment, emulating interference or background traffic. Internal parameters on the other hand affect the settings of the evaluated protocols, e.g. route table size, sleep interval, queue size. Internal parameters are most often used for protocol optimization, where a designer wants to increase the performance of his own protocol for a specific use case. Each internal or external parameter can additionally be a function of the time, changing depending on the progression of the benchmark if the scenario requires it. This can be useful to simulate the dynamic behavior of the evaluated protocols or the environment. Finally, the metrics are the aspects from the benchmark execution that are logged and evaluated. The chosen metrics should reflect the focus of the benchmark criterion and provide information to form well supported conclusions. These metrics are performance metrics and are dependent on the execution of the benchmark, e.g. throughput, packet error rate. In a final phase, all metrics are translated to a single benchmark score using appropriate weights defined in the scenario. This can also be a combination of the measured performance metrics with predefined business metrics, e.g. cost or operational complexity. In Table I an example of the relationship between criteria and metrics is given, with examples of external parameters. These scenarios should be standardized so that they define which benchmarks should be applied for different use cases. This includes topology and environment information to complete the external parameters of a specific benchmark. Both internal and external parameters should be well defined so that a repeated benchmark delivers the same node behavior, regardless of the specific framework implementation. A common format for benchmark definition and result description is essential to obtain relevant evaluations across different platforms. These efforts will increase the adoption and value of a benchmarking solution. B. Scheduling The scheduling component is responsible for executing a benchmark with the correct parameters on the WSN testbed. A benchmark performed in isolation rarely provides
Copyright (c) IARIA, 2011.
ISBN: 978-1-61208-144-1
metrics criteria energy
delivery rate
reliability
X
delay
X
application throughput
energy use
experiment duration
X
X
end-to-end delay
X
X X
throughput
X
stability
footprint
X
X
X
scalability
X
X
memory
X parameters
communication broadcasting
single sink
multiple sinks
point-to-point
hybrid
traffic
packet size
% sending nodes
packet interval
event impact
variance
network
network size
topology
node density
interference
channel
Table I E XAMPLES OF CRITERIA , PARAMETERS AND METRICS
p2
p2
p3 p1
p2
p3 p1
p3 p1
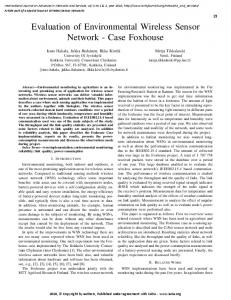
Figure 2. Parameter space reduction with three iterated benchmark series
enough information to form well-founded conclusions. For a full protocol analysis multiple benchmarks are needed, varying parameters to form a global view. There often exists a correlation between groups of benchmarks scanning a parameter space, e.g. when evaluating the delay metric by adjusting the radio duty cycle, packet interval and network size the three parameters will be correlated. If this correlation is exploited the amount of required experiments can be drastically reduced, while increasing the value of the performed benchmarks. The scheduling and analysis components form a tightly coupled feedback loop to enhance these effects present in many benchmarks and use result feedback to adjust benchmark parameters. We consider two types of benchmark relationships: Iterative benchmarks: are correlated by the common parameter space that is scanned. The results of a series of benchmarks can be used to tighten the parameter space in subsequent benchmarks. A series of sampling benchmarks can help to define the result space, so that new benchmarks can be selected to focus on interesting parameter intervals. This concept is illustrated by Figure 2, where the parameter space defined by three parameters is tightened around two phenomena by iterating a series of benchmarks, changing the parameter granularity and range. The dots represent individual experiments. Conditional benchmarks: present a different type of coupling, where the successful execution of a certain benchmark is required before the coupled benchmark can be executed. This occurs when a relationship between two benchmarks is strict, i.e. a benchmark has no value if a
136
SENSORCOMM 2011 : The Fifth International Conference on Sensor Technologies and Applications
previous benchmark did not yield the required result. To cope with sequential benchmarks a hard decision relationship is modeled between consecutive benchmarks. If these hard choices are implemented, insignificant benchmarks can be canceled or altered, saving evaluation time. C. Analysis The analysis component is responsible for processing measurement data during and after the experiment using the predefined metrics of the benchmark scenario. An important factor of benchmarking is the level of visibility required to perform a correct analysis. Visibility is defined in [18] as the energy cost of diagnosing the cause of a failure or behavior. A high visibility grants insight in the internal metrics of the protocol or device under test, e.g. queue depth, processing delay and processor load. The higher your visibility requirements are, the more difficult it is to obtain that insight in a real-life testbed without altering the behavior of the protocol under test. This is also known as the Heisenbug problem [19], based on the Heisenberg uncertainty principle, where the internal observation of the program under test changes its behavior compared to an unmonitored execution. A low visibility is the most straightforward to obtain in a testbed since no in-depth metrics are monitored when the sensor node is seen as a black-box. But if little or no information is available on the internal metrics of a protocol or sensor node, then the analysis is limited in its scope. Visibility in benchmarking is additionally considered as the complexity cost of the diagnosis. A benchmarking framework should be capable of regulating the visibility of each benchmark to minimize the complexity of the analysis, but still achieve the desired results. Monitoring is the live analysis of the environment and meta information of a WSN experiment, and a crucial component of any benchmarking system. To detect unwanted effects such as node crashes, clock drift and external interference, monitoring the benchmark and its environment should be an important part of a benchmarking framework. Without this feature, the quality of benchmarking results decreases as the nondeterminism of a benchmark increases. A benchmarking system should not only anticipate this nondeterminism, but instantly decrease its influence [20]. This can be done by adjusting the run length of each benchmark, depending on the measured stability and variance of the recorded metrics and the environment while repeating a given benchmark multiple times to compensate for outliers. This implies that not only the WSN devices itself should be monitored, but also the wireless medium. For this purpose a number of WSN nodes or specialized devices should be deployed to scan the environment and model the external interference to the benchmark, so that a complete coverage of the experiment area is obtained. If the measured environment does not map to the defined environment in
Copyright (c) IARIA, 2011.
ISBN: 978-1-61208-144-1
the benchmark scenario, the results should be discarded or decreased in value, depending on the measured deviation. D. Evaluation In our benchmarking workflow, two forms of evaluation are identified. The first evaluation is the most straightforward, where the metrics results are translated to one or more easy to understand benchmark scores. A second evaluation is the parameter evaluation that occurs in the feedback loop between the analysis and the (re)scheduling of a benchmark, where the original parameters of a benchmark are adjusted. Benchmark score: is the result of an additional processing of the performance metrics to more directly comparable scores. This process is always a reduction of the metrics data, so that a reliable intuitive comparison is possible between benchmarks, only based on the benchmark score. Depending on the type of benchmark a capped score can be presented in the form of a percentage or an uncapped score as a real number. For uncapped scores, the reference benchmark metrics results are mapped to a designated score, e.g. 0, 1000 or 10000. Parameter evaluation: uses the result feedback from the analysis to refine the chosen parameters of a benchmark. This form of evaluation enables the use of correlation effects in the scheduling step as described in III-B. From the metrics of a series of previously executed correlated benchmarks interesting parameter sets are identified and additional benchmarks are scheduled with adjusted parameters to refine the benchmark results. IV. P ROOF OF CONCEPT IMPLEMENTATION In order to validate the concepts of the described benchmarking workflow, we implemented a proof of concept benchmarking system, enabling the automated performance evaluation of multiple protocol implementations. While the benchmarking framework is implemented on a specific wireless test environment, it is very loosely coupled and therefore applicable to multiple testbed environments with minor adjustments. The specific benchmark implementation in this paper is built on the IBBT w-iLab.t testbed [21]. With a capacity of 200 sensor nodes, deployed across three floors of an office environment, the testbed provides ample measurement accuracy and size. Each Tmote Sky sensor node [22] is connected to a central database, so that every action and state of the entire sensor network can be monitored centrally. The implemented framework consists of four cooperating components, given schematically in Figure 3. The main components are (i) the TinyOS code, (ii) the configuration software, (iii) the testbed and (iv) the result analysis. These components are briefly discussed below, and shown how they address the needs of our benchmarking system and map to the proposed workflow.
137
SENSORCOMM 2011 : The Fifth International Conference on Sensor Technologies and Applications
Result feedback
Benchmark scenario
p2p/sink p2p/
send and payload info
start interrupt clusters
measure energy
stop interrupt
TinyOS wrapper
Benchmark control
TinyOS code
online nodes
Results
individual configuration
Scheduling
Figure 3.
WSN testbed
Analysis
Components of the implemented benchmarking framework
The TinyOS benchmarking code: is the enabling factor of our framework, built on the popular operating system for wireless sensor nodes. This component allows the selection of MAC and routing protocols at compile time, with minimal requirements on the protocol implementation. This code has to be included in the WSN firmware so that the other components of the framework are able to communicate with the individual nodes. The code largely consists of generic timers and components, so little execution logic is embedded in the static code for the sensor nodes. Since control and execution is very loosely coupled it is straightforward to port our code to other operating systems, hardware or platforms. The configuration software: centralizes the logic and control of our benchmarking system. This component translates the formal benchmark scenarios defined in III-A to specific configuration messages for the individual sensor nodes. It also has full connectivity through the testbed infrastructure to the WSN nodes and fulfills the functions of the scheduling component of our workflow. Each sensor node in the network only receives local configuration details and has no global knowledge of the network, corresponding with a real-life situation. Each individual configuration message is stored in a central repository, so that a benchmark can be executed multiple times with exactly the same configuration. This enhances the comparability and since the source code is written in Java, the same benchmarking logic and algorithms can easily be distributed to other systems. The testbed: enables the execution of a benchmark on the available hardware and provides an important monitoring and control component with the “Environment Emulator” (EE). The EE is connected through a USB interface with the sensor nodes of the testbed and allows the emulation of battery level, the measurement of external metrics such as power consumption and the generation of accurate interrupts. For these features, a direct connection is made with the general purpose pins of the Tmote Sky node, allowing communication and measurement without using the blocking functions of the UART. The inclusion of the EE allows the synchronization of the benchmark and the sensor nodes. The sensor nodes connected to the testbed are configured with
Copyright (c) IARIA, 2011.
ISBN: 978-1-61208-144-1
a management IP address. This way, each sensor node can receive a series of configuration packets at the start or during the benchmark, controlling the exact execution of the node during the benchmark. Result analysis: is performed on the result set generated by the TinyOS component during or after the benchmark. The analysis component is fully decoupled from the rest of the framework and can work on any result set as long as the data format is provided before the analysis. The proof of concept application is provided with two analysis tools, one written in Java for real-time experiment monitoring and another composed of MATLAB scripts to generate graphs for each active metric. Evaluation: is not yet an automated process in the current proof of concept. Both forms of the described evaluation are supported, but must be done manually. The evaluation of the metric results is aided by the automatic generation of graphs based on the types of metrics in a scenario, after which an analyst can draw the correct conclusions. The parameter evaluation after the result feedback is also a manual process, where based on the Design of Experiments [23] a parameter space is scanned, starting from coarse parameter choices to fine variations, based on the areas of interest identified by the analyst. The benchmarking framework implementation is currently used in our research department to evaluate protocol compatibility and real-life performance. The proof of concept does currently not include all advanced features, nevertheless some interesting results are already achieved with the framework. An in depth analysis of the results obtained using this benchmarking framework is available in [6]. V. F UTURE W ORK The current proof of concept implementation is to be expanded with the more advanced monitoring and coupling aspects. An important improvement would be the further automation of the benchmarking framework, where benchmarks are automatically scheduled and refined based on previous runs. This could drastically shorten the time spent on evaluating and analyzing the raw data from the experiments, while also increasing accuracy and reducing the time needed to achieve reliable results [24]. The final results of the performed benchmarks are currently aggregated in easy to understand graphs of different scope, allowing a complete overview of the measured performance characteristics. Although complete, this method still requires an analyst to draw conclusions from the metric data. These conclusions are not always straightforward and require a certain familiarity with the subject. It would make the benchmarking system more practical if the results could be translated in a series of scores on different criteria, leading to straightforward conclusions about the performance of the evaluated system.
138
SENSORCOMM 2011 : The Fifth International Conference on Sensor Technologies and Applications
We are also looking to create a full integration of our configuration software in the web management system of the IBBT testbed. This will enhance the usability of the framework, while also drastically expanding the user base. This transition and the usage of a central database for all framework users will allow the possibility of easy benchmark sharing. Specific configurations and updates can easily be disseminated throughout the user community, improving the standardization and comparability. VI. C ONCLUSION In this work it was argued that common problems exist in the development and evaluation of WSN protocols and applications, that lead to difficult deployments and real-life performance confusion. The proposed benchmarking workflow tries to solve these experimentation problems, based on the methods used in our experimentally driven research. This methodology focuses on benchmark correctness and comparability, starting from a rigorous benchmark definition by scenarios. Next, the scheduling step in tandem with benchmark monitoring is responsible for the correct and most efficient execution of a benchmark. Finally, the analysis and evaluation give a clear and comparable view of the benchmark results. This has led to a benchmarking workflow that enables the qualitative comparison of WSN solutions in the least restrictive way. By using the presented methodology, experimenters will reach more reliable results that are comparable with the results of others using this benchmark workflow. It is shown how this benchmarking methodology can be translated to a proof of concept implementation, realizing an essential subset of the proposed benchmarking concepts, capable of evaluating and analyzing network protocols and their combinations in a real-life environment. We hope this work will be a first step to a standardized benchmarking system, assisting protocol developers and users in the selection and optimization of many existing and future protocols. VII. ACKNOWLEDGEMENTS Jono Vanhie-Van Gerwen thanks the Institute for the Promotion of Innovation through Science and Technology in Flanders (IWT-Vlaanderen) for funding part of this research through a grant. Part of the research leading to these results has received funding from the European Union’s Seventh Framework Programme (FP7/2007-2013) under grant agreement n 258301 for the CREW project. R EFERENCES [1] W. Vandenberghe, B. Latr´e, F. De Greve, P. De Mil, I. Moerman, and P. Demeester, “A system architecture for wireless building automation,” 15th IST Mobile & Wireless Communications Summit 2006, Proceedings, 2006.
Copyright (c) IARIA, 2011.
ISBN: 978-1-61208-144-1
[2] E. De Poorter, B. Latr´e, I. Moerman, and P. Demeester, “Symbiotic networks: Towards a new level of cooperation between wireless networks,” Wirel. Pers. Commun., vol. 45, no. 4, pp. 479–495, 2008. [3] European Commission, “Ict work programme 2009-10 for ict research in fp7,” July 2009. [4] M. Ali, T. Voigt, U. Saif, K. Rmer, A. Dunkels, K. Langendoen, J. Polastre, and Z. A. Uzmi, “Medium access control issues in sensor networks,” SIGCOMM 2006, pp. 33–36, 2006. [5] G. Barrenetxea, F. Ingelrest, G. Schaefer, and M. Vetterli, “The Hitchhiker’s Guide to Successful Wireless Sensor Network Deployments.” in SenSys, 2008, pp. 43–56. [6] J. Vanhie-Van Gerwen, E. De Poorter, B. Latr´e, I. Moerman, and P. Demeester, “Real-life performance of protocol combinations for wireless sensor networks,” in SUTC, jun. 2010, pp. 189 –196. [7] TinyOS, “open-source os for wireless embedded sensor networks. http://tinyos.net (last accessed april 2, 2011).” [8] C. J. Sreenan, S. Nawaz, T. D. Le, and S. Jha, “On the sensitivity of sensor network simulations.” in VTC Spring. IEEE, 2006, pp. 1043–1047. [9] CREW project, “Home page,” http://www.crew-project.eu/ (last accessed March 22, 2011). [10] BonFIRE project, “Home page,” http://www.bonfireproject.eu/ (last accessed March 22, 2011). [11] OneLab, “Home page,” http://www.onelab.eu/ (last accessed March 22, 2011). [12] M. Hempstead, M. Welsh, and D. Brooks, “Tinybench: The case for a standardized benchmark suite for tinyos based wireless sensor network devices.” LCN, pp. 585–586, 2004. [13] T. Kim, J. Kim, S. Lee, I. Ahn, M. Song, and K. Won, “An automatic protocol verification framework for the development of wireless sensor networks,” in TridentCom, 2008. [14] P. Gunningberg, M. Bjorkman, E. Nordmark, S. Pink, P. Sjodin, and J.-E. Stromquist, “Application protocols and performance benchmarks,” IEEE Communications Magazine, vol. 27, no. 6, pp. 30 –36, jun. 1989. [15] L. Nazhandali, M. Minuth, and T. Austin, “Sensebench: toward an accurate evaluation of sensor network processors,” oct. 2005, pp. 197 – 203. [16] Farpoint Group, “Benchmarking wirless lans: Recommended practice,” Farpoint Group, Tech. Rep., 2006. [17] Novarum Inc., “The value of smart antennas: Campus mesh network performance benchmark,” Novarum Inc., Tech. Rep., January 2010. [18] M. Wachs, J. I. Choi, J. W. Lee, K. Srinivasan, Z. Chen, M. Jain, and P. Levis, “Visibility: A new metric for protocol design,” in SenSys, 2007. [19] J. Gray, “Why do computers stop and what can be done about it?” Tandem, Tech. Rep. 85.7, 1985. [20] T. Kalibera, L. Bulej, and P. Tuma, “Benchmark precision and random initial state,” in SPECTS. SCS, 2005, pp. 853–862. [21] S. Bouckaert, W. Vandenberghe, B. Jooris, I. Moerman, and P. Demeester, “The w-iLab.t testbed,” in Tridentcom, May 2010. [22] Moteiv, “Tmote Sky Datasheet,” 2007. [Online]. Available: http://www.sentilla.com/pdf/eol/tmote-sky-datasheet.pdf [23] D. C. Montgomery, Design and Analysis of Experiments. John Wiley and Sons Inc, 2004. [24] T. Kalibera, J. Lehotsky, D. Majda, B. Repcek, M. Tomcanyi, A. Tomecek, P. Tuma, and J. Urban, “Automated benchmarking and analysis tool,” in valuetools, 2006.
139