Benchmarks
Lanlan Shen, Yi Guo, Xinli Chen, Saira Ahmed, and Jean-Pierre J. Issa M.D. Anderson Cancer Center, Houston, TX, USA BioTechniques 42:48-58 (January 2007) doi 10.2144/000112312
Methylation Level (%)
Annealing Tm (�C)
P2RX5-top
Annealing Tm (�C)
FANK1-top
Annealing Tm (�C)
TNFSF7-bottom
Methylation Level (%)
Methylation Level (%)
LOC388407-top
Annealing Tm (�C)
SOX11-top
Annealing Tm (�C)
FEZ1-top
FEZ1-bottom
Methylation Level (%)
Annealing Tm (�C)
methylation plays an important role in both cancer initiation and progression, and this process is also implicated in other diseases, including imprinting disorders, diseases with trinucleotide expansions, and aging-related diseases (3–5). The central role of DNA methylation in maintaining cellular function, and the broad implications of DNA methylation in diseases have created a strong need for techniques to detect and measure DNA methylation reliably and quantitatively. Currently, most approaches for measuring DNA methylation are based on sodium bisulfite treatment, which creates sequence differences by converting unmethylated cytosines
Methylation Level (%)
FGF11-top
Methylation Level (%)
Methylation Level (%)
In mammals, the target of DNA methylation is the C5 position of cytosine at the CpG dinucleotides. About 70% of CpG dinucleotides within the genome are methylated, and most unmethylated CpG dinucleotides are found in GC-rich sequences termed CpG islands (1). A large proportion of CpG islands is found in the promoter region of genes, and DNA methylation at these CpG islands can lead to transcriptional silencing of the associated genes. DNA methylation and associated gene silencing has essential normal functions for cell differentiation, imprinting, X-chromosome inactivation, and the suppression of parasitic DNA sequences (2). Aberrant DNA
to uracils, but leaving methylated cytosine unchanged. The differences can then be detected quantitatively by several techniques, such as sequencing of subclones or PCR products (6), restriction-digestion (COBRA) (7), or pyrosequencing (8). The main concern for PCR-based quantitative DNA methylation analysis is PCR bias, which is due to the fact that methylated and unmethylated DNA molecules sometimes amplify with greatly differing efficiencies. Using bisulfite PCR and restriction enzyme digestion, Warnecke et al. (9) reported a strong bias of amplification for unmethylated DNA in two human genes, p16 and Rb, and this bias occurred specifically for the primers directed to top strand DNA. They hypothesized that this bias could be due to the lower PCR efficiency through secondary structure formation for methylated DNA. However, they were unable to overcome this PCR bias by changing PCR conditions, such as extension time, annealing and denaturation temperature, MgCl2 concentration, and the addition of varying concentrations of secondary structure inhibitors, such as dimethyl sulfoxide (DMSO) and formamide. Recently, we have used bisulfite PCR and pyrose-
Methylation Level (%)
Optimizing annealing temperature overcomes bias in bisulfite PCR methylation analysis
Annealing Tm (�C)
Annealing Tm (�C)
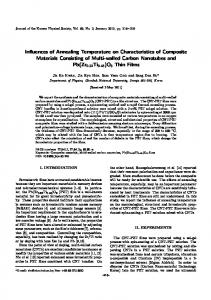
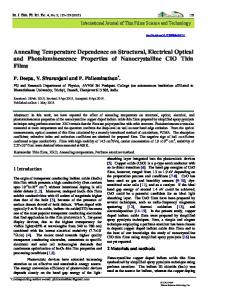
Figure 1. Bisulfite pyrosequencing analysis of six human gene promoters in RKO cell lines. Percent of average methylation at different C sites is shown on the y-axis. Three different annealing temperatures are indicated in x-axis. For four genes (FGF11, LOC388407, FANK1, and SOX11), PCR primer sets were designed based on the top strand of the gene. For P2RX5 and TNFSF7 genes, PCR primer sets were designed based on the bottom strand of the gene. For FEZ1 gene, two sets of PCR primers were designed for either top or bottom strand of the gene. Tm, melting temperature. 48 ı BioTechniques ı www.biotechniques.com
Vol. 42 ı No. 1 ı 2007
Benchmarks
Table 1. CpG Density, GC Content, and Other Characteristics of PCR Products for Each Assay Strand
Nucleotides Between Primers (No.)
CpGs Between Primers (No.)
CpG Densitya
GC M/UMb (%)
CpG Sites Analyzed (No.)
Methylation Affected by Tm (%)
FGF11
Top
123
13
0.11
51/42
5
Y
LOC388407
Top
190
16
0.08
41/34
4
Y
FANK1
Top
169
21
0.12
50/39
6
Y
SOX11
Top
140
19
0.14
51/37
7
ND
P2RX5
Bottom
104
10
0.10
46/38
4
Y
TNFSF7
Bottom
99
7
0.07
43/36
3
ND
FEZ1
Top
233
35
0.15
60/46
12
Y
FEZ1
Bottom
208
33
0.16
49/33
7
Y
ER
Top
66
6
0.09
29/24
6
Y
ECAD
Top
83
12
0.14
38/29
6
Y
CDH13
Top
147
13
0.09
37/30
6
N
MGMT
Top
115
16
0.14
51/41
5
Y
Gene
Tm, melting temperature; Y, yes; ND, not determined; N, no. aCpG density was calculated by the number of CpG dinucleotides divided by number of nucleotides between primers. bPercent of (G + C) content within the PCR product, for 100% methylated (M) and 100% unmethylated (UM) DNA.
quencing to study the methylation status at CpG island promoters for several genes. Surprisingly, we find that in most genes we analyzed, the amplification efficiency for the methylated DNA, and thus PCR bias, could be affected by changing annealing temperature for PCR, and this effect was independent of primers designed for top or bottom strand DNA. Using a mixing experiment, we find that much of the bias can be resolved by optimizing annealing temperature. Bisulfite-pyrosequencing is a recently developed quantitative technique to detect methylation changes; it relies on bisulfite-induced C to T polymorphisms, which can be detected by a pyrosequencer using a sequencing-by-synthesis method. This technique has the advantages of analyzing several methylation sites, introduces an internal control (DNA sequence including a control for unconverted cytosines), and allows accurate quantitation of multiple CpG methylation sites in the same reaction. There are essentially two steps involved in this technique (i) PCR following bisulfite treatment and (ii) pyrosequencing to measure the degree of methylation at each CpG site within the sequencing region. For primer design, we first identified the region of interest and CpG island for each gene and virtually 50 ı BioTechniques ı www.biotechniques.com
converted the genomic sequence to the bisulfite-treated sequence by replacing all CG with YG (Y stands for C/T), then all remaining C with T. Based on the converted sequences, we used Pyrosequencing™ Assay Design software (Biotage, Uppsala, Sweden) to design both PCR primers and sequencing primers. We tried to avoid CpGs within the primer sequences. If we could not find suitable primers this way, we included CpGs in each primer, but put them in the 5′ end of the primer and synthesized them as Y (C/T) in the forward strand and R (G/A) in the reverse stand. The primer melting temperature (Tm) for PCR was calculated by the nearest neighbor formula, and the optimal annealing temperature was suggested at 55°C. We examined methylation patterns at the CpG island promoters of seven genes, FGF11, LOC388407, FANK1, SOX11, P2RX5, TNFSF7, and FEZ1 in a colon cancer cell line RKO. Bisulfite treatment of 2 μg genomic DNA was performed as previously described (6). After bisulfite treatment, double-stranded DNA (top and bottom strands) are no longer complementary and can be analyzed separately by designing primers to amplify either top strand sequences or bottom strand sequences. For FGF11, LOC388407, FANK1, and SOX11 genes, the PCR
primers were designed for top strand sequences; for P2RX5 and TNFSF7 genes, PCR primers were designed for the bottom strand sequences; and for FEZ1 gene, we designed two sets of PCR primers for both top and bottom strands. PCR product length, CpG density, and GC content within the PCR product are summarized in Table 1. Primer sequences and sequencing regions are shown in Table 2. For PCR amplification, we used a universal biotinylated primer with hot start PCR as previously reported (8). The PCR was carried out in a 50-μL solution containing 2 μL bisulfite-treated DNA, 1× PCR buffer, 1.25 mM dNTPs, 0.1 μM forward primer, 0.01 μM reverse primer with universal overhang, 0.09 μM universal biotin primer, and 1 U Taq DNA polymerase (New England BioLabs, Ipswich, MA, USA). For each assay, three different PCR conditions were performed separately for the same sample by varying annealing temperature at either 50°, 55°, or 60°C. PCR cycling conditions were 95°C for 5 min, followed by 50 cycles of 95°C for 30 s, varying annealing temperature for 45 s, and 72°C for 45 s, and a final incubation at 72°C for 4 min. In order to analyze as many CpG sites as possible, we usually divide PCR products for multiple sequencing and use 10 μL PCR product for pyrosequencing. Vol. 42 ı No. 1 ı 2007
Benchmarks Pyrosequencing was carried out with Pyro Gold reagents and a PSQ™ HS 96 pyrosequencer (both from Biotage), following the manufacturer’s recommendations. The methylation levels at different C sites were averaged to represent the degree of methylation in each gene. All the experiments, including bisulfite treatment, PCR, and pyrosequencing, were done independently at least two times. As shown in Figure 1, at the lowest annealing temperature for PCR (at 50°C), five genes (FGF11, LOC388407, FANK1, FEZ1, and P2RX5) showed moderate methylation (40%–60%) in RKO, and two genes, SOX11 and TNFSF7, showed heavy methylation (78%–80%) in this cell line. Surprisingly, for the five genes with moderate methylation, we observed substantially higher methylation levels when the annealing temperature for PCR increased from
A
B
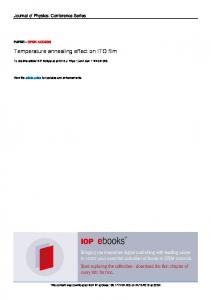
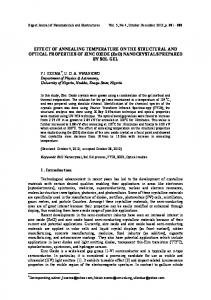
50° to 55° or 60°C, while for those two genes with heavy methylation, we did not see any changes for the measured methylation levels at different temperatures. Figure 2 shows representative pyrosequencing results for single CpG sites of FEZ1 gene. When we analyzed all the C sites individually (Figure 2A shows the pyrograms for 12 CpG sites on the top strand, and Figure 2B shows the pyrograms for 7 CpG sites on the bottom strand), we found that the increased methylation measurement by higher annealing temperature affected all C sites equally, suggesting an effect on allele-specific amplification (PCR bias), and we did not find any strand specificity to this effect that occurred to assays designed for top strands or bottom strands. These results indicate that during PCR amplification, methylated and unmethylated DNA has variable efficiency depending on the
annealing temperature. These results suggested that we could potentially overcome PCR bias in DNA methylation analyses by optimizing annealing temperature. In order to test this hypothesis, we set up a series of mixing experiments for four additional genes, estrogen receptor α (ESR1), E-cadherin (CDH1), O-6-methylguanine DNA methyltransferase (MGMT), and H-cadherin (CDH13). Mixing experiments using different fractions of methylated and unmethylated genomic DNA prior to bisulfite treatment and PCR is the gold standard to detect PCR bias. We selected these four genes because all have typical CpG islands in their promoter regions, and methylation of these genes has been extensively studied in various diseases (10–13). We carefully designed the primers to amplify 100–200 bp regions that are
FEZ1 - Top Strand
FEZ1 - Bottom Strand
Figure 2. Representative pyrograms for FEZ1 gene. (A) PCR primers were designed to analyze the methylation status on the top strand DNA. Two sequencing reactions were performed to measure the degree of methylation at 12 single cytosines. The percentage of methylation is indicated on the top of each site. (B) PCR primers were designed to analyze the methylation of seven CpG sites on the bottom strand DNA. The sequencing reaction was performed on the reverse direction; G peaks indicate methylated cytosine, while A peak indicated unmethylated cytosine. 52 ı BioTechniques ı www.biotechniques.com
Vol. 42 ı No. 1 ı 2007
Benchmarks
ECAD-Universal
Measured Methylation (%)
Measured Methylation (%)
Measured Methylation (%)
SW48 (%)
ESR1-Universal
ESR1-Regular
Measured Methylation (%)
RKO (%)
Measured Methylation (%)
CDH13-Regular
MGMT-Regular
RKO (%)
close to the transcription start site. We also tried to avoid having CpG sites in PCR primers and sequencing primers, and as shown in Table 1, this was successful except for the MGMT gene, for which there was a C site in the 5′ end of the reverse primer, and we synthesized this primer using R (G/A) instead of G in this base. For mixing, we used DNA from peripheral blood leukocytes (PBL) from one healthy male donor as unmethylated DNA and DNA from cancer cell lines that are known to be fully methylated as methylated DNA. We prepared a mixture of unmethylated DNA (PBL) and increasing proportions (0%, 10%, 20%, 30%, 50%, 70%, and 100%) of methylated DNA (from colon cancer cell lines RKO or SW48) before bisulfite treatment. The procedures for bisulfite treatment, PCR amplification, and pyrosequencing were as described before, except for MGMT and CDH13 genes, for which we used directly biotin-labeled reverse primers for PCR. Three different PCR conditions were used for each mixing experiment, and the PCR temperatures for annealing are indicated in Figure 3. As shown 54 ı BioTechniques ı www.biotechniques.com
RKO (%)
RKO (%)
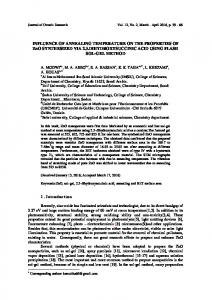
Figure 3. Mixing experiments for four different CpG island promoters. Genomic DNA from fully methylated cell line (SW48 for MGMT and RKO for all the others) and unmethylated peripheral blood leukocytes (PBL) were mixed in varying amounts (0%, 10%, 20%, 30%, 50%, 70%, and 100%) before bisulfite treatment. A series of PCRs using different annealing temperatures were performed using the bisulfite mixture DNA. Each dot represents the average methylation of all CpG sites analyzed in each sample. Each straight line represents the results from different PCR conditions. The annealing temperature used for each PCR is indicated in the right corner of each figure. For ESR1 and MGMT genes, one condition was carried out using touchdown PCR, 58°, 56°, 54°, and 52°C for ESR1 and 60°, 57°, 54°, and 51°C for MGMT. The line labeled “Exp” represents the expected results from the dilution series.
in Figure 3, for each set of primers we observed substantial PCR bias at the lowest annealing temperature. Consistent with previous results, in all cases the bias was toward preferential amplification of unmethylated DNA. By increasing the annealing temperature of PCR, we could overcome PCR bias for all genes, except CDH13. One condition was carried out by touchdown PCR for ESR1 and MGMT genes, 58°, 56°, 54°, 52°C and 60°, 57°, 54°, 51°C, respectively (Figure 3). The purpose of touchdown PCR is to improve the amplification efficiency for methylated DNA in the first few cycles at a relatively high temperature without decreasing the yield of PCR amplification as the annealing temperature drops later. We found that for MGMT gene, touchdown PCR by starting the annealing temperature at 60°C for 5 cycles, gradually decreasing to 57°C for 5 cycles, 54°C for 5 cycles, and finally to 51°C for 35 cycles indeed improved the PCR efficiency for methylated DNA and corrected the PCR bias completely. For ESR1 gene, the touchdown PCR was performed at
58°C for 3 cycles, 56°C for 4 cycles, 54°C for 5 cycles, and 52°C for 38 cycles, and the PCR bias was still observed at this condition. However, straight PCR annealing at 55°C, we were able to correct the PCR bias completely for this gene, suggesting touchdown PCR at higher starting temperatures may be able to overcome the bias as well. In order to test if the dependence of preferential amplification and annealing temperature is due to the primer system, we also analyzed the ESR1 gene using a directly biotinlabeled reverse primer and compared the results with universal primer approach (Figure 3, bottom panel). It is clear from the results that regardless of the primer system, there is a strong bias toward the amplification of unmethylated DNA, and increasing annealing temperature for PCR improved the amplification toward methylated DNA. Interestingly, for the same ESR1 gene in which we were able to overcome the PCR bias using a universal primer approach by PCR at annealing temperature 55°C, we were unable to correct PCR bias completely by performing Vol. 42 ı No. 1 ı 2007
Benchmarks
Table 2. PCR and Pyrosequencing Primers and Assays for Each Gene Gene Primer Sequence 5′-GTTTTGTGGGTGGGGTAG-3′ FGF11 Forward 5′-GGGACACCGCTGATCGTTTACRCTTCTACCRAATCAAACTACTAA-3′ Reverse-Universal 5′-TTTTTGGGGGAGTTTA-3′ Sequencing 5′-GYGYGTTTYGGGYGTTTGTYGGTTTGGGGGTGTT-3′ Assay LOC388407
FANK1
P2RX5
FEZ1-Top
FEZ1-Bottom
SOX11
TNFSF7
ER
CDH13
ECAD
MGMT
Forward Reverse-Universal Sequencing Assay
5′-TGAGGTTTAAGAGGGAATTGT-3′
Forward Reverse-Universal Sequencing Assay
5′-GGGGATGAYGGGGTAAAGT-3′
Forward Reverse-Universal Sequencing Assay
5′-TGTAGGGGTGTTATTGTGTTAG-3′
Forward Reverse-Universal Sequencing-1 Sequencing-2 Assay-1
5′-YGGAGGAAGGTTATGAATGTT-3′
Assay-2
5′-TTYGTTGYGTTGYGTTGYGTTTYGGTYGTTT-3′
Forward-Universal Reverse Sequencing-Reverse Assay
5′-GGGACACCGCTGATCGTTTAGYGGATTTYGGGGTTTAGT-3′
Forward Reverse-Universal Sequencing Assay
5′-AGYGGTTGYGGTTTAAGTATATGGT-3′
Forward Reverse-Universal Sequencing Assay
5′-TGAGGGTTGTTTTGGTTTTAT-3′
Forward Reverse-Universal Reverse-Biotin Sequencing-1 Sequencing-2 Assay-1 Assay-2
5′-TTTTTGGGTTATTTTTAGTAGATT-3′
Forward Reverse-Biotin Sequencing Assay
5′-TTGGGAAGTTGGTTGGTTG-3′
Forward Reverse-Universal Sequencing Assay
5′-GGAATTGTAAAGTATTTGTGAGTTT-3′
Forward Reverse-Biotin Sequencing Assay
5′-TTGGTAAATTAAGGTATAGAGTTTT-3′
5′-GGGACACCGCTGATCGTTTATAACTCCRATTCTCCACAACA-3′ 5′-GTGTGAGTGTAGGGGTT-3′ 5′-TYGAGAGATTTTTAGYGGTTAAGTYGTTYGGATTTTAA-3′ 5′-GGGACACCGCTGATCGTTTAACCCTACCAACAACCCTC-3′ 5′-AGTTAGGTTTATTGGGGA-3′ 5′-YGATAGYGAYGAYGGYGGYGGTT-3′ 5′-GGGACACCGCTGATCGTTTAAATCRAAACRACCTTTTATTAAC-3′ 5′-GAGGAGGAAGAAGAGGTAG-3′ 5′-YGGTAAGGTYGYGGTTTGAGGTTTYGGTG-3′ 5′-GGGACACCGCTGATCGTTTARAATCCCRAAACTCAACC-3′ 5′-GGGGAAGGGGTGGGGTGGA-3′ 5′-GGTTGGTTGGTTGGTTT-3′ 5′-GGYGGGAGYGGAGTYGGGYGTYGTYGGAGTTG-3′
5′-AAATAACRTCCAACTCCC-3′ 5′-TACCAATTAAATAAATACCC-3′ 5′-RAACRCRAACRCRCCCCCRAAACCCRAAC-3′ 5′-GGGACACCGCTGATCGTTTATTTCTTACTAAAACCCTTAAAAATCT-3′ 5′-TTAGTTAGAGTTTAGAGAAG-3′ 5′-AGYGYGGTYGGYGGYGGYGGYGGGAG-3′ 5′-GGGACACCGCTGATCGTTTACTCTCTATATTTTCTTCCCAACTTTT-3′ 5′-TGTTTTGGTTTTATTGGT-3′ 5′-YGYGGGTTTGGTGATTTGTTTYGTGGT-3′ 5′-GGGACACCGCTGATCGTTTACAAAAAACAACTTCCCTAAACTT-3′ 5′-CAAAAAACAACTTCCCTAAACTT-3′ 5′-GGTTATTTTTAGTAGATTTT-3′ 5′-AATTTAGTTTTTATTTAGTA-3′ 5′-YGTGYGTTTTYGTTTTTTGGTYGTG-3′ 5′-GYGAYGATAAGTAA-3′ 5′-ACAACCCCTCTTCCCTACCT-3′ 5′-GGAAAATATGTTTAGTGTAG-3′ 5′-TYGYGTGTATGAATGAAAAYGTYGTYGGGYGTTTTTA-3′ 5′-GGGACACCGCTGATCGTTTATCCAAAAACCCATAACTAACC-3′ 5′-GGAAGTTAGTTTAGATTTTA-3′ 5′-GTTYGTTTTAGTTYGGTTYGATTYGATYGTATTYGG-3′ 5′-AAACAATCTACRCATCCT-3′ 5′-GGAAGTTGGGAAGG-3′ 5′-YGTYGTTYGGTTTGTATYGGTYGAAGGGTTA-3′
Y and R stand for C/T and G/A, respectively.
56 ı BioTechniques ı www.biotechniques.com
Vol. 42 ı No. 1 ı 2007
Benchmarks PCR at the same condition but using a regular biotin-labeled reverse primer, indicating that a higher annealing temperature may be required for the regular primer approach. One possible explanation could be that the universal primer approach (one pair primer contains a tailed universal sequence) provides amplification of tagged fragments, which may reduce primer bias. The reasons increased annealing temperature can improve PCR efficiency for methylated DNA are unknown. After bisulfite treatment, methylated DNA has a higher GC content than unmethylated DNA, which could favor stable secondary structures that alter amplification efficiency. Raising the annealing temperature of PCR could melt these secondary structures and thus correct the lower amplification efficiency of methylated DNA. Unlike the previous report (9), we find that changing PCR conditions, such as annealing temperature, can overcome PCR bias. Our success may be related to several reasons. Pyrosequencing is able to analyze multiple CpG sites within the sequencing range (in our study, the number of CpG sites we analyzed for each gene ranged from 3 to 12 sites) (Table 1), and it is not gel-based, allowing accurate quantification, which is essential for estimating PCR bias. In addition, pyrosequencing uses three primers (PCR primers and sequencing primer), which ensure that unmodified DNA does not serve as a template. Finally, we used hot start PCR, and our assays were designed for shorter products, ranging from 100–300 bp, which may improve the PCR yield. For CDH13 and ESR1 by regular biotin primers, we were unable to correct PCR bias completely by changing the annealing temperature only. It will be interesting to see if we could reduce the bias by modifying other PCR conditions, such as by adding DMSO or betaine. Alternatively, the assay may have to be redesigned. In this study, for positive controls (fully methylated DNA in mixing experiments), we used DNA from two different tumor cell lines instead of SssI-methylated DNA. This is because DNA from cell lines with known complete methylation of a given gene represents a natural positive 58 ı BioTechniques ı www.biotechniques.com
control that is not subjected to the variability of relying on an enzymatic reaction (SssI) to generate an artificial control. We recognize the potential problem of mixing DNA from different sources, but we are not aware of any study showing that DNA preparations affect methylation. Moreover, we have used two different cell lines as positive controls and found similar results. It has also been shown that PCR bias exists both in DNA from tumor cells and SssI-methylated DNA (9). Based on these findings, we anticipate that similar results should apply for SssItreated samples as well. In summary, we found that we can remarkably enhance the amplification efficiency for methylated DNA by increasing the annealing temperature for PCR, and thus overcome PCR bias in quantitative methylation analysis. Based on our results, we highly recommend mixing experiments using varying mixtures of methylated and unmethylated DNA and gradient annealing temperature for PCR to initially set up, evaluate, and calibrate each new assay. ACKNOWLEDGMENTS
We would like to acknowledge Dr. Robert A. Waterland for critical review of this manuscript. This work was supported by the leukemia Specialized Program of Research Excellence (SPORE) Career Development Award (no. 5 P501 Ca100632 03). COMPETING INTERESTS STATEMENT
The authors declare no competing interests. REFERENCES 1. Antequera, F. and A. Bird. 1993. Number of CpG islands and genes in human and mouse. Proc. Natl. Acad. Sci. USA 90:11995-11999. 2. Jones, P.A. and S.B. Baylin. 2002. The fundamental role of epigenetic events in cancer. Nat. Rev. Genet. 3:415-428. 3. Feinberg, A.P. 2000. DNA methylation, genomic imprinting and cancer. Curr. Top. Microbiol. Immunol. 249:87-99.
4. Robertson, K.D. and A.P. Wolffe. 2000. DNA methylation in health and disease. Nat. Rev. Genet. 1:11-19. 5. Issa, J.P. 2000. CpG island methylation in aging and cancer. Curr. Top. Microbiol. Immunol. 249:101-118. 6. Clark, S.J., J. Harrison, C.L. Paul, and M. Frommer. 1994. High sensitivity mapping of methylated cytosines. Nucleic Acids Res. 22:2990-2997. 7. Xiong, Z. and P.W. Laird. 1997. COBRA: a sensitive and quantitative DNA methylation assay. Nucleic Acids Res. 25:2532-2534. 8. Colella, S., L. Shen, K.A. Baggerly, J.P. Issa, and R. Krahe. 2003. Sensitive and quantitative universal pyrosequencing methylation analysis of CpG sites. BioTechniques 35:146-150. 9. Warnecke, P.M., C. Stirzaker, J.R. Melki, D.S. Millar, C.L. Paul, and S.J. Clark. 1997. Detection and measurement of PCR bias in quantitative methylation analysis of bisulphite-treated DNA. Nucleic Acids Res. 25:4422-4426. 10. Issa, J.P.J., Y.L. Ottaviano, P. Celano, S.R. Hamilton, N.E. Davidson, and S.B. Baylin. 1994. Methylation of the oestrogen receptor CpG islands links ageing and neoplasia in human colon. Nat. Genet. 7:536-540. 11. Shen, L., Y. Kondo, G.L. Rosner, L. Xiao, N.S. Hernandez, J. Vilaythong, P.S. Houlihan, R.S. Krouse, et al. 2005. MGMT promoter methylation and field defect in sporadic colorectal cancer. J. Natl. Cancer Inst. 97:1330-1338. 12. Toyooka, S., K.O. Toyooka, K. Harada, K. Miyajima, P. Makarla, J.G. Sathyanarayana, J. Yin, F. Sato, et al. 2002. Aberrant methylation of the CDH13 (H-cadherin) promoter region in colorectal cancers and adenomas. Cancer Res. 62:3382-3386. 13. Paz, M.F., M.F. Fraga, S. Avila, M. Guo, M. Pollan, J.G. Herman, and M. Esteller. 2003. A systematic profile of DNA methylation in human cancer cell lines. Cancer Res. 63:1114-1121.
Received 15 June 2006; accepted 28 September 2006. Address correspondence to Lanlan Shen, Department of Leukemia, M.D. Anderson Cancer Center, Unit 428, 1515 Holcombe Blvd., Houston, TX 77030, USA. e-mail:
[email protected] To purchase reprints of this article, contact:
[email protected]
Vol. 42 ı No. 1 ı 2007