parameters are: 1) mean of the prediction error (MPE), 2) root mean square error. (RMS), 3) average standardized error (ASE), 4) mean of the standardized error.
Sustainable Development, Vol. 1
435
Best applicable geostatistical model for interpolating groundwater-levels in El-Obour city, Egypt D. Elleithy, A. Hassan, M. Hagras & P. Riad Department of Irrigation and Hydraulics, Faculty of Engineering, Ain Shams University, Egypt
Abstract The lack of data, mainly in the field of hydrogeology and groundwater especially, makes it necessary to implement a special estimation technique to overcome this shortage. Nowadays, geostatistics have become a popular mean to describe spatial patterns and to predict the value of unmeasured locations (Kriging). Many types of Kriging could be used such as ordinary, simple, universal Kriging. Each type has a different underlying assumption. The aim of this paper is to put a methodology that could be used for identifying the most suitable geostatistical model for interpolating groundwater-level data collected from District VI, ElObour city using geographical information systems (GIS) to generate a prediction error map with good accuracy that could be used further on designing and/or optimizing the existing monitoring network. The procedure has to 1) build all available geostatistical models depending on Hierarchy Stepwise criteria, 2) compare them using cross-validation statistical parameters, and 3) choose the best suitable model for the study area. It was found that 1) the ordinary Kriging method, 2) fitted with a Gaussian function, 3) of groundwater-level skewed data normalized using Box-Cox with a power parameter equal to 2, and 4) no trend removal, all of them together compose the best matched model for the studied area. Keywords: groundwater-level interpolation, geostatistics, Kriging, geostatistical model comparison, El-Obour, Egypt.
1 Introduction All scientific studies are based on data, so it has to be very adequate with an acceptable accuracy in order to assure success of the study. The lack of data, WIT Transactions on The Built Environment, Vol 168, © 2015 WIT Press www.witpress.com, ISSN 1743-3509 (on-line) doi:10.2495/SD150381
436 Sustainable Development, Vol. 1 mainly in the field of hydrogeology and groundwater especially, makes it necessary to implement some special procedures or an estimation technique to overcome this shortage. One of the main processes that requires data estimation, in studying groundwater, is building numerical simulation models. These models need the data to be known over the study area. Nevertheless, in designing and/or optimizing monitoring networks, it is important to highlight areas which have a shortage in observations, as well as if there is redundancy in the information obtained. Resulting in adding or reducing the number of observations to reach the required accuracy which affect both cost and objective of monitoring. There are two main approaches for estimating the values of unmeasured locations either 1) non-geostatistical methods, 2) geostatistical methods, and 3) combined methods (Li and Heap [1]). Non-geostatistical interpolation approaches creates surfaces from known measured based on the range of similarity or radial basis functions (degree of smoothing), while geostatistical interpolation approaches are based on the statistical properties of the measured points. Geostatistical techniques compute the spatial correlation of the measured points depending on the spatial alignment of the sample points around the predicted location. Geostatistics is held to have originated from the work in mining and geology by the famous mining engineer Danie G. Krige in 1951 (Agterberg [2]). The widely used geostatistical models for groundwater level interpolation is based on Kriging [3, 4]. Kriging provides the best linear unbiased estimation for unmeasured locations with a minimum mean interpolation error, using the model semi-variogram which best fits the measured data with less root mean square error. The parameters of the resulted best-fitted semi-variogram are then being used in Kriging to interpolate groundwater-level and to get the Kriging prediction error where initial measurements has the lowest error and increases as the distance increases between the estimating point and the available data (Li and Heap [1]).
2 Basic principles 2.1 Different Kriging methods Simple, ordinary and universal Kriging are the three common Kriging methods to calculate predicted values Z(s) as shown in eqn (1). Z(s) = + (s) (1) where μ is the mean value while the ε(s) is the error for each point and is a function of s where s is the position of the point. In simple Kriging, μ assumed as a known exact constant and ε(s) is also known exactly for each location. In ordinary Kriging, μ assumed as an unknown constant. In universal Kriging, μ assumed as a variable mean as a function of the distance μ(s) and ε(s) will be obtained assuming that the mean of all the errors will be equal to zero. There is no way to decide, based on the data alone, whether the observed pattern is the result of autocorrelation only (Johnston et al. [5]).
WIT Transactions on The Built Environment, Vol 168, © 2015 WIT Press www.witpress.com, ISSN 1743-3509 (on-line)
Sustainable Development, Vol. 1
437
2.2 Modelling empirical semi-variogram and covariance Simple, ordinary and universal Kriging can use either semi-variograms or covariances as the mathematical form to express auto-correlation as a function of the distance. The spatial correlation variability is described by the semi-variogram and commonly called the structure. The experimental semi-variogram measures the relation of the mean square error between two neighbouring points separated by distance (h) (Shakeel et al. [6]) and eqn (2) shows its calculating formula.
h
1 n( h) [( z ( x h) z ( x)) 2 ] 2n(h) i 1
(2)
where z(x) and z(x+h) are the values of the variable at point (x) and at a point further than (x) by (h) called the lag distance. At the empirical semi-variogram, a theoretical variogram is adjusted based on the principle that Kriging re-evaluates correctly the measurements at the observation points [7, 8]. Semi-variogram or covariance fitting (modelling) is a very important step between the spatial data description and spatial data prediction, so choosing the best fitting function will impact directly on the prediction of the unknown values. Some examples of the functions that could be used in fitting are: 1) Circular, 2) Spherical, 3) Tetra-spherical, 4) Penta-spherical, 5) Exponential, 6) Gaussian, 7) Rational quadratic, 8) Hole Effect, 9) K-Bessel, 10) J-Bessel, and 11) Stable. 2.3 Cross-validation It is done by removing one or more data locations and predict their values using the rest of the data, then comparing the predicted value to the observed value obtaining statistical parameters to identify the quality of the model. These parameters are: 1) mean of the prediction error (MPE), 2) root mean square error (RMS), 3) average standardized error (ASE), 4) mean of the standardized error (MS), and 5) root mean square standardized error (RMSS). n
MPE
(Z
*
i 1
( s i ) Z ( s i ))
n
(Z
RMS
*
i 1
( si ) Z ( si )) 2
ASE n
(Z
*
i 1
*
i 1
( si )
(5)
n
( s i ) Z ( s i )) / * ( s i )
(6)
n n
RMSS
(4)
n n
MS
(3)
n
(Z
*
( si ) Z ( si ))
i 1
( si )
2
*
n
WIT Transactions on The Built Environment, Vol 168, © 2015 WIT Press www.witpress.com, ISSN 1743-3509 (on-line)
(7)
438 Sustainable Development, Vol. 1
3 Case study 3.1 Description of the study area El-Obour City is a new residential city in El-Qalyubia Governorate, about 35 kilometres northeast of Cairo Governorate and on the eastern side of Nile Delta (fig. 1) with approximately total area of 54.3 km2. District VI lies in the centre of the city, with total area of approximately 3.1 km2 (almost 6% of the whole city). The topography of the district is shown in Fig. 2.
Figure 1:
Figure 2:
District VI, El-Obour City, El-Qalyubia Governorate, Egypt.
a) The topography through District VI; b) boundaries of Aquifer A and c) groundwater-level observation wells spatial distribution, generated using GIS by Researcher in 2015.
The geological formations of El-Obour belong to the quaternary and tertiary zone and they present a series of Sand dunes and alternating clay and gravel layers. Most of the western delta area is covered with sand dunes overlying a very old Nile Delta deposits. The soil formation of this area is very heterogeneous. After studying the geological formations in this District, it was found that it is divided into 1) Deep confined aquifer underneath the whole area (Aquifer B), 2) the top most unconfined aquifer which almost covers the whole surface, and finally 3) a confined aquifer in the middle, but started to exist in the south area of the district only (Aquifer A) (as shown in fig. 3). Aquifer A in District VI in El-Obour City is chosen to be the study area with an area of 1.4 km2. This area contains a total of 237 well, but there are 39 well WIT Transactions on The Built Environment, Vol 168, © 2015 WIT Press www.witpress.com, ISSN 1743-3509 (on-line)
Sustainable Development, Vol. 1
Figure 3:
439
General side view of cross-section through the aquifers formation in District VI showing the main and the estimated extension of the lithology depending on the rest cross-sections behind it, generated by GMS by researcher in 2015.
fully penetrates aquifer A and crosses it to penetrate aquifer C, therefore, only a total of 198 well observing its groundwater-level. Groundwater-level is observed periodically over the time through the whole area, since implemented in December 2008. Data used in our study have been chosen through a statistical and experimental process resulting of choosing the groundwater-level data collected in February 2011 (Researcher 2015). The data are collected from 165 wells only as the rest of the wells were either pumping well or not accessible, and 8 wells were removed from the data as they were expressing outliers through the well’s history (Researcher 2015), 3 more wells measurements were removed as found to be outliers by statistically analysing February 2011 data. Therefore 154 wells readings will only contribute in our study, which are spatially distributed randomly as shown in fig. 2. All these data are derived from a project developed by the Division of Hydraulics and Environmental Engineering, Engineering Consultancy Centre of the Ain Shams University aiming for solving groundwater-level rise through ElObour area, improving the management and Following-up post-implementation. In order to continue with the water level measurements, the observation network had to be evaluated and possibly reorganized aiming to enhance the understanding of the aquifer system.
4 Method 4.1 Introduction The proposed procedure involves a number of different analyses of the available data (estimation error, cross-validation) in order to estimate the groundwater-level and generate maps with acceptable accuracy. The geostatistical (Kriging) model has many parameters that should be covered during building the model, so one should know: 1) if the data fits a normal distribution or need to be normalized (transformed), 2) if the data was affected by any external factors that makes the artificial trend through the measurements, 3) the most suitable method to be used in the study, and finally, most important WIT Transactions on The Built Environment, Vol 168, © 2015 WIT Press www.witpress.com, ISSN 1743-3509 (on-line)
440 Sustainable Development, Vol. 1 step, 4) knowing which function suits more the empirical semi-variogram of the data. Some of these parameters could be very tricky. Nevertheless, the variables inside each parameter makes it more difficult and fussy. In fig. 4, each parameter has been expanded to show how many variables are inside, as well as the variety of routes one could take through building up a model, and it is around 297 different route only if you know which exact Box-Cox power parameter to be used in normalizing the data and if not it could reach more than 1000 different rout. This study comes up with a methodology in order to make it a bit easy and straightforward in choosing the best model, and applying it on the case study data. This methodology depends on narrowing the space of choices by dividing the study into different steps with a special sequence, we could denote it by Hierarchy Stepwise criteria. 4.2 Methodology Various models are built from the three different Kriging methods with fixed semivariogram function, resulting the best Kriging method. Afterwards, using the resulted method with all eleven different semi-variograms functions to indicate which function will fit the physical conditions of the groundwater-level data in the study area. Consequently, the resulted combination of the chosen method and the semi-variogram model with all data transformation available and then with all external trend assumptions. Spatial variation of the data in this study considered as a uni-variate and did not study the multi-variance or correlation between it and the hydrogeology or the topography of the system. Also, the spatial interpolation methods covered in this study are only those commonly used or cited in environmental studies. As such, the list of the methods in this study is not an exhaustive one. The interpolation was done using Geostatistical Analyst in ArcGIS program, obtaining all statistical data for the model using the cross-validation comparison.
5 Results and analysis 5.1 Models comparison and selection Cross-validation is used to compare between all models. Cross-validation represent the statistical properties of the predicted surface in the form of graphs and qualitative statistical parameters, which makes it easy for representing the accuracy of the predicted data, by comparing the main measured values and the predicted values using the model (ESRI [9]). Mean prediction error (MPE), root mean square of the predicted error (RMS), mean standardized (MS), root mean square standardized (RMSS) and average standard error (ASE) is the main parameters that obtained from such process. According to Johnston et al. [5] and Schroeder [10], The criteria used in comparing different models are based on finding which of the models bitterly fits in the following: 1) ASE is close to RMSE by checking the difference between them, 2) smallest RMS, 3) MS nearest to zero, 4) RMSS nearest to 1, and 5) smallest MPE. WIT Transactions on The Built Environment, Vol 168, © 2015 WIT Press www.witpress.com, ISSN 1743-3509 (on-line)
Figure 4:
All models that could be built using Kriging and the methodology used in this study.
Sustainable Development, Vol. 1
WIT Transactions on The Built Environment, Vol 168, © 2015 WIT Press www.witpress.com, ISSN 1743-3509 (on-line)
441
442 Sustainable Development, Vol. 1 5.1.1 Kriging models The basic model is built for the three different Kriging methods; simple, ordinary and universal. Table 1 shows the result of the cross-validation and a simple comparison between the ordinary, simple and universal Kriging, we could conclude easily from that table that ordinary Kriging has the least RMS; the MPE and MS values are the closest to zero; the smallest difference between RMS and ASE; and the closest RMSS value to one. Table 1:
Simple comparison between different Kriging methods using crossvalidation statistical parameters.
MPE RMS MS RMSS ASE RMS-ASE Min. RMS MS≈0 RMSS≈1 MPE≈0
Ordinary 2.162 0.591 1.816 0.987 0.597 6.613 0.591 1.816 0.013 2.162
m (*10-3) m (*10-3) M m (*10-3) M (*10-3) m (*10-3)
Kriging methods Simple Universal -3.847 -2.583 0.595 0.596 -11.203 -6.728 0.921 0.981 0.635 0.605 39.908 8.829 0.595 0.596 11.203 6.728 0.079 0.019 3.847 2.583
Thus, the ordinary Kriging model affords the most unbiased prediction, prediction values which are very close to the observed (measured) values, and the most validated model. Nevertheless, universal Kriging came in the second place and last, the simple Kriging. 5.1.2 Semi-variogram models for ordinary Kriging Subset models are built with ordinary Kriging method using all the possible functions for fitting the semi-variogram. Table 2 shows the cross-validation results from each model using ordinary Kriging as a simple comparison. Although, it is not clear using the simple comparison only for recognizing which semi-variogram model will fit our data better. A more advanced method is used in comparing these models, by giving each model an index to make the ranking process and decision easier. The researcher developed eqn (8). As a simple function to be used in calculating an index for each model, giving each one a percentage depending on its ranking in each parameter. 1
r
m
I m 100 * (1
( p) n
n
n * ( R 1)
)
(8)
where r is a simple ascending ranking, n is the total number of the calculated crossvalidation statistical comparison parameters, m is the model, and p is the parameter to be ranked, but using this method assumes an equal share of all comparison parameters in the decision making.
WIT Transactions on The Built Environment, Vol 168, © 2015 WIT Press www.witpress.com, ISSN 1743-3509 (on-line)
WIT Transactions on The Built Environment, Vol 168, © 2015 WIT Press www.witpress.com, ISSN 1743-3509 (on-line)
Advanced comparison
Parameter ranking
Models’ comparison
Cross-validation statistical parameters
Advanced comparison
Parameter ranking
Models’ comparison
C 0. 504 0.607 -0.876 0.902 0.671 6.373 0.607 0.876 0.098 0. 504 6 11 1 6 1 60
Sph 2.158 0.605 1.688 0.888 0.680 7.409 0.605 1.688 0.112 2.158 7 9 2 8 2 54
T-Sph 2.206 0.605 1.776 0.882 0.684 7.861 0.605 1.776 0.118 2.206 9 8 4 9 5 40
P-Sph 2.192 0.605 1.733 0.880 0.685 8.035 0.605 1.733 0.120 2.192 10 7 3 10 4 42
Ordinary Kriging fitting functions Exp G R-Q 15.265 2.162 17.148 0.606 0.591 0.602 20.403 1.816 22.537 0.894 0.987 0.863 0.682 0.597 0.701 7.553 0.661 9.916 0.606 0.591 0.602 20.403 1.816 22.537 0.106 0.013 0.137 15.265 2.162 17.148 8 3 11 10 3 6 10 5 11 7 4 11 10 3 11 20 74 10 H-E 3.617 0.581 4.890 1.014 0.573 0.875 0.581 4.890 0.014 3.617 5 1 9 5 9 52
K-B 2.280 0.594 1.971 1.009 0.587 0.652 0.594 1.971 0.009 2.280 4 5 6 3 6 62
B1 2.160 0.591 1.816 0.987 5.973 6.614 0.591 1.816 13.462 2.160 2 10 2 4 1 72
B2 2.611 0.590 2.104 0.995 5.881 1.783 0.590 2.104 5.538 2.611 1 9 3 2 3 74
B3 2.665 0.589 2.713 1.004 5.795 9.930 0.589 2.713 3.863 2.665 4 8 4 1 4 68
B4 3.055 0.589 3.320 1.001 5.738 14.888 0.589 3.320 9.598 3.055 6 7 5 3 5 58
Data Normalization B5 B6 3.464 3.831 0.588 0.587 3.951 4.527 1.014 1.017 5.700 5.678 18.154 19.710 0.588 0.587 3.951 4.527 14.142 17.449 3.464 3.831 9 10 6 5 6 7 5 6 6 8 46 38
B7 4.103 0.587 5.005 1.020 5.672 19.738 0.587 5.005 19.889 4.103 11 4 9 8 10 26
B8 4.198 0.586 5.248 1.021 5.687 17.740 0.586 5.248 20.652 4.198 8 3 11 10 11 24
B9 4.053 0.586 5.201 1.020 5.721 13.794 0.586 5.201 20.041 4.053 5 2 10 9 9 40
Simple comparison for ordinary Kriging using all different transformation process.
Parameter Units MPE m (*10-3) RMS m MS (*10-3) RMSS ASE M RMS-ASE m (*10-2) RMS M MS≈0 (*10-3) RMSS≈1 (*10-3) MPE≈0 m(*10-3) RMS-ASE RMS MS ≈ 0 RMSS ≈ 1 MPE ≈ 0 Index (%)
Table 3:
Parameter Units MPE m (*10-3) RMS m MS (*10-3) RMSS ASE M RMS-ASE m (*10-2) RMS M MS≈0 (*10-3) RMSS≈1 MPE≈0 m(*10-3) RMS-ASE RMS MS ≈ 0 RMSS ≈ 1 MPE ≈ 0 Index (%)
B10 3.591 0.585 4.789 1.018 5.776 7.753 0.585 4.789 18.020 3.591 3 1 8 7 7 58
J-B 2.859 0.584 3.343 1.003 0.581 0.273 0.584 3.343 0.003 2.859 2 2 8 2 8 66
Log 2.237 0.591 1.785 0.978 6.082 16.816 0.591 1.785 22.445 2.237 7 11 1 11 2 46
S 2.453 0.592 2.245 1.001 0.590 0.221 0.592 2.245 0.001 2.453 1 4 7 1 7 70
Simple comparison for ordinary Kriging using all different semi-variogram functions showing cross-validation statistical parameters.
Cross-validation statistical parameters
Table 2:
Sustainable Development, Vol. 1
443
444 Sustainable Development, Vol. 1 Models with index value closer to 100 % has better ability to suit the spatial data. This method starts with giving a unique rank for each cross-validation statistical comparison parameter in ascending order for all the available models in this case from 1 to 11. Table 2 also shows the ranking and calculated indices (I) for each model. From that table it is clear that Gaussian is the most suitable model for that groundwater-level interpolation in the study area. Sample of model index calculation for circular model (C), applying in eqn (8): I Crircular 100 * (1
(6 11 1 6 1) 5 ) 60% 5 * (11 1)
5.1.3 Trends and data transformation The trend removal and data transformation (normalization) were applied to the chosen geostatistical model, i.e. ordinary Kriging (OK) model fitted with Gaussian function. Different processes are used Box-Cox with different power parameter from 1 to 10, and log (ESRI [11]). Table 3 shows the cross-validation results. These processes used in case of any skewed data. As well as table 4 shows the comparison between models before and after data transforming. Also, trends could fit first degree, second degree or third degree polynomial functions. After the trend is identified, it will be removed from the data, thus applying the model only on the residuals (the comparison is shown in table 5). Table 4:
Simple comparison between data transformed using Box-Cox with power parameter=2 and no transformation process. MPE RMS MS RMSS ASE RMS-ASE RMS MS≈0 RMSS≈1 MPE≈0
Table 5:
m (*10-3) m (*10-3) M m (*10-3) M (*10-3) (*10-3) m (*10-3)
No transformation 2.162 0.591 1.816 0.987 0.597 6.613 0.591 1.816 13.462 2.162
B2 2.611 0.590 2.104 0.995 0.588 1.783 0.590 2.104 5.538 2.611
Simple comparison for ordinary Kriging using all different trend removal types. MPE RMS MS RMSS ASE RMS-ASE RMS MS≈0 RMSS≈1 MPE≈0
m (*10-3) m (*10-3) M m (*10-3) M (*10-3) (*10-3) m (*10-3)
No trend 2.162 0.591 1.816 0.987 0.597 6.613 0.591 1.816 13.462 2.162
Second 3.323 0.596 3.285 0.963 0.617 21.372 0.596 3.285 37.434 3.323
WIT Transactions on The Built Environment, Vol 168, © 2015 WIT Press www.witpress.com, ISSN 1743-3509 (on-line)
Third 4.034 0.599 4.537 0.995 0.601 1.242 0.599 4.537 4.811 4.034
Sustainable Development, Vol. 1
445
5.2 Chosen model From all the previous comparisons, the most suitable model to be chosen for our groundwater-level data will be ordinary Kriging with Gaussian fitting function, transforming data using Box-Cox with power parameter equal to two and the data does not subjected to any external trends. 5.2.1 Model characteristics As previously discussed, there are parameters that identify the Kriging model such as Kriging method, transformation parameters, fitting function, Nugget, Sill, Range, and lag size. Summary of the exact model parameters chosen: 1) Kriging method: ordinary Kriging, 2) transformation using Box-cox power parameter 2, 3) no trend, and 4) fitting function: Gaussian, 5) model equation as shown in eqn (9), and 6) lag size of 73 m. 446.54 * Nugget + 1454.7 * Gaussian(5 84) (9) 5.2.2 Model statistical analysis After applying the model on the groundwater-level measurements, the statistical parameters resulting from the model are summarized in table 6. Table 6:
Chosen Model
Simple comparison for ordinary Kriging using all different trend removal types. MPE m (*10-3) 2.162
MS (*10-3) 1.816
Root mean square Prediction Standardized m 0.5906 0.9865
ASE m 0.5973
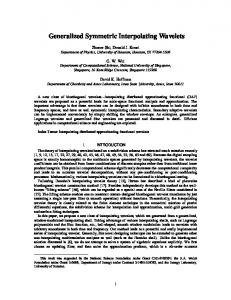
5.3 Model outputs Groundwater-level elevations through the study area as shown in fig. 5a) and the mean square error through the study area in the form of a prediction standard error map as in fig. 5b).
Figure 5:
Shows two generated maps: a) groundwater-level isoline map, b) prediction error map; through District VI, El-Obour city.
WIT Transactions on The Built Environment, Vol 168, © 2015 WIT Press www.witpress.com, ISSN 1743-3509 (on-line)
446 Sustainable Development, Vol. 1
6 Conclusion It is concluded that the use of the Gaussian fitting function with ordinary Kriging model is the most suitable for the District VI, El-Obour area. However, universal Kriging models can give nearly the same groundwater-level surface maps, also using the stable and j-bassel fitting functions with ordinary Kriging will gives groundwater-level maps with an acceptable accuracy. Therefore, groundwaterlevel values that cannot be observed can be adequately described by these models which are required for the groundwater system planning and management in this region.
References [1]
Li, J. & Heap, A.D., A review of spatial interpolation methods for environmental scientists, Canberra: Geoscience Australia, Vol 137, 2008. [2] Agterberg, F.P., Georges Matheron-Founder of Spatial Statistics. Earth sciences history, 23(2), pp. 205-334, 2004. [3] Nunes, L.M., Cunha, M.C. & Ribeiro, L., Groundwater monitoring network optimization with redundancy reduction. Journal of Water Resources Planning and Management, 130(1), pp. 33-43, 2004. [4] Yang, F., Shu-you, C., Xing-nian, L. & Ke-jun, Y., Design of groundwater level monitoring network with ordinary kriging. Journal of Hydrodynamics, Ser. B, 20(3), pp. 339-346, July 2008. [5] Johnston, K., Ver Hoef, J.M., Krivoruchko, K. & Lucas, N., Using ArcGIS geostatistical analyst, Redlands: ESRI, 2003. [6] Shakeel, A., Sreedevi, A.N. & Perrin, J., Optimizing Groundwater Monitoring Network In Highly Heterogeneous Aquifers Using Geostatistics: Technique Development With A Few Case Studies. Proc. of the 3rd Int. Conf. On Water Resources and Arid Environments and the 1st Arab Water Forum, Saudi Arabia, 37, 2008. [7] Journel, A.G. & Posa, D., Characteristic behavior and order relations for indicator variograms. Mathematical Geology, 22(8), pp. 1011-1025, 1990. [8] Theodossiou, N. & Latinopoulos, P., Evaluation and optimisation of groundwater observation networks using the Kriging methodology. Environmental Modelling & Software, 21(3), pp. 991-1000, July 2006. [9] Performing cross-validation and validation. ESRI Web Site, 2014. http://resources.arcgis.com/en/help/main/10.1/index.html#/Performing_cro ss_validation_and_validation/003100000059000000/. [10] Schroeder, J.F., Surface representations of Rainfall at Small Extents: A Study of Rainfall Mapping Based on Volunteered Geographic Information in Kona, Hawaii, PhD diss., University of Southern California, 2013. [11] Box-Cox, arcsine, and log transformations. ESRI Web Site, 2014. http://resources.arcgis.com/en/help/main/10.1/index.html#/Box_Cox_arcsi ne_and_log_transformations/00310000000s000000/.
WIT Transactions on The Built Environment, Vol 168, © 2015 WIT Press www.witpress.com, ISSN 1743-3509 (on-line)