Full paper
Best Practice Assessment methods for evaluating an individual’s performance in group work. Kim Hagen
Michael Verhaart
Owen Giles
Eastern Institute of Technology, Hawke’s Bay, NZ
[email protected]
ABSTRACT A problem faced by many in education is that of assessing group work where the end grade is to be attributed to an individual, since the group mark may not reflect the level of contribution or achievement of each individual student. This paper discusses alternative methods for assigning an individual mark in group work and analyses results from students that have attempted base mark adjusted and task splitting methods. Intuitively it is believed that assessing student work using a task splitting model would produce fairer results over the base mark adjusted method. In order to test the hypothesis, two questions will be considered; “does a student’s grades in group assessments correlate to their final grade in all other courses?”, and “does a student’s grade in group assessments correlate to their grades in individual assessments for the same course?” Answering these questions will give indications as to how well the assigned grades reflect the student’s typical level of achievement and therefore which of these methods worked best in practice.
Keywords Assessment, group
1. INTRODUCTION There are many reasons why an assessment is set in a group context. These can include situations where a project is too large to be effectively produced by a single individual in the time allocated or covers a diverse range of topics, or where the course learning outcomes include group work. Bachelor of Computing Systems (BCS) students at the Eastern Institute of Technology (EIT) are required to work in groups to complete assessment for which they are awarded individual grades, some of which comprise a significant part of the student’s final grade for that course. One of the concerns regard-
ing group work is whether the student’s grade for a group assessment accurately reflects their achievement in that course, or whether they were aided or disadvantaged by other members of their group in a way that lead to an “unfair” grade being awarded. Different methods of assigning individual grades to group assessments are used on different courses, and the researchers aim to investigate the comparative efficacy of two methods used, as well as their overall efficacy when the grades awarded to a student for group assessments are compared with that student’s individual assessments for the course and overall grade for all other courses. Other methods suggested by the literature are also identified.
2. GROUP BASED ASSESSMENT METHODS 2.1 Reasons for Group Work Kennedy (2005) questions the worth of group assessments, and his study indicates that group work may actually detract from the attainment of course objectives. However the majority of research views group work as highly beneficial to students. As well as allowing more difficult and realistic projects to be tackled, there are many educationally sound reasons for using group-based assessment activities, and the value of group work is well established. Lewis (2002) cites the Hadow Report of 1931 and Plowden Report of 1967 that both recognise the benefits of group work in education. Group work can provide a more interesting and effective learning context than traditional lectures and 113
helps the student to learn how to work as a team, which is recognized as essential in business today (Cheng & Warren, 2000) and “often required or considered desirable by employers” (Clarke et al., 2005, citing Hagan, 2004). Parsons (2004) citing Bourner et al (2001), notes that group work can provide “a vehicle through which students can be involved in deep learning, developing their skills experientially contributing to the skills they will need for life long learning”. In addition, several authors (Cheng & Warren, 2000, McLoughlin, 1996 and Lewis, 2002) note how with group interactions produce new understandings for the participants, in accordance with Vygotsky’s theories (1978, 1981).
2.2 Problems with assigning an individual grade for group work
114
If it is decided that assessment will be groupbased the practitioner is confronted with the problem of assigning a grade to an individual student based not on their own effort but on that of the group as a whole. Parsons (2004) emphasises that “a fair mark for a given student should reflect the individual’s effort and abilities”. However, as she points out, “when students are assessed on work performed as a group it can be extremely difficult to determine the exact contribution of each group member”. Comins, et al. (1999) also highlight the issue of fairness in group assessment. For a variety of reasons, this can lead to the problem of awarding grades that do not accurately reflect the individual student’s level of achievement in that assessment. A problem commonly discussed, and perhaps one of the most annoying to both group members and teachers, is that of “free-riders” - students who “do not participate to the best of their abilities” (Bartlett, 1995), and sometimes contribute little or nothing at all (Cheng & Warren, 2000). Freeriders lead to inequity in two ways; by reducing the overall mark of the group and/or by “getting higher grades than they deserve” (Bartlett, 1995), as well as possibly de-motivating the entire group (Cheng & Warren, 2000). Other reasons for an unequal contribution include students “who have made an effort but whose quality of work input still falls short of the overall quality of the final group product and the grade awarded, or students whose contributions
in terms of both effort and input have amounted to more than the mark or grade awarded to the total group work.” (Cheng & Warren, 2000). The difficulty of collecting group contribution data can also be a significant problem. Recent research by Clarke, et al. (2005) and Hamer, et al (2005) in automated systems for collecting and analysing group data seek to address this issue.
2.3 Methods for assigning an individual grade for group work The phenomena of inequal contributions and/or inequal quality of contributions among group members is well-recognised by both staff and students (Lejk, Wyvill, & Farrow, 1999). Leung (1998) notes by way of example that the Hong Kong University requires all contributions to group assignments to be determined and assessed individually. Parsons (2004) identifies a variety of methods of assigning individual grades for group work that have been proposed, including equal marks, task splitting, pools of marks, base mark adjusted (plus or minus a contribution mark), multiplication by a weighting factor, holistic peer assessment and separation of process and product. While methods which involve the teacher to determine the contribution of each group member have been proposed (Earl 1986, cited in Cheng & Warren, 2000), most involve feedback from group members (Parsons, 2004). In addition, Clark et al. (2005) cite several studies which propose the use of a combination of methods to provide more accurate information and differing perspectives, as well as reducing the effect of the difficulties involved in peer assessments.
2.4 Difficulties with using peer assessments Difficulties that could arise from asking students to assess the contribution of their peers can be readily identified. Apart from dishonesty, which Leung (1998) attempts to address mathematically, Parsons (2004) notes problems caused by misunderstanding how to provide ratings (for example confusing “effort” and “contribution”), differing perceptions or disagreements between raters, being unwilling to give a poor rating and refusal to rate the group by assigning everyone
an even mark. Parsons (2004) suggests ways of dealing with some of the issues, but even with these difficulties, peer assessment is still seen as useful. Leung (1998) comments that “students are well aware of the contribution made by everyone in their groups” – information which can be used to help in assessing an individual and that is usually not accessible to the lecturer (Cheng & Warren, 2000). An additional beneficial effect of peer assessment is to “alert the students to the expectations both of the teacher and their group members in terms of their contributions to team work even before they embark on the group assignment.” (Cheng & Warren, 2000).
2.5 Base mark adjusted Several methods propose assigning an individual the “group” grade for the submitted work, then adjusting the grade based on the individual’s contribution. Various complementary methods for assessing the contribution have been proposed in the literature. Leung (1998) proposes asking students for the percentage contribution of each group member and using least-square method of estimate individual contribution. Parsons (2004) also discusses this method, chosen as it seemed more “holistic” than scientific, with the intention of making feedback simpler for students. Cheng and Warren (2000) highlight several sources which recommend using multiple ratings to give a more reliable rating, and several studies, including Parsons (2004), discuss rating contribution based on factors such as contribution to different tasks. Comins et al. (1999) describe a system where students submit a review as a group, and a separate review from the individuals within the group. Different studies using either the holistic method or the multiple-ratings methods to adjust the base mark have found both to be more indicative of contribution than the base mark alone (Cheng & Warren, 2000; Lejk et al., 1999; Parsons, 2004) by providing a wider spread of marks. Parsons (2004) adds a note of caution that students need to feel that the contribution component leads to a “fairer” result in order for these
methods to be effective, and Comins et al (1999) felt that their method should only be used for assessments with a weighting of up to 25% of the final grade.
2.6 Task Splitting A second type of group assessment described by Clarke et al (2005), is task splitting, in which the assessment is broken down into sections. The context of the assessment is based on a collaborative “information system” but students develop and submit different modules individually. Some general parts of the assessment, such as the body of the report may be assessed as a group.
3. STUDY OF “FAIRNESS” OF TWO ASSESSMENT METHODS 3.1 Methods studied 3.1.1 Base mark with adjustment group assessment: Systems Analysis and Design Over the past three years the Systems Analysis and Design (SAD) course has used a projectbased assessment that is awarded a group mark which is then adjusted based on group feedback of the individual’s contribution. The project makes up 40% of the students’ final grade, the other components being an individual test (20%) and individual exam (40%). Students are given a case study of a small business requiring a new information system, and required to undertake the system analysis and design tasks that would be involved in developing that system. This includes preparing a Project Charter, creating Data Flow and Entity Relationship Diagrams and screen and report design. After the projects have been submitted, but before the students are made aware of the results, all group members are asked to complete an evaluation form asking the student to assess for each group member (including themselves) the percentage of the team’s total effort that was contributed and rate the group member’s preparation, participation and reliability. The following Lickert scale is provided: 1 = consistently poor 115
2 = usually poor 5 = ok 9 = usually excellent 10 = consistently excellent Individual marks may be adjusted by +/- 5% based on the feedback and discussion with the group. This method is easy to administer, involves less marking (as there is only one submission per group) and is also thought to encourage group cohesion.
Table 1 : DBMS Project Assessment weightings
Description
Overall Weight
Proposal Planning and Logical design Physical design and Implementation
5 15
Group Weight .3 .3
35
0
Demonstration
5
.5
evenly between the individual and group a half. Table 1 summarises the project assessments and 3.1.2 Task splitting group assessment: their weightings. Database Management Systems At each stage students include a peer review Over the past three years the Database Man- based on that developed by Comins, et al. (1999) agement Systems (DBMS) course has used a to enable the group contribution to be adjusted. project which can is broken into parts that can be completed individually, but the underlying 3.2 Questions structure is in a group context. It contains two Two specific questions were chosen as indicamajor assessments; the project (60%) and final examination (40%). The project is submitted by tions of the “fairness” of the methods studied: 1. Does a student’s grades in the group asstudents in four parts; proposal, planning and logsessments correlate to their overall grade in all ical design, physical design and implementation and a demonstration. In the project assessment their other papers? there are group and individual components. 2. Does a student’s grades in group assessFor the proposal students were asked as a ments correlate to their grades in individual group to identify a problem suitable for DBMS assessments for the same course? solution in a given context, and the group marks These questions will give an indication into for this make up one third of this assessment’s how well the grade for the group assessment total. Individuals in the group then had to each reflects the student’s typical level of achieveidentify and document a sub-system and identify ment, giving an insight into group assessment entities and constraints for that sub-system. They best practice. were also required to research existing systems Intuitively it was believed that assessing and provide a discussion. student work using a task splitting model would The planning and logical design assessment produce fairer results over the base mark plus or also had one third of the marks allocated for minus contribution mark model. the group. In this assessment the group had to produce documentation for the enterprise, an 3.3 Survey methodology integrated Entity Relationship Diagram (ERD) The following analysis compares results from and some preliminary design for any common the fully group assessed work with those obtained forms or reports. Individuals were required to from the task split group assessment, and in order analyse data requirements for their sub-system, to produce a comparative study only students discuss some use cases, design sample forms and who attempted both subjects were considered. In reports, and produce a detailed ERD for their order to address the issue of academic maturity sub-system. (where a student’s performance improves as they The physical design and implementation was progress) and differing performance in differing an individual effort, but the back-end database years the sample was limited to courses of the was shared by all the group. same level as the courses being studied (level Finally marks for the demonstration was split 6) and limited to a two-year range. The choice 116
of level 6 papers should also provide a filtering mechanism for students of wildly varying abilities and minimise issues related to newness to tertiary study, as all students should have achieved papers at level 5. Students selected for the sample were previously or currently enrolled in the Institute’s Bachelor of Computing Systems (BCS) Degree programme, and undertook the Systems Analysis and Design (“SAD”, ITSD6.340) and Database Management Systems (“DBMS”, ITDB6.200) courses in 2003 and 2004. After gaining ethical approval, historical student results were selected for the survey from the existing results database for 2003 and 2004. In total the combined SAD and DBMS papers produced 218 individual results. Results where students had withdrawn from the class or had redone the class were removed, and in instances where a student repeated the course, the highest grade only was used. Students that did just SAD or just DBMS were then removed, giving a final total of 29 students out of an initial group of 60. Once students had been selected, their grades for individual assessments within each paper were tabulated, as were their final results in other papers attempted in the 2003 and 2004 period. The following statistics were then calculated; An overall grade for all assessments. This was calculated as the average of the students’ final marks in all papers completed in the time period, exclusive of the final marks for DBMS and SAD. The individual work mark. For DBMS this was the mark in the Final Exam; for SAD this was the average of the marks in the test and final exam. The group work mark. For DBMS this was the average of the Project Assessments and for SAD this was the Project grade. To protect the privacy of the students the tabulation task was separated from the analysis task, and student name and their institute identifier were removed.
petence of the individuals within that group?” (Lejk et al., 1996). One of the techniques for assessing this is to look at the relationship between each student’s group work mark and their marks for individual work for the same course. This statistic is only valid to the extent that the individual assessment is directly comparable to the group assessment. It is simplistic to suggest that a student would perform at the same level regardless of the assessment activity. Nonetheless, it is informative to consider the correlations between the individual and group work for courses using the various methods. The other comparison made is between the student’s group work mark and their final marks for all other papers (excluding the SAD and DBMS courses), which addresses some of the issues of differing performance in differing courses.
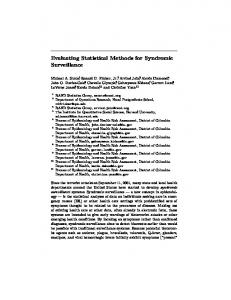
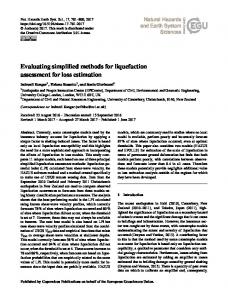
3.4.1 Comparison of group work marks in a course to overall marks The first analysis compared students’ group work marks in the respective courses, to their overall marks. The results showed a correlation between students’ course group work marks and their overall marks. Figure 1 is a scatter plot of students’ SAD group work mark and their overall mark, showing the regression line, with the overall mark as the explanatory variable. It shows evidence of a relationship between a student’s group work mark and their overall mark. Using Pearson’s Correlation Coefficient there is some evidence of a correlation between students’ group work mark and their overall mark (P = 0.021 ). Figure 2 is a scatter plot of the students’ DBMS group work mark and their overall mark, showing the regression line, with the overall mark as the explanatory variable. Figure 2 shows a clear relationship between students’ DBMS group work mark and their overall mark. Using Pearson’s Correlation Coefficient there is again strong evidence of a correlation between students’ DBMS group work mark and their overall mark (P < .0005). The variance between the range of SAD group 3.4 Survey results and analysis work marks, the range of DBMS group work A question asked of group assessments is marks and the range of overall marks was then whether “the marks for the product produced by analysed, with the results shown in table 1. the group can be validly used to infer the com-
117
Figure 1 : Scatter plot of SAD Group Mark vs. Overall Mark.
Figure 2 : Scatter plot of DBMS Group Work Mark vs. Overall Mark.
118
There is some variation between groups. Using Tukey-Kramer at 95% Confidence Intervals it was found there was no difference between the means of Overall Mark and SAD Group Marks and the Overall Marks and DBMS Group Marks. The variation in marks between SAD Group and Overall and the variation in marks between the DBMS Group mark and the overall mark can be explained by within group variation rather by between group variation. Therefore is no evi-
dence to reject the hypothesis that students are not disadvantaged by the assessment methods in DBMS or SAD. This analysis indicated that both the base mark adjusted and the task splitting methods had produced “fair” marks, in that they correlated well to the student’s typical level of achievement, as evidenced by their average overall mark from all other papers. 3.4.2 Comparison of group work marks to
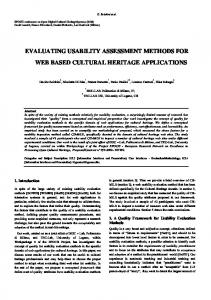
Figure 3 : Scatter plot of SAD Group Work Marks vs. SAD Individual Work Marks.
individual work marks within a course The second analysis compared students’ group work marks to their marks for individual work in the same course. Some disparity was predicted, due to students’ having different abilities in different assessment methods, but this analysis reduced the effect of differing levels of achievement in different courses (e.g. because of differing levels of interest in the course content). The results showed strong evidence of correlation between the group and individual assessments in SAD, and less, although still acceptable evidence of correlation between group and individual marks in DBMS. Figure 3 is a scatter plot of students’ group work marks and their individual work marks for SAD, showing the regression line. Using Pearson’s Correlation Coefficient there is strong evidence of a correlation between students’ group work and individual work marks (P < 0.0005). Figure 4 is a scatter plot of the students’ DBMS group work marks and their individual work marks, showing the regression line. Using Pearson’s Correlation Coefficient there is again evidence of a correlation between students’ DBMS group work marks and their overall marks (P < .0.039), although the evidence is not as strong as it is for SAD. This analysis provided further indication that both the base mark adjusted and task splitting
methods had produced “fair” marks, this time based on correlation with the students’ performance in individual work in the same course.
3.5 Limitations of the Method Some bias could be caused by the size of the sample and the exclusion of students not doing both DBMS and SAD. Furthermore, an assumption was made that the average mark of all other courses accurately reflects the student’s ability. There are many external factors that can also affect student performance. These include personal issues, such as when family priorities take precedence over academic, motivational issues, where a student prefers one subject over another, and peer issues, such as where a student finds themselves in an under or over performing group.
4. CONCLUSION The purpose of the study was to investigate best practice methods in assigning individual grades for group work and to study the fairness of two suggested methods. Statistically results show that overall both the base mark adjusted and task splitting methods are valid assessment forms, producing marks which seem to reflect the student’s typical level of achievement both within the course and over all courses at the same level. Some outliers were observed for 119
Figure 4 : Scatter plot of DBMS Group Mark vs. DBMS Individual Mark. Assignments. New Zealand Journal of Applied both methods, and the cause of these outliers Computing and Information Technology, 3(1), would be an interesting area for further research. 23-31. Interestingly, task splitting produced consistently Hamer, J., Ma, K.T.K. and Kwong, H.H.F. (2005). A Method of Automatic Grade Calibration in lower grades than the base mark adjusted method, Peer Assessment. In Proc. Seventh Australasian and although the causes may be unrelated to the Computing Education Conference (ACE2005), choice of method, further research into this variNewcastle, Australia. CRPIT, 42. Young, A. and ance may prove useful in assessing the efficacy of Tolhurst, D., Eds., ACS. 67-72. Kennedy, G.J. (2005). Peer-assessment in Group Projects: both methods. As there is a correlation between Is it worth it?. In Proc. Seventh Australasian the overall grades and those in a specific course, Computing Education Conference (ACE2005), further research into whether overall grades could Newcastle, Australia. CRPIT, 42. Young, A. and be used to predict the results students in a specific Tolhurst, D., Eds., ACS. 59-65. Lejk, M., Wyvill, M., & Farrow, S. (1999). Group course could also be undertaken.
Acknowledgements The authors would like to thank Evan Jones for his assistance in reviewing the statistics presented in the paper.
REFERENCES
Bartlett, R. L. (1995). A Flip Of The Coin--A Roll Of The Die: An Answer To The Free-Rider Problem In Economic Instruction. Journal of Economic Education, 26(2). Cheng, W., & Warren, M. (2000). Making a Difference: using peers to assess individual students’ contributions to a group project. Teaching in Higher Education, 5(2), pp. 243-255. Clark, N., Davies, P. and Skeers, R. (2005). Self and Peer Assessment in Software Engineering Projects. In Proc. Seventh Australasian Computing Education Conference (ACE2005), Newcastle, Australia. CRPIT, 42. Young, A. and Tolhurst, D., Eds., ACS. 91-100. Commins, N., Fitzgibbon, P., and Boerson R. (1999) The Development of a Peer Marking System for Group
120
Assessment in Systems Analysis and Design: a comparison of the performance of streamed and mixed-abiltiy groups. Assessment and Evaluation in Higher Education, 24(1). Lewis, R. (2002) Learning Communities - old and new. In Kinshuk, R. Lewis, K.Akahori, R. Kemp, T. Okamoto, L. Henderson, C.-H.Lee (Eds.) International Conference on Computers in Education, Auckland New Zealand., IEEE Computer Society, 6-13 Leung, Y. W. (1998). Least-square-error estimate of individual contribution in group project. IEEE Transactions on Education, 41(4), 282 - 285. McLoughlin, C. (1996) Technology Supported Learning Environments: Opportunities and Challenges. , HERDSA Conference Parsons, D. (2004) Justice in the Classroom: Peer Assessment of Contributions in Group Projects. In S. Mann, T. Clear (Eds) Proceedings of the Seventeenth Annual Conference of the National Advisory Committee on Computing Qualifications, 6-9 July, Christchurch, New Zealand. 145-152.