Beta Diversity of Plant-Pollinator Networks and the Spatial Turnover of Pairwise Interactions Daniel W. Carstensen1*, Malena Sabatino2, Kristian Trøjelsgaard3,4, Leonor Patricia C. Morellato1 1 Departamento de Botaˆnica, Laborato´rio de Fenologia, Plant Phenology and Seed Dispersal Group, Universidade Estadual Paulista (UNESP), Rio Claro, Sa˜o Paulo, Brazil, 2 Laboratorio Ecotono-CRUB, Universidad Nacional del Comahue & CONICET, San Carlos de Bariloche, Rı´o Negro, Argentina, 3 Department of Bioscience, Aarhus University, Aarhus, Denmark, 4 Department of Biotechnology, Chemistry and Environmental Engineering, Aalborg University, Aalborg, Denmark
Abstract Interactions between species form complex networks that vary across space and time. Even without spatial or temporal constraints mutualistic pairwise interactions may vary, or rewire, across space but this variability is not well understood. Here, we quantify the beta diversity of species and interactions and test factors influencing the probability of turnover of pairwise interactions across space. We ask: 1) whether beta diversity of plants, pollinators, and interactions follow a similar trend across space, and 2) which interaction properties and site characteristics are related to the probability of turnover of pairwise interactions. Geographical distance was positively correlated with plant and interaction beta diversity. We find that locally frequent interactions are more consistent across space and that local flower abundance is important for the realization of pairwise interactions. While the identity of pairwise interactions is highly variable across space, some speciespairs form interactions that are locally frequent and spatially consistent. Such interactions represent cornerstones of interacting communities and deserve special attention from ecologists and conservation planners alike. Citation: Carstensen DW, Sabatino M, Trøjelsgaard K, Morellato LPC (2014) Beta Diversity of Plant-Pollinator Networks and the Spatial Turnover of Pairwise Interactions. PLoS ONE 9(11): e112903. doi:10.1371/journal.pone.0112903 Editor: Shuang-Quan Huang, Central China Normal University, China Received July 28, 2014; Accepted October 21, 2014; Published November 10, 2014 Copyright: ß 2014 Carstensen et al. This is an open-access article distributed under the terms of the Creative Commons Attribution License, which permits unrestricted use, distribution, and reproduction in any medium, provided the original author and source are credited. Data Availability: The authors confirm that all data underlying the findings are fully available without restriction. Data are available at the Figshare database under the name "Plant-pollinator networks across seven sites", using the link http://dx.doi.org/10.6084/m9.figshare.1181910. Funding: Sa˜o Paulo Research Foundation grant # 2010/51307-0 (FAPESP – VALE), grant # 2011/22635-2 and # 2013/05920-0 to DWC. UNESP grant to MS. Research Productivity fellowship CNPq to LPCM. The funders had no role in study design, data collection and analysis, decision to publish, or preparation of the manuscript. Competing Interests: The authors have declared that no competing interests exist. * Email:
[email protected]
increasing area. Furthermore, interactions between specialists have been shown to be the most vulnerable to habitat fragmentation, while interactions between the core of generalists are more robust [11]. Still, our knowledge of the regional dynamics of interaction diversity, and the relationship between diversity of interactions and species, is in its infancy. Increased knowledge of the drivers of beta diversity of interactions is important to community ecology as it may illuminate what determines the identity of pairwise interactions and whether they are predictable from the composition of species, but it may also guide conservation planning by aiding the understanding of ecosystem functioning and interaction-based ecosystem services [12]. Mutualistic networks consist of two interacting communities and, consequently, their interactions are often analysed using a bipartite network approach [13]. Such networks consist of two types of nodes, e.g. plants and pollinators, connected by links. Detailed structures of pollination networks, such as species degree, core composition, and the identity of pairwise interactions, are highly dynamic over time [8,14–20]. This variation is caused by temporal differences in species composition and phenology [15– 18,21] but also by a strong lability in the identity of pairwise species interactions, i.e. interaction rewiring [18,22]. Interactions are temporally constrained if phenologies of potentially interacting species are decoupled, but they may also be spatially constrained [23]. One obvious reason is the turnover in species composition, i.e. spatial species-driven interaction turnover. However, a pair of
Introduction Spatial turnover of diversity, or beta diversity, has long been recognized as an important part of species diversity [1–3]. The beta diversity of a region is high if local sites within the region have unique species compositions so that no single site samples the majority of the total regional diversity. Beta diversity is fundamental to many aspects of diversity in ecological communities and in conservation planning, e.g. when determining the number of protected areas required to achieve biodiversity representation [4–6]. Interactions between species are an important, but often ignored, part of biodiversity [7]. Complete diversity assessments, and questions on drivers of diversity, should refer to both species and interactions, but this is still rarely done. Recent studies indicate that we cannot make solid inferences about regional interaction diversity solely from information about species diversity. For instance, Burkle and Alarco´n [8] showed that community dissimilarity of plant and pollinator species was highly predictable along an environmental gradient whereas the dissimilarity of the interactions between them was poorly explained. Poisot et al. [9] similarly found no correlation between beta diversity of species and interactions for host-parasite networks indicating that species and interactions are sorted through different mechanisms. Sabatino et al. [10] demonstrated that interaction richness increases twice as fast as species richness with PLOS ONE | www.plosone.org
1
November 2014 | Volume 9 | Issue 11 | e112903
Turnover of Interactions across Space
species interacting in one area might be present in another area without interacting, i.e. spatial interaction rewiring (see [19] for a similar distinction in studies of temporal interaction turnover). Poisot et al. [9] propose that the overall dissimilarity in interactions between networks is the sum of the dissimilarities caused by species turnover and interaction turnover (i.e. interaction rewiring). In the current study, we focus on the interaction turnover component. This variability in species interactions is not well studied but recent progress has identified potential drivers. First, species abundance affects the probability of interactions [24]. Neutral theory states that individuals interact randomly and that species interact with a probability determined by their abundance product [25]. Because population densities determine the probabililty of pairwise species encounters, relative abundances ultimately determine the realization of pairwise interactions. Second, when species meet, trait matching will constrain or promote the realization of pairwise interactions [23,26]. Compatibility of traits between species can be viewed quantitatively rather than purely qualitatively, and species with highly matching traits will likely interact with higher probability than species with poorly matching traits. Traits may also vary within-species across populations, increasing interaction turnover across space [27]. Finally, the local realization of pairwise interactions might be affected by competitive or facilitative effects from other species or interactions. Such mechanisms will potentially create complex community effects which are not easily tested. Network structure is determined by the combined effects of neutrality and trait matching [21,28] but as drivers of interaction turnover they have not been properly tested. Here, we quantify the spatial turnover in plant-pollinator interaction networks by examining the beta diversity of species and interactions between network pairs across seven sites. Then, we restrict the analysis to the shared networks between sites (i.e. only including shared species, see Figure 1A) and test the effect of interaction properties and site characteristics upon interaction turnover. Specifically we ask: 1) to what extent beta diversity of plant species, pollinator species, and interactions follow similar trends across space, and 2) which interaction properties and site characteristics are related to the probability of turnover of pairwise interactions across space. That is, when looking at each specific interaction between species pairs shared between two or more sites, can we then determine which interactions are more likely to turn over and under which conditions? On larger spatial scales, increasing dissimilarity between communities with increasing geographical distance, i.e. distance decay, is a well-documented pattern with respect to species composition [29] and has been shown once also for food webs [30]. The pattern, however, seems to become less clear at smaller spatial scales (1–3 km) and is thus far poorly explored with respect to interactions (but see [8]). Although Burkle and Alarco´n [8] found no correlation between distance and species and interaction similarity across pollination networks, Da´ttilo et al. [31] found a decreasing similarity in ant and plant composition with increasing distance. Thus, we expect a positive correlation between geographical distance and turnover of species. While species and interactions could be sorted through different mechanism [9] we also expect a positive correlation between geographical distance and interaction turnover, although the predictability may be lower. For our second question we focus on two interaction properties: average interaction frequency and interaction generalization, and three site characteristics: local flower abundance, local network species richness, and geographical distance between sites. Average interaction frequency measures the average frequency of a given PLOS ONE | www.plosone.org
pairwise interaction when both species are present. We argue that this is a good proxy for trait complementarity and behavioural preferences between species pairs. Lacking detailed information on species-specific traits, and how they would combine in the given system, interaction frequency is likely an outcome of such mechanisms [27]. We expect average interaction frequency to be negatively correlated with the probability of turnover. Interaction generalization is a measure of the generalization level of the species pair forming the interaction in question. Ecological specialization, i.e. the use of a relatively small proportion of the available interaction partners [32,33], is likely connected to less promiscuity, and thus a higher consistency of interactions between more specialized species can be expected [34,35]. Flower abundance has repeatedly been shown to be important to determine network structure [21,24,36–40], and we expect a change in local flower abundance between sites to influence interaction turnover so that a decrease in flower abundance of a given plant species will lower the probability that pairwise interactions, involving the same plant species, are realized. Finally, as explained above, different mechanisms of interference from other species might promote interaction turnover. We therefore expect that species richness of a given site can affect the realization of pairwise interactions by altering the competitive or facilitative context. Predicting the direction of such an effect is problematic as it is likely highly system-specific. However, recent experimental work on plant-pollinator systems indicates that an increase in species richness could increase the probability of turnover of interactions [41]. We show a positive correlation between geographical distance and beta diversity of species and interactions. Our findings indicate that the identity of pairwise interactions is highly variable across space, but that local flower abundance is important for the realization of interactions. Furthermore, those pairwise interactions that are locally frequent will also tend to be consistent across space if no temporal or spatial constraints are imposed on the species. These interactions could be of key importance for species in obligate or facultative mutualisms and form consistent elements in otherwise highly variable interaction networks.
Materials and Methods Study site We conducted our study in the National Park of Serra do Cipo´ and its buffer zone, an Environmental Protection Area, Morro da Pedreira. This protected area, addressed together as Serra do Cipo´, is located in the southern end of the Espinac¸o mountain chain, in the state of Minas Gerais, SE Brazil. Here, campos rupestres, or rupestrian fields, is a common habitat type between 1000–1400 m a.s.l. It is characterized by a species-rich vegetation of mostly small sclerophyllous evergreen shrubs and herbs associated with rocky outcrops and quartzitic or sandy soils with high aluminium and low nutrient contents [42,43,44]. Large variations in daily temperature, strong winds, frequent fires, and little accessible water during the dry season are important stressors, and a xeromorphic, fire-resistant vegetation has evolved [45]. Campos rupestres form isolated hills of sandstone and quartzite emerging as a mosaic surrounded by cerrado, forest, or caatinga. This mosaic landscape structure may be an important reason for campos rupestres having one of the highest levels of floristic endemism found in the cerrado biome [41,46]. Within Serra do Cipo´, we chose seven sites of campos rupestres. Sites were chosen so as to minimize abiotic differences between them in order to reduce environmental noise and restrict the focus towards biotic changes across sites. All sites were within an 2
November 2014 | Volume 9 | Issue 11 | e112903
Turnover of Interactions across Space
Figure 1. Site-pair comparison and interaction specific site-pair combinations. A) Site-pair comparison. Site 1 and 2 each have unique plants and pollinators. The central square represents the interaction-matrix between shared species. Here, six interactions are present in both sites (interaction consistency, filled squares) and six interactions are only observed in one of the two sites (interaction turnover, open squares). Unique species to either site 1 or 2 were discarded and only the central matrix was used for analysing the turnover of pairwise interactions. B) Interaction specific site-pair combinations. This (hypothetical) interaction is observed at sites 1 and 6 (filled squares) while the species pair is also present at site 3, however without interacting (open square). One or both species are absent from the remaining sites (in grey) and they are excluded from the analysis for this particular interaction. Three site-pair combinations are possible in this case; 1«3 and 6«3: interaction turnover and 1«6: no interaction turnover (interaction consistency). doi:10.1371/journal.pone.0112903.g001
frequency for each interacting species pair was the number of interactions per flower per 15 min of observation time. We standardized interaction frequency per flower in order to account for differences in flower abundance of observed individuals. Using these matrices, a quantitative bipartite plant-pollinator network was constructed for each site. For quantification of beta diversity and turnover probability, we used only the presence-absence of interactions as a clear distinction of turnover vs. no turnover was necessary. The quantitative measures (interaction frequencies) were used only as an explanatory variable in the model (see below). We analysed the networks in two steps. First, we calculated the beta diversity of species, of interactions between shared species, and of all interactions in the network, between all pairwise combinations of the seven sites, a total of 21 site-pair combinations. All measures of network beta diversity were calculated using the framework proposed by Poisot et al. [9]. Numerous variations of beta diversity measures exist, with little consensus on which measure is most appropriate in a given situation [2]. Here, we applied a beta diversity measure widely used in ecology, bw [1]. We applied this ‘‘broad sense’’ measure (sensu [2]) as it incorporates both differences in richness and composition between azbzc {1, where b is the sites. It is defined as: bw ~ (2azbzc)=2 number of items unique to the first site, c is the number of items unique to the second site, and a is the number of shared items between two sites. When calculating beta diversity of interactions between shared species (bOS) b and c represent interactions (among the shared species) found only in one of the networks, and a represents interactions in common between sites (see Figure 1A). This measure thus explicitly defines the spatial interaction rewiring as it ignores the part of network turnover that is caused by species turnover. Total interaction beta diversity (bWN) was calculated using all the interactions in the network, including those between species that are unique to one or the other site. Species beta diversity was calculated for plant species alone (bPlants), pollinator species alone (bPollinators), and for plants and pollinators together (bSpecies). We calculated mean beta diversity values by averaging the relevant beta diversity for each of the 21 site-pair combina-
altitudinal range of 1073–1260 m a.s.l. with similar wind exposition, soil substrate, and floral species richness (see File S1). All field activities were authorized by ICMBio of the Brazilian ministry of environment.
Observation of plant-pollinator interactions Sampling was done in 2012 during the peak flowering season (October–December) [47]. Intensive sampling restricted to the peak flowering season reduced the introduction of forbidden links due to phenological mismatches [23]. At each site we sampled ten 1 m2 plots along a 200 m long curvilinear transect. These plots were placed in a manner that maximized the number of observed plant species. We sampled one site per day with a fixed weekly rotation among sites. At each plot, we made a 15-min census observing all flowering plant species for flower visitors. We only registered animals touching reproductive floral parts and they are here operationally defined as pollinators. Daily census was done between 9 and 14 hours, covering the main activity period of the pollinators [47]. Observations were done every day by DWC and MS, except when raining. Sampling accumulated to six days per site and 252 observation hours over 44 days, resulting in a total of 2271 observed interactions. Each site was sampled 3661 h in total, and all sites are regarded as equally sampled (File S2). At each plot, flower abundance was estimated for each species by counting the number of individuals and flowers within each station. Pollinators were collected when identification in the field was not feasible. Specimens of the observed plant species were likewise collected. Species were subsequently identified with the aid of a reference collection and several specialists (see acknowledgements). Voucher specimens of plants and pollinators are deposited at Herba´rio Rioclarense, UNESP, Rio Claro (HRCB), Universidade Federal de Minas Gerais (UFMG), and Colec¸a˜o Entomolo´gica Padre Jesus Santiago Moure, UFPR (DZUP), Brazil.
Data analysis For each site, we constructed an interaction matrix with pollinator species in rows and plant species in columns. Interaction PLOS ONE | www.plosone.org
3
November 2014 | Volume 9 | Issue 11 | e112903
Turnover of Interactions across Space
tions. The R package betalink [9] was used to calculate all measures of beta diversity. Secondly, we isolated the common networks of site-pairs, that is, we included only those species present at both sites, and then extracted each interaction within this ‘‘common network’’ (Figure 1A). For each of these interactions, we tested two interaction properties (average interaction frequency and interaction generalization) and three site characteristics (difference in flower abundance per plant species, difference in network species richness, and the geographical distance between sites) and their relation to the binary response variable of whether the interaction would turnover or not between site-pairs. Thus, for each species pair that occurred in at least two sites, and interacted in at least one of these, we obtained at least one event of interaction turnover or interaction consistency. For each unique interaction between a plant and a pollinator species we got one or more site-pair combinations. Each data entry is therefore an interaction specific site-pair combination (Figure 1B). We used a binomial model with a stepwise selection procedure to test the effect of the interaction properties and site characteristics on the turnover of the interaction for each interaction specific site-pair combination. Average interaction frequency is the average of how frequently a given pairwise interaction is observed when both species are present at a site. This measure is therefore a property of the given interaction and each unique interaction of the entire system (the metaweb, sensu [48]) thus has an average interaction frequency. It was calculated as the sum of all the interaction frequencies registered between two particular species (i.e. the interaction frequency in the metaweb) divided by the number of sites where both species occur (interacting or not). Interaction generalization is a measure of the generalization level of the species pair forming the interaction in question. It was calculated by averaging the total number of different interacting partners of the two species across all sites (i.e. the mean of the degree in the metaweb of the plant and pollinator species). In mutualistic networks, the degree of a species is partly explained by its abundance [28,37,39,40]. We thus used the residual variance from the abundance/degree correlation as species degree for calculating interaction generalization. For a given interaction specific site-pair combination we calculated the difference in flower abundance between sites by subtracting the flower abundance of the one site from that of the other. This was then standardized by the total number of flowers for both sites for that species in order to get a measure of the relative change in flower abundance. This relative difference was used as an explanatory variable in the model. In order to investigate the direction of the effect, that is, whether an increasing abundance would have a positive or negative effect on whether a given interaction would be realized, we subsequently divided the data into those situations where abundance increased between sites and those where abundance decreased between sites. In the model, we further used a standardized difference in species richness between sites, that is, the difference in number of species divided by the total number of species in both sites. Geographical distance was the Euclidean distance between a site-pair. Analyses were implemented in R v. 3.0.1 [49].
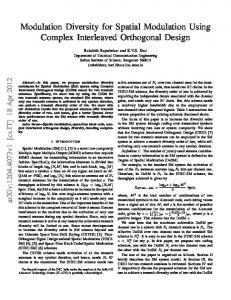
Figure 2. Beta diversity of species and interactions and geographical distance. Total interaction beta diversity bWN (black), plant beta diversity bPlants (green), beta diversity of interactions between shared species bOS (red), and pollinator beta diversity bPollinators (blue) as a function of geographical distance between sites. All measures relate positively to geographical distance. Only for bPollinators the correlation was non-significant (bWN: P = 0.002, R2 = 0.40, a = 0.02; bOS: P = 0.047, R2 = 0.19, a = 0.03; bPlants: P = 0.004, R2 = 0.37, a = 0.04; bPollinators: P = 0.086, R2 = 0.15, a = 0.01). Shaded areas delimit corresponding 95% confidence intervals. doi:10.1371/journal.pone.0112903.g002
seven sites, 65 species were unique to a single site. Of the 199 pollinator species, 83 were unique to a single site. Geographical distance was positively correlated with total interaction beta diversity (bWN) (P = 0.002, R2 = 0.40, a = 0.02, Figure 2), beta diversity of interactions between shared species (bOS) (P = 0.047, R2 = 0.19, a = 0.03, Figure 2), and bPlants (P = 0.004, R2 = 0.37, a = 0.04, Figure 2) across sites. bPollinators also showed a positive, albeit not significant, correlation with geographical distance (P = 0.086, R2 = 0.15, a = 0.01, Figure 2).
Turnover of pairwise interactions We analysed 1063 interaction specific site-pair combinations. Of these, only 271 (25.5%) were consistent between sites. In the binomial regression analysis average interaction frequency, difference in flower abundance, and geographical distance were included in the best-fit model (Table 1). The effect of average interaction frequency on interaction turnover was negative (Table 1, Figure 3), while difference in flower abundance and geographical distance were positively correlated with interaction turnover (Table 1). The probability of losing an interaction from one site to another increased if flower abundance decreased; the larger the difference in abundance, the stronger the effect (Figure 4). Network species richness and interaction generalization were not included in the best-fit model (Table 1).
Results
Discussion
Network beta diversity
Pairwise interactions, the fundamental component of complex ecological networks, have proven difficult to predict [8,50]. We find that pairwise interactions are indeed highly variable across space, but that some types of interactions are more predictable than others. Pairwise interactions that are locally frequent are
Mean species beta diversity between sites was bSpecies = 0.59, bPlants = 0.66, and bPollinators = 0.57 (see File S3 for details). The mean beta diversity of interactions between shared species was bOS = 0.62. Of the 101 plant species observed in total across all
PLOS ONE | www.plosone.org
4
November 2014 | Volume 9 | Issue 11 | e112903
Turnover of Interactions across Space
Figure 4. Flower abundance and the probability of losing an interaction. Whether pairwise interactions are realized or not is highly dependent on local flower abundance of the plant species. The figure shows the increasing probability of losing an interaction when going from a site with higher local flower abundance of the plant species to a site with lower local flower abundance. The larger the difference in local flower abundance, the stronger the effect. Superimposed points result in darker marks. doi:10.1371/journal.pone.0112903.g004
Figure 3. Interaction frequency and interaction turnover. Average interaction frequency is negatively related to the probability of interaction turnover. The more frequent interactions show lower probabilities of turnover between sites. Superimposed points result in darker marks. doi:10.1371/journal.pone.0112903.g003
more consistent across space. We further show that the probability, for a pairwise interaction to be realized, is increased with the local abundance of the plant species forming the interaction. Finally, increased geographical distance between sites significantly increase beta diversity of plant species and interactions and the probability of turnover of pairwise interactions. As expected, interactions that were locally more frequent showed a lower turnover across sites. Such interactions can be interpreted as linking species of high mutual affinity; if no spatial or temporal constraints are imposed, these species pairs will likely interact, and likely with a high frequency. Such strong interactions are of principal importance in plant reproduction locally [38]. Our results demonstrate their regional importance as interactions that link sites across campos rupestres landscape. These interactions represent spatially consistent elements across interaction networks. Hyperdominant species represent a defining set for a biome or a region and will account for a large proportion of the processes within a given system [51]. Understanding this small fragment of the existing diversity will thus greatly increase the understanding of the system. We have here taken a first step towards identifying a set of interactions that in a similar manner is defining for a region. While the effect of abundance on nestedness, asymmetry, species degree, and other network properties in plant-pollinator networks is well documented [21,28,37,38], the effect of flower abundance on the realization of pairwise interactions is hitherto poorly tested. We show that the probability for a given pollinator to interact with a given plant species depends upon the resource level that the plant is offering at a given site. Flower abundance affects pairwise interactions by increasing the attractiveness of plants with many flowers (i.e. increased resource levels), and hereby influencing behavioural decisions by pollinators. Additionally, abundance affects species’ encounter probabilities and such neutral factors have earlier been shown to influence interaction patterns [24,39]. Interaction strength is directly affected by relative abundances [24] but as we have shown here, interactions may also be entirely lost or gained over space as a function of varying PLOS ONE | www.plosone.org
abundances. Negative difference in abundance increases the probability of interaction loss by introducing ‘‘neutral forbidden links’’ [52]. That is, because of low abundances, co-occurring rare species might be constrained from interacting, in spite of otherwise complementing traits. In a strict neutral approach, species identities do not matter – relative abundances alone determine interaction probability [25]. In reality, encounters may be stochastic, but certain species will be more likely to interact if they meet. The strong affinities between certain pairs of species, here indicated by the negative relationship between average interaction frequency and turnover probability, are likely a function of trait complementarity. Beta diversity of interactions and species were related to geographical distance in a similar positive manner. Plant species not only showed overall higher beta diversity than pollinators; plant beta diversity, contrary to that of pollinators, was significantly correlated with geographical distance. Pollinators are mobile and, all else being equal, will show higher dispersal capabilities in ecological time possibly explaining the lower, and less distance-dependent, beta diversity of pollinator species compared to plants. A similar pattern has been shown for herbivores and their plant hosts [30]. Beta diversity of interactions between shared species (bOS) also showed a significant correlation with geographical distance, suggesting that species in neighboring sites are more likely to display similar interaction behaviors compared to species from distant sites. Such a significant relationship has, to our knowledge, not been found earlier. Geographical distance also had a significant effect on the probability of turnover in our model, reaffirming the correlation between bOS and geographical distance. It should be noted, however, that in both cases correlations were significant, but not strongly so. Thus, geographical distance alone explains little of the variation in interactions across space. A combination of subtle variation in community and landscape properties which are 5
November 2014 | Volume 9 | Issue 11 | e112903
Turnover of Interactions across Space
Table 1. Model terms and their estimates.
DAIC Best-fit model
Full model
Terms in model
Coeff.
SE
z value
0 average interaction frequency***
215.34
3.61
24.24
flower abundance***
1.14
0.26
4.47
geographical distance**
0.10
0.04
2.61
2.6 average interaction frequency ***
215.40
3.57
24.31
flower abundance***
1.10
0.26
4.32
0.10
0.04
2.67
geographical distance** NS
0.17
0.25
0.67
average interaction frequency: interaction generalizationNS
11.69
11.96
0.98
network species richnessNS
1.22
1.05
1.18
interaction generalization
Including standard errors (SE) and z values for the full and best-fit models. ***: P,0.001, **: P,0.01, *: P,0.05, NS: P.0.1. doi:10.1371/journal.pone.0112903.t001
spatially autocorrelated could be the cause of the distance effect on interaction turnover. Interaction generalization (i.e. the mean generalization level of the species involved in a particular interaction) showed no significant effect on the probability of turnover of pairwise interactions. Species with few local interaction partners might indeed appear as specialists, however, interactions between these species were not more consistent across space. Thus specialized interactions (least generalized) might not actually be between specialist species per se, but simply between species with few local interaction partners which might change across sites. Network species richness neither had any significant effect on the turnover of pairwise interactions. Instead, complex synergistic effects of different community and landscape properties will have to be included in order to discover more deeply the mechanisms behind the detailed patterns of pairwise interactions. High levels of endemism and extremely narrow distributional ranges of some species [42] make campos rupestres a unique but also fragile habitat. Campos rupestres are under threat from several human activities such as mining, cattle ranching, wood extraction, cultivation, and road construction [43]. Here we confirm the high heterogeneity of species composition across campo rupestre habitat and further show an equally high turnover of plant-pollinator interactions. While plants in campos rupestres are spatially constrained and distributed in local patches, pollinators disperse freely between these patches. Pollinators could thus function as spatial couplers of otherwise disjunct plant populations and be very important to gene flow between local plant populations; a subject worthy of further study. These findings indicate that conservation management in campos rupestres will likely need to consider the protection of a large network of reserves, i.e. a metanetwork [7], in order to maximize representation of species and processes [6]. Future work on interactions could focus on the turnover of functional groups instead of taxonomic species. Perhaps species traits are better predictors of pairwise interactions than actual species identities (e.g. [53]). Trait information could increase our knowledge on which interactions are the most consistent and why, and reveal which, if any, interactions are truly obligatory [28,36]. We have quantified the beta diversity of interactions across space and investigated the turnover of each pairwise interaction. Beta diversity of interactions is generally high and the identity of
PLOS ONE | www.plosone.org
pairwise interactions is highly variable across space. A large part of the pairwise interactions constituting plant-pollinator networks seems to be partly random encounters and/or opportunistic interactions whose identity is largely determined by local species abundances. However, pairwise interactions that are locally frequent will tend to be consistent across space if no temporal or spatial constraints are imposed on the species. Thus, beneath the large variation and diversity across space, some species form interactions that are more consistent and predictable. Such interactions represent cornerstones of interacting communities and deserve special attention from ecologists and conservation planners alike.
Supporting Information File S1 Site information. Altitude, species richness of plants and pollinators, richness of interactions, and the distance to nearest site for the seven sites and for the region in total. (DOCX) File S2 Sampling effort. Description of sampling effort,
including Chao 2 estimator calculation and rarefaction curves. (DOCX) File S3 Species beta diversity between sites. Detailed values of plant and pollinator beta diversity across all 21 site-pairs. (DOCX)
Acknowledgments We greatly appreciate help from Clemens Schlindwein, Marina Beira˜o, Eduardo A. Athayde, and Natha´lia M. W. B. Rocha with identification of collected material. We equally thank Fernando A. O. Silveira for assistance in the field and with plant identification, and Irene Mendoza for analytical assistance and discussions. We also thank Timothe´e Poisot for supplying the betalink package. Finally, we thank Jens M. Olesen and Timothe´e Poisot for valuable comments on the manuscript.
Author Contributions Conceived and designed the experiments: DWC MS LPCM. Performed the experiments: DWC MS. Analyzed the data: DWC KT. Wrote the paper: DWC MS KT LPCM.
6
November 2014 | Volume 9 | Issue 11 | e112903
Turnover of Interactions across Space
References 28. Stang M, Klinkhamer PGL, van der Meijden E (2006) Size constraints and flower abundance determine the number of interactions in a plant/flower visitor web. Oikos 112. 29. Nekola JC, White PS (1999) The distance decay of similarity in biogeography and ecology. Journal of Biogeography 26: 867–878. 30. Novotny V (2009) Beta diversity of plant-insect food webs in tropical forests: a conceptual framework. Insect Conservation and Diversity 2: 5–9. 31. Da´ttilo W, Guimara˜es PR, Izzo TJ (2013) Spatial structure of ant-plant mutualistic networks. Oikos 122: 1643–1648. 32. Johnson SD, Steiner KE (2000) Generalization vs. specialization in plant pollination systems. Trends in Ecology & Evolution 15: 140–143. 33. Bluthgen N, Menzel F, Bluthgen N (2006) Measuring specialization in species interaction networks. BMC Ecology 6: 9. 34. Thompson JN (1994) The coevolutionary process. Chicago: University of Chigaco Press. 35. Poisot T, Stanko M, Miklisova D, Morand S (2013) Facultative and obligate parasite communities exhibit different network properties. Parasitology 140: 1340–1345. 36. Jordano P (1987) Patterns of mutualistic interactions in pollination and seed dispersal - connectance, dependence assymmetries, and coevolution. American Naturalist 129: 657–677. 37. Dupont YL, Hansen DM, Olesen JM (2003) Structure of a plant-flower-visitor network in the high-altitude sub-alpine desert of Tenerife, Canary Islands. Ecography 26: 301–310. 38. Va´zquez DP, Morris WF, Jordano P (2005) Interaction frequency as a surrogate for the total effect of animal mutualists on plants. Ecology Letters 8: 1088–1094. 39. Krishna A, Guimara˜es Jr PR, Jordano P, Bascompte J (2008) A neutral-niche theory of nestedness in mutualistic networks. Oikos 117: 1609–1618. 40. La´zaro A, Nielsen A, Totland Ø (2010) Factors related to the inter-annual variation in plants’ pollination generalization levels within a community. Oikos 119: 825–834. 41. Brosi BJ, Briggs HM (2013) Single pollinator species losses reduce floral fidelity and plant reproductive function. Proceedings of the National Academy of Sciences of the United States of America 110: 13044–13048. 42. Alves RJV, Kolbek J (1994) Plant species endemism in savanna vegetation on table mountains (Campo Rupestre) in Brazil. Vegetatio 113: 125–139. 43. Giulietti AM, Pirani JR, Harley RM (1997) Espinhaco Range region, Eastern Brazil. In: Davis SD, Heywood VH, Herrera-MaxBryde O, Villa-Lobos J, Hamilton AC, editors. Centres of plant diversity: a guide and strategy for their conservation. Cambridge: WWF/World Conservation Union. 44. Benites VM, Schaefer CEGR, Simas FNB, Santos HG (2007) Soil associated with rock outcrops in the Brazilian moutain ranges Mantiqueira and Espinac¸o. Revista Brasileira de Botaˆnica 30: 569–577. 45. Giulietti A, Menezes N, Pirani J, Wanderley M (1987) Flora da Serra do Cipo´: caracterizac¸a˜o e lista das espe´cies. Boletim de Botaˆnica 9: 1–151. 46. Echternacht L, Trovo´ M, Oliveira CT, Pirani JR (2011) Areas of endemism in the Espinhac¸o Range in Minas Gerais, Brazil. Flora - Morphology, Distribution, Functional Ecology of Plants 206: 782–791. 47. Faria GM (1994) A flora e fauna apı´cola de um ecossistema de campo rupestre, Serra do Cipo´ - MG, Brasil. Tese de Doutorado Instituto de Biocieˆncias, Universidade Estadual Paulista, Rio Claro. 48. Dunne JA (2006) The network structure of food webs. In: Pascual M, Dunne JA, editors. Ecological Networks: Linking structure to dynamics in food webs. Oxford: Oxford University Press. pp.27–86. 49. R Development Core Team (2008) R: A language and environment for statistical computing. R Foundation for Statistical Computing. Vienna, Austria. 50. Vazquez DP, Chacoff NP, Cagnolo L (2009) Evaluating multiple determinants of the structure of plant-animal mutualistic networks. Ecology 90: 2039–2046. 51. ter Steege H, Pitman NC, Sabatier D, Baraloto C, Salomao RP, et al. (2013) Hyperdominance in the Amazonian tree flora. Science 342: 1243092. 52. Canard E, Mouquet N, Marescot L, Gaston KJ, Gravel D, et al. (2012) Emergence of structural patterns in neutral trophic networks. PLoS ONE 7: e38295. 53. Gravel D, Poisot T, Albouy C, Velez L, Mouillot D (2013) Inferring food web structure from predator-prey body size relationships. Methods in Ecology and Evolution 4: 1083–1090.
1. Whittaker RH (1960) Vegetation of the Siskiyou mountains, Oregon and California. Ecological Monographs 30: 279–338. 2. Koleff P, Gaston KJ, Lennon JJ (2003) Measuring beta diversity for presenceabsence data. Journal of Animal Ecology 72: 367–382. 3. Gaston KJ, Davies RG, Orme CDL, Olson VA, Thomas GH, et al. (2007) Spatial turnover in the global avifauna. Proceedings of the Royal Society BBiological Sciences 274: 1567–1574. 4. Pimm SL, Gittleman JL (1992) Biological diversity: where is it? Science 255: 940. 5. Condit R, Pitman N, Leigh EG, Jr., Chave J, Terborgh J, et al. (2002) Betadiversity in tropical forest trees. Science 295: 666–669. 6. Wiersma YF, Urban DL (2005) Beta Diversity and Nature Reserve System Design in the Yukon, Canada. Conservation Biology 19: 1262–1272. 7. Hagen M, Kissling WD, Rasmussen C, De Aguiar MAM, Brown LE, et al. (2012) Biodiversity, Species Interactions and Ecological Networks in a Fragmented World. Advances in Ecological Research 46: 89–210. 8. Burkle LA, Alarcon R (2011) The future of plant-pollinator diversity: understanding interaction networks across time, space, and global change. American Journal of Botany 98: 528–538. 9. Poisot T, Canard E, Mouillot D, Mouquet N, Gravel D (2012) The dissimilarity of species interaction networks. Ecology Letters 15: 1353–1361. 10. Sabatino M, Maceira N, Aizen MA (2010) Direct effects of habitat area on interaction diversity in pollination webs. Ecological Applications 20: 1491–1497. 11. Aizen MA, Sabatino M, Tylianakis JM (2012) Specialization and rarity predict nonrandom loss of interactions from mutualistic networks. Science 335: 1486– 1489. 12. Estes JA, Terborgh J, Brashares JS, Power ME, Berger J, et al. (2011) Trophic Downgrading of Planet Earth. Science 333: 301–306. 13. Bascompte J, Jordano P (2013) Mutualistic Networks. Princeton University Press. 14. Basilio AM, Medan D, Torretta JP, Bartoloni NJ (2006) A year-long plantpollinator network. Austral Ecology 31: 975–983. 15. Alarco´n R, Waser NM, Ollerton J (2008) Year-to-year variation in the topology of a plant-pollinator interaction network. Oikos 117: 1796–1807. 16. Olesen JM, Bascompte J, Elberling H, Jordano P (2008) Temporal dynamics in a pollination network. Ecology 89: 1573–1582. 17. Petanidou T, Kallimanis AS, Tzanopoulos J, Sgardelis SP, Pantis JD (2008) Long-term observation of a pollination network: fluctuation in species and interactions, relative invariance of network structure and implications for estimates of specialization. Ecology Letters 11: 564–575. 18. Dupont YL, Padro´n B, Olesen JM, Petanidou T (2009) Spatio-temporal variation in the structure of pollination networks. Oikos 118: 1261–1269. 19. Olesen JM, Stefanescu C, Traveset A (2011) Strong, long-term temporal dynamics of an ecological network. PLoS ONE 6: 1–5. 20. Rasmussen C, Dupont YL, Mosbacher JB, Trøjelsgaard K, Olesen JM (2013) Strong Impact of Temporal Resolution on the Structure of an Ecological Network. PLoS ONE 8: e81694. 21. Vazquez DP, Bluthgen N, Cagnolo L, Chacoff NP (2009) Uniting pattern and process in plant-animal mutualistic networks: a review. Annals of Botany 103: 1445–1457. 22. Kaiser-Bunbury CN, Muff S, Memmott J, Mu¨ller CB, Caflisch A (2010) The robustness of pollination networks to the loss of species and interactions: a quantitative approach incorporating pollinator behaviour. Ecology Letters 13: 442–452. 23. Olesen JM, Bascompte J, Dupont YL, Elberling H, Rasmussen C, et al. (2011) Missing and forbidden links in mutualistic networks. Proceedings of the Royal Society B: Biological Sciences 278: 725–732. 24. Va´zquez DP, Melia´n CJ, Williams NM, Blu¨thgen N, Krasnov BR, et al. (2007) Species abundance and asymmetric interaction strength in ecological networks. Oikos 116: 1120–1127. 25. Hubbell S (2001) The unified neutral theory of biodiversity and biogeography Princeton University Press. 26. Santamaria L, Rodrı´guez-Girones MA (2007) Linkage rules for plant–pollinator networks: Trait complementarity or exploitation barriers? PLoS Biology 5: e31. doi:10.1371/journal.pbio.0050031. 27. Poisot T, Stouffer D, Gravel D. (2014) Beyond species: why ecological interaction networks vary through space and time. Oikos. 10.1111/oik.01719.
PLOS ONE | www.plosone.org
7
November 2014 | Volume 9 | Issue 11 | e112903