Beyond Evolutionary Algorithms for Search-based Software Engineering Jianfeng Chen, Vivek Nair∗, Tim Menzies Department of Computer Science, North Carolina State University, Raleigh, NC, USA
arXiv:1701.07950v1 [cs.SE] 27 Jan 2017
Abstract Context: Evolutionary algorithms typically require large number of evaluations (of solutions) to reach their conclusions – which can be very slow and expensive to evaluate. Objective: To solve search-based SE problems, using fewer evaluations than evolutionary methods. Method: Instead of mutating a small population, we build a very large initial population which is then culled using a recursive bi-clustering binary chop approach. We evaluate this approach on multiple software engineering(SE) models,unconstrained as well as constrained, and compare its performance with standard evolutionary algorithms. Results: Using just a few evaluations (under 100), we can obtain the comparable results to standard evolutionary algorithms. Conclusion: Just because something works, and is widespread use, does not necessarily mean that there is no value in seeking methods to improve that method. Before undertaking SBSE optimization task using traditional EAs, it is recommended to try other techniques, like those explored here, to obtain the same results with fewer evaluations.
1. Introduction Due to the complexities of software architectures, shareholder requirements, it is often hard to solve complex modeling problems via a standard numerical mathematical analysis or some deterministic algorithms [24]. There are many reasons for this complexity: • When procedural code is used within the model of a domain, every “if” statement can divide the internal problem space into different regions (once for each branch in the “if”). Such software models cannot be optimized via traditional numerical methods that assume models are a single continuous differentiable function. • Finding solutions to problems often means accommodating competing choices. When stakeholders propose multiple goals, search-based SE (SBSE) methods can reflect on goal interactions to propose novel solutions to hard optimization problems such as configuring products in complex product lines [45], tuning parameters of a data miner [49], or finding best configurations for clone detection algorithms [53]. For these tasks, many SBSE researchers usually use evolutionary algorithms (EA) [45, 49, 53]. Evolutionary algorithms start by generating a set of initial solutions and improve them through the crossovers and mutations. They are inspired by the evolution in the nature and make no parametric assumptions about the model being generated. In our experience,
∗ Corresponding
author: email:
[email protected] Tel:+1-919-523-920(Vivek) Email addresses:
[email protected] (Jianfeng Chen),
[email protected] (Vivek Nair),
[email protected] (Tim Menzies) Preprint submitted to Elsevier
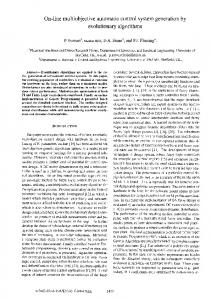
this has made them particularly well-suited from SE. However, evolutionary algorithms typically require large number of evaluations (of solutions) to reach their conclusions Real-world model-based applications may contain complex objective function, which can be very expensive to evaluate (with respect to computation time, resources required etc.). So can we do better than EA for Search-based SE? Or, are there faster alternatives to EA? This paper experimentally evaluates one such alternative which we call SWAY (short for the Samplying WAY): 1. Like with standard EA, generate an initial population; 2. Intelligently select a cluster within population generated with best scores. SWAY runs so fast since it terminates after just 2log 2 N evaluations of N candidate solutions. SWAY’s intelligent selection mechanism for exploring subsets of the population is a recursive binary chop that (i) finds and evaluates only the two most dissimilar examples, then (ii) recurses only on the half of the data near the best one. As shown later in this paper, for this process to work, it is important to have the right definition of “dissimilar”. Note the differences between SWAY and standard EA: 1. SWAY quits after the initial generation while EA reasons over multiple generations; 2. SWAY makes no use of mutation or cross-over so there is no way for lessons learned to accumulate as it executes; 3. Depending on the algorithm, not all members of population will be evaluated– e.g. active learners [31] only evaluate a few representative individuals. January 30, 2017
Because of the limited nature of this search, until recently, we would have dismissed SWAY as comparatively less effective as EA for exploring multi-goal optimization. Nevertheless, quite by accident, we have stumbled onto evidence that has dramatically changed our opinion about SWAY. Recently we were working with an algorithm called GALE [31]. GALE is an evolutionary algorithm includes SWAY as a sub-routine:
• GALE without evolution (SWAY) runs an order of magnitude faster than EAs; • Optimizations found by SWAY are similar to those found by SBSE algorithms; • How we recognize “dissimilar” examples is of vital importance;
mutation
• Super-charging (combining SWAY with standard SBSE optimizers) is not useful.
crossover sampling SWAY = GALE − evolution
evolution = generations ∗
More generally, our conclusion is sampling is an interesting research approach for multi-dimensional optimization that deserves further attention by the SBSE community.
While porting GALE from Python to Java, we accidentally disabled evolution. To our surprise, that “broken” version worked as well, or better, than the original GALE. This is an interesting result since GALE has been compared against dozens of models in a recent TSE article [31] and dozens more in Krall’s Ph.D. thesis [30]. In those studies, GALE was found to be competitive against widely used evolutionary algorithms. If Krall’s work is combined with the results from our accident, then we conjecture that the success of EAs is due less to “evolution” than to “sampling” many options. This, in turn, could lead to a new generation of very fast optimizers since, as we show below, sampling can be much faster than evolving. The rest of this paper describes SWAY and presents evidence for its utility. While we have tested SWAY on the standard EA ‘lab problems” such as DTLZ, Fonseca, Golinski, Srinivas, etc [14], those results are not included here since, in our experience, results from those small maths models are less convincing to the SE community than results from software models. Hence, here we present results from:
1.1. Connection to Prior Work This paper significantly extends prior work by the authors. The background notes in the next section are new to the paper, as is the super-charging study. Also, this paper repairs a significant drawback seen in the initial describing SWAY. At SSBSE’16 [42], we demonstrated how SWAY can be used to find near optimal solutions for problems like XOMO and POM. While an interesting result, it turns out that the early definition of “dissimilar” used by that version of SWAY was only applicable to problem whose decision space is in continuous domain (line MONRP). The results on other types of problems, were less than impressive. In this paper, we expose the weakness of the the earlier variant of SWAY and show other definitions of “dissimilar” can make SWAY very useful for other domains. 1.2. When is SWAY most Useful, Useless?
• POM3: a model of agile teams selecting their next task from the scrum backlog [43, 6];
SWAY would be most useful it is proposed to put humans-inthe-loop to help guide the evaluations (e.g. as done in [44]). In this scenario, standard EAs might have to ask a human for up to N 2 opinions for G generations. On the other hand, SWAY, would only trouble the user 2log 2 N times On the other SWAY was created to solve problems, where the practitioner is not at a liberty of evaluating thousands of individuals for e.g. Wang et al. [54] spent 15 years of CPU time to find software clone detectors or model explored by Krall et al. [31]) which take hours to perform a single evaluation. However, there also exists some software engineering application, where such speed ups are not required and hence, SWAY would not a good fit for such applications.
• XOMO: a model predicting software development time, effort, risks and defects [37, 39, 38]; • MONRP: a model of next release planning that recommends what functionality to code next [2]. After presenting some background motivational notes, this paper offers general notes on multi-objective evolutionary algorithms. This is followed by a description of SWAY and the POM3, XOMO, MONRP models. Experimental results are then presented showing that SWAY achieves optimizations competitive with standard methods (NSGA-II and SPEA2), and does so using orders of magnitude fewer evaluations. Working with the MONRP models, we also find that a seemingly minor detail (the implementation of the distance function use to recognize “dissimilar” examples) is of vital importance to the success of SWAY. Finally, this paper concludes with experiments on ‘super-charging” that tests if SWAY can boost the performance of standard optimizers. Our observations after conducting the study are:
1.3. Access to Code For the purposes of reproducibility, all the code and data used in this paper are available at http://tiny.cc/Sway. 2. Frequently Asked Questions
• The mutation strategies seen in a recently published EA algorithm (GALE) adds little value;
Before exploring the technical details on SWAY, we digress to answer some frequently asked questions about this research. 2
• Even if (a) we could build faster CPUs and even if (b) we had the energy to power them and even if (c) we could dispose of the pollution associated with generating that energy, then all that CPU+energy+pollution offset would be a service that must be paid for. Fisher et al. [20] comment that cloud computation is a heavily monetized environment that charges for all their services (storage, uploads, downloads, and CPU time). While each small part of that service is cheap, the total annual cost to an organization can be exorbitant. Google reports that a 1% reduction in CPU requirements saves them millions of dollars in power costs [27].
2.1. On the Value of Seeking Simplicity While SWAY does not necessarily produce better optimizations, we advocate its use since it is very simple and very fast. But what is the value of report simpler and faster ways to achieve results that are currently achievable by slower and more complex methods? In terms of core science, we argue that the more we understand something, the better we can match tools to tasks. Tools that are poorly matched to task are usually complex and/or slow to execute. SWAY seems a better match for the tasks explored here since it is neither complex nor slow. Hence, we argue that SWAY is interesting in terms of its core scientific contribution to optimization research. Seeking simpler and/or faster solutions is not just theoretically interesting. It is also an approach currently in vogue in contemporary software engineering. Calero and Pattini [10] comment that “redesign for greater simplicity” also motivates much contemporary industrial work. In their survey of modern SE companies, they find that many current organizational redesigns are motivated (at least in part) by arguments based on “sustainability” (i.e. using fewer resources to achieve results). According to Calero and Pattini, sustainability is now a new source of innovation. Managers used sustainability-based redesigns to explore cost-cutting opportunities. In fact, they say, sustainability is now viewed by many companies as a mechanism for gaining complete advantage over their competitors. Hence, a manager might ask a programmer to assess methods like SWAY as a technique to generate new and more interesting products.
Hence we say that tools like SWAY, that use less CPU, as interesting because they let us achieve the same goals with fewer resources. 3. Multi-objective Evolutionary Algorithms (MOEA) SWAY is a multi-objective evolutionary algorithm. This section offers a general background to the general area of MOEAs. SBSE involves utilizing the rich literature of search based optimization to solve software engineering problems. The automatic evaluations of solutions opens up a whole range of possibilities with Evolutionary Algorithms. In the last few years, EA has been used to solve problems in software engineering like requirement selection [16], resource allocation in project scheduling [35] etc. EAs is very flexible and can be used for variety of problems. There are only two ingredients for the application of EAs for software engineering problems: 1. The choice of representation of the problem
2.2. Why not just use more of the Cloud?
2. The definition of the fitness function
SWAY reduces the number of evaluations required to optimize a model (and hence the CPU cost of this kind of analysis by one to two orders of magnitude). Given the ready availability of cloud-based CPU, we are sometimes asked what are the benefits of merely making something run 100 times faster when we can just buy more CPU on the cloud? In reply, we say that CPUs are not an unlimited resource that should be applied unquestionably to computationally expensive problems.
This simplicity and ready applicability has led to wide adoption of the EAs in the software engineering domain. The software engineering problem can be conceptualized as an optimization problem where the function is unknown.Each solution to the problem can thought of a set of decisions (d ) and objectives (o ); i.e. soli = (d , o). The fitness function is a function which maps the decision space to objective space i.e. o = f (d )
• We can no longer rely on Moore’s Law [41] to double our computational power very 18 months. Power consumption and heat dissipation issues effectively block further exponential increases to CPU clock frequencies [33].
(1)
A general multi-objective algorithm can be posed as follows: min F (x) = [F 1 (x), F 2 (x), ..., F k (x)]T x
(2)
where x is a vector of decisions and k is the number of objectives. In contrast to single-objective (where k=1 in equation 2), there is no single global solution to a multi-objective problem but rather a set of points that all fit a predetermined definition for an optimum. The predominant concept in defining optimal point is that of Pareto optimality, which is defined as:
• Even if we could build those faster CPUs, we would still need to power them. CPU power requirements (and the pollution associated with generating that power [50]) is now a significant issue. Data centers consume 1.5% of globally electrical output and this value is predicted to grow dramatically in the very near future [9] (data centers in the USA used 91 billion kilowatt-hours of electrical energy in 2013, and they will be using 139 billion kilowatthours by 2020 (a 53% increase) [50]).
∀o j ∈ objectives | ¬(o j ,x ≺ o j ,y )} ∧∃o j ∈ objectives | o j ,x  o j ,y }
3
(3)
where obj are the objectives and (º, Â) tests if an objective score 1 in one individual is (no worse, better) than the other. This is also 2 3 known as binary domination. However, as the number of objec- 4 tives increases the number of non-dominated solutions while 56 the number of dominated solutions decreases. Hence Zitzler et 7 8 al. [58] proposed continuous domination, which rather than bi- 9 10 nary domination does not return {True, False} but rather return 11 a measure of dominance of a solution over other. This can be 12 13 mathematically defined as: xÂy loss(x, y) ∆( j , x, y, n)
= = =
def SWAY( population, better=continuousDomination) : # top-down clustering def cluster(items, out): if len(items) < enough: out += [items] else: middle = len(items)/2 west,east,westItems,eastItems = split(items, middle) # if either dominates, ignore half. # else, recurse on both if not better(west,east): cluster(eastItems,out) if not better(east,west): cluster(westItems,out) return out
Figure 1: Framework of SWAY algorithm
loss(y, x) > loss(x, y) Pn
∆( j ,x,y,n)
/n j −e w j (o j ,x − o j ,y )/n
(4) • Zuluaga et al. comment on the cost of evaluating all decisions for their models of software/hardware co-design: “synthesis of only one design can take hours or even days.” [63].
A standard EA can be described as follows (similar to one described in section 1): • Generate initial population of solutions using some initialization policy for eg. random strategy
• Harman comments on the problems of evolving a test suite for software: if every candidate solution requires a timeconsuming execution of the entire system: such test suite generation can take weeks of execution time [23].
• Evaluate the solution using the problem specific fitness function
• Krall & Menzies explored the optimization of complex NASA models of air traffic control. After discussing the simulation needs of NASA’s research scientists, they concluded that those models would take three months to execute, even utilizing NASA’s supercomputers [32].
• Repeat till stopping criteria returns true: – Create new population using problem specific reproduction operators – Evaluate the newly generated population
The intention of SWAY is to reduce that running time without sacrificing the quality of results.
– Select solutions from a new population for the next generation. This selection is done using a elitist strategy which mimics the ´the survival of the fittest´.
4. SWAY
Depending on the selection strategy, most MOEAs can be classified into:
This section describes SWAY, the multi-objective optimization algorithm. After this, the rest of the paper conducts experimental evaluations of SWAY. SWAY, short for the Sampling WAY, explores one of the techniques to reduce the number of evaluations for cases, where evaluating a possible solutions is expensive. SWAY starts with the randomly generating solutions. Since evaluating solutions can be very expensive (with respect to time, computation resources), SWAY recursively divides the candidates into two parts using the SPLITs operator. The decision of splitting depends on the underlying dimension of the decision space. Using the underlying dimension, decision space (d dimensions) is transformed into lower dimensional space (e dimension) such that d À e . SWAY’s SPLIT operator informed by only the extreme points of the transformed space. The algorithm in Figure 1 describes these steps. The key principles which enables SWAY to reduce the number of evaluations are:
• Pareto Dominance Based: Pareto dominance based algorithms uses the binary domination to select solutions for the successive generations. These techniques are used in tandem with niching operators to preserve the diversity among the solutions. Examples: NSGA-II [13], PAES [29], SPEA2 [60] • Decomposition Based: Decomposition based algorithms divide the problem into a set of sub-problems, which are solved simultaneously in a collaborative manner. Each sub-problem is usually an aggregation of the objectives with uniformly distributed weight vectors. Examples: MOGLS [25], MOEA/D [57] • Indicator Based: Indicator based methods work by establishing a complete order among the solutions using a single scalar metric like hypervolume etc. Examples: HypE [1], IBEA [59]
1. Sample rather than evolve The MOEAs use the Darwinian philosophy of ‘survival of the fittest’to evolve a population towards a fitter or preferred solutions. This require iterations or generations of reproduction operators and selection operators to find solutions. SWAY takes a rather unorthodox approach by
All the above algorithms typically evaluate thousands to millions of individuals as part of their execution. Fundamental challenge in many problems in engineering and other domains is evaluation of a solution is very expensive: 4
eliminating the need for reproduction operators and uses a novel selection technique. To counter the absence of reproduction operators, SWAY generates ten to hundred times more population and the use a problem specific selection operator (SPLIT function).
# split items by proximity to 2 distant items def Csplit(items, middle): rand = random.choose( items) # ’FASTMAP’, step1 east = furthest(rand, items) # ’FASTMAP’, step2 west = furthest(east, items) # east,west are now 2 distant items c = distance(west, east) for x in items: a = distance(x,west) b = distance(x,east) # find the distance of ’x’ along the line running # west to east using cosine rule x.d = ( a*a + c*c - b*b )/( 2*c+ 0.0001 ) items = sorted(items, key = d) # sorted by ’d’ return west, east, items[:middle], items[middle:] # euclidean distance def distance(xs, ys): # normalize x in xs, and y in ys # let tmp be the sum of (x-y)^2 # let n be the number of decisions return sqrt(tmp) / sqrt(n) # so 0 i . NSGA-II’s elite sampling favors the least-crowded solutions in the better bands.
6.1. Optimizers In this framework, each pair (d , o) is a solution within a population. Some individuals dominate; i.e. are better than others. Two forms of domination are binary and continuous domination. In binary domination, one individual x dominates y if all of x ’s objectives are never worse than the objectives in y but at least one objective in solution x is better than its counterpart in y ; i.e. where (≺, Â) tests if an objective score in one individual is (worse,better) than the other individual. An alternate culling method is the continuous domination predicate [58] that favors y over x if x “losses” least (refer to equation 4) Domination is used in selection step2d of the EA algorithm described in the introduction. In this paper we consider NSGAII [13] and SPEA2 [61] along with GALE. We use NSGA-II and SPEA2 since:
• GALE [31] only applies domination to two distant individuals X , Y . If either dominates, GALE ignores the half of the population near to the dominated individual and recurses on the point near the non-dominated individual. NSGA-II and SPEA2 use binary domination. Binary domination has issues for multi-goal optimization [47] since, as the objective dimensionality grows, large sets of individuals become non-dominated. Accordingly, other EAs such as GALE use continuous domination since it can distinguish better individuals in multi-goal contexts (which according to Sayyad et al. [47] is for three goals or more). Note that, GALE apart from SWAY (in 1), included a mutation strategy. GALE’s recursive splitting of the n items in population i resulted in leaf populations of total size m . To build population i + 1, GALE then used a domination function to find which of two distant individuals X , Y in each leaf is “better”. All the m individuals in those leaves were mutated towards the “better” end of their leaf. GALE then builds the population i +1 back up to size n , by rerunning generate (step1 of EA) n − m times. Also note unlike NSGA-II and SPEA-2, GALE only evaluates 2 log n individuals (east,west pairs in its recursive binary chop) rather than n individuals. SWAY evaluates even fewer individuals than GALE since it terminates after the first generation.
• In his survey of the SSBE literature in the period 2004 to 2013, Sayyad [46] found 25 different algorithms. Of those, NSGA-II [13] or SPEA2 [61] were used four times as often as anything else. • This trend is can be observed in the more recent SSBSE’16, where NSGA-II and SPEA2 was used three times as often as any other EA 1 . The algorithms used in the paper can be described as follows: 1 http://tiny.cc/ssbse17_survey
9
Therefore, to assess feasibility of our sampling policies, we must consider:
6.2. Performance Measures We use three metrics to evaluate the quality of results produced by the optimizers:
• Performance scores generated from SWAY when compared to other MOEAs
• #Evaluations: Number of times an optimizer calls a model or evaluate a model.
• Can SWAYbe used to super-charge other MOEAs such that the performance is super-charged MOEA is better than standard MOEA?
• Spread: Deb’s spread calculator [13] includes the term PN −1 (d i −d ) where d i is the distance between adjacent soi lutions and d is the mean of all such values. A good spread makes all the distances equal (di ≈ d ), in which case Deb’s spread measure would reduce to some minimum value.
The above considerations lead to four research questions: RQ1: Can SWAY perform ’as good as’ traditional MOEA in unconstrained models? Software engineering has seen numerous case studies where EAs like SPEA2, NSGA-II etc. have been successfully used to solve SE problems. The unconstrained models considered in the paper are POM and XOMO. Both the models have a continuous decision space and have no constraints. In this paper we use three measures to evaluate the effectiveness of SWAY namely, Spread, Hypervolume and number of evaluations. RQ2: Can SWAY perform ’as good as’ traditional MOEA in constrained models? Constrained model considered in this paper is MONRP, which unlike the unconstrained models is defined in discrete space and has higher dimensionality. Note that RQ2 particularly useful since it can exposes various sensitivities of SWAY. RQ3: Can SWAY be used to boost or super-charge the performance of other MOEAs Since, SWAY uses very few evaluations, it can be potentially be used as a preprocessing step for other MOEAs for cases where function evaluations are not expensive.
• HyperVolume: The hypervolume measure was first proposed in [62] to quantitatively compare the outcomes of two or more MOEAs. Hypervolume can be thought of as ’size of volume covered’. Note that hypervolume and spread are computed from the population which is returned when these optimizers terminate. Also, higher values of hypervolume are better while lower values of spread and #evalautions are better. These results were studied using non-parametric tests (the use non-parametrics for SBSE was recently endorsed by Arcuri and Briand at ICSE’11 [40]). For testing statistical significance, we used non-parametric bootstrap test 95% confidence [18] followed by an A12 test to check that any observed differences were not trivially small effects; i.e. given two lists X and Y , count how often there are larger numbers in the former list (and there there are ties, add a half mark): #(x>y)+0.5∗#(x=y) (as per Vargha [52], we say a = ∀x ∈ X , y ∈ Y |X |∗|Y | that a “small” effect has a < 0.6). Lastly, to generate succinct reports, we use the Scott-Knott test to recursively divide our optimizers. This recursion used A12 and bootstrapping to group together subsets that are (a) not significantly different and are (b) not just a small effect different to each other. This use of Scott-Knott is endorsed by Mittas and Angelis [40] and by Hassan et al. [21].
7.2. Experimental Rig In the following, we compare EA vs SWAY for 20 repeats of our two unconstrained models through our various scenarios. All the optimizers use the population size recommended by their original authors; i.e. n = 100. But, in order to test the effects of increased sample, we run two versions of SWAY: • SWAY2 : builds an initial population of size 102 = 100.
7. Experiments
• SWAY4: builds an initial population of size 104 = 10, 000.
7.1. Research Questions We formulate our research questions in terms of the applicability of the techniques used in SWAY. As our approach promotes the use to sampling instead of evolutionary techniques, it is a natural question, ‘how is this possible?’. ‘Sampling instead of evolution’is very counter-intuitive to the practitioners since, EA has been widely accepted and adopted by the community. Also, if we are only sampling from 100/10000 solutions, it is possible to miss solutions, which are not present in the initial population. These are valid arguments while trying to find near-optimal solutions to problems with competing objectives. It may be argued that sampling is such an straight forward approach so it is critical to evaluate the effectiveness of such sampling method on variety of software engineering both constrained and unconstrained, discrete as well as continuous. It is also interesting to see how the techniques of SWAY can be borrowed by the traditional MOEAs to improve the performance.
One design choice in this experiment was the evaluation budget for each optimizer: • If we allow infinite runs of EA that would bias the comparison towards EAs since better optimizations might be found just by blind luck (albeit at infinite cost). • Conversely, if we restrict EAs to the number of evaluations made by (say) SWAY4 then that would unfairly bias the comparison towards SWAY since that would allow only a generation or two of EA. To decide this issue, we returned to the motivation for SWAY discussed in section 1.1 of this paper. SWAY is most useful when evaluating a solution using the model is expensive. Hence, our evaluation budget was selected to demand that SWAYing had to work using far fewer evaluations that EA. We 10
med.
IQR
SWAY 2 GALE SWAY 4 NSGA-II SPEA 2
91 99 104 151 156
22 18 13 13 17
GALE SWAY 4 SWAY 2 NSGA-II SPEA 2
93 102 126 135 143
46 15 39 16 10
SWAY 4 SWAY 2 GALE NSGA-II SPEA 2
75 84 99 112 128
s s s
s
s
7 25 10 24 20
Rank using med. IQR Pom3a 1 SPEA 2 106 0 1 NSGA-II 106 0 2 SWAY 4 104 0 3 SWAY 2 102 3 4 GALE 100 2 Pom3b 1 NSGA-II 202 27 1 SPEA 2 184 8 2 SWAY 4 137 10 3 GALE 95 23 3 SWAY 2 91 12 Pom3c 1 NSGA-II 105 0 1 SPEA 2 105 0 2 SWAY 4 103 1 3 SWAY 2 101 1 3 GALE 100 1
s s
s
s
s s
s
s
s
s
a. Spread (less is better)
Rank Flight 1 2 2 2 2 Ground 1 1 2 2 2 OSP 1 1 2 2 2 OSP2 1 2 2 3 4
using
med.
IQR
GALE SWAY 2 SWAY 4 NSGA-II SPEA 2
100 130 131 143 144
15 31 24 12 12
GALE SWAY 2 SWAY 4 NSGA-II SPEA 2
100 126 169 169 180
48 37 15 23 20
SWAY 2 GALE SWAY 4 SPEA 2 NSGA-II
88 100 152 152 155
20 31 17 9 9
GALE SWAY 2 SWAY 4 SPEA 2 NSGA-II
100 210 281 311 355
85 115 17 34 38
s
s
s
s
s
u u u u u
Rank using med. IQR Flight 1 NSGA-II 147 1 1 SPEA 2 147 1 2 SWAY 4 140 5 3 GALE 100 3 3 SWAY 2 100 9 Ground 1 NSGA-II 205 1 1 SPEA 2 204 1 2 SWAY 4 196 11 3 SWAY 2 157 52 3 GALE 100 17 OSP 1 NSGA-II 261 1 1 SPEA 2 261 1 2 SWAY 4 245 8 3 SWAY 2 148 70 3 GALE 100 0 OSP2 1 NSGA-II 171 1 1 SPEA 2 171 0 2 SWAY 4 163 10 3 SWAY 2 101 29 3 GALE 100 46
s s
s s
s
s
s s s
s
s
s s
s
s
s
s
102
a. Spread (less is better)
NSGA-II
POM3B
POM3C
SPEA2
NSGA-IISC
SPEA2SC
SWAY4
104
103
102
u u u
s s
SWAY4
c. Median evaluations
u u u
s
s
SWAY2
103
POM3A
u u u
s
s
GALE
101
u u u
s s
SPEA2
104
b. Hypervolume (more is better)
s s
s
NSGA-II
u u u u u
Model Evaluation #
using
Model Evaluation #
Rank Pom3a 1 1 1 2 2 Pom3b 1 1 2 2 2 Pom3c 1 1 2 3 3
101
XOMO-Flight
XOMO-Ground
XOMO-OSP
XOMO-OPS2
c. Median evaluations
b. Hypervolume (more is better)
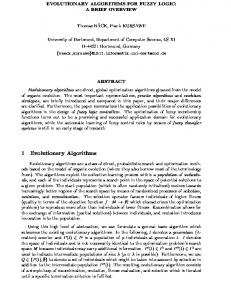
Figure 7: Spread and hypervolumes seen in 20 repeats. Med is the 50th percentile and IQR is the inter-quartile range; i.e. 75ths ) show the median as a round dot within the IQR (and if the IQR is 25th percentile. Lines with a dot in the middle (e.g. vanishingly small, only a round dot will be visible). All results sorted by the median value: spread results are sorted ascending (since less spread is better) while hypervolume results are sorted descending (since more hypervolume is better). The left-hand side columns Rank the optimizers. The Smaller the Rank, the better the optimizer; e.g. top-left, SWAY2, GALE, SWAY4 are top ranked for spread within Pom3a with a Rank of “1”. One row has a larger “Rank” than the next if (a) its median values are worse and (b) a statistical hypothesis test concurs that the distributions in the two rows are different (with a non-small effect size). Rank is computed using Scott-Knott, bootstrap 95% confidence, and the A12 test (see text for details). Red dots “ ” denote median results that are “reasonable close” to the top-ranked result (see text for details).
•
1 2 3 50-4-5-0-090 1 2 3 50-4-5-4-110
SWAY4 SPEA2 NSGAII
105 112 130
1 2 3 50-4-5-4-090 1 2 2
SWAY4 97 15 SPEA2 113 11 NSGAII 125 28
SWAY4 98 8 SPEA2 137 45 NSGAII 167 34
SWAY4 102 12 SPEA2 119 21 NSGAII 133 21
s s
14 23 19
s
s s
s
a. Spread (less is better)
s s
s
s
s
s
Rank 50-4-5-0-110 1 1 2 50-4-5-0-090 1 1 1 50-4-5-4-110 1 2 2 50-4-5-4-090
Treatment Median IQR
1 2 2
SWAY4 73 3 SPEA2 63 4 NSGAII 64 5
SPEA2 NSGAII SWAY4
157 154 111
NSGA-II
16 13 6
s s s s
SWAY4 103 8 SPEA2 105 20 NSGAII 104 19 SWAY4 145 5 SPEA2 68 3 NSGAII 66 5
s
s s s s
s s
SPEA2
SWAY4
104
Model Evaluation #
Rank Treatment Median IQR 50-4-5-0-110
103
102
s
b. Hypervolume (more is better)
101
50-4-5-0-110
50-4-5-0-090
50-4-5-4-110
50-4-5-4-090
c. Median evaluations
Figure 8: Spread and hypervolumes seen in 20 repeats for constrained problem (MONRP). The results is presented in the same format as Figure 7.
11
found the median number of evaluations e 1 = 50 seen across all our slowest versions of SWAY (which is SWAY4), then allowed EA to evaluate 40 times the value of e 1 and we call this e 2 (e 2 = ∆e 1 , where ∆ = 40).
a “reasonableness” test. Consider the hypervolumes achieved in Pom3a: 106,106,104,102,100 where the best hypervolume (of 106) came from SPEA2 while SWAY4 generated very similar hypervolumes of 104. Our statistical tests divide optimizers with median values of 106,106,104,102,100 into four Ranks: which may not be “reasonable”. As pragmatic engineers, we are hard-pressed to recommend evaluating a very slow model 2, 000 times to achieve a hypervolume of 106 (using SPEA2) when 50 evaluations of SWAY4 would achieve a hypervolume of 104. In Figure 7, we mark all the results that we think are “reasonable close” to the top-ranked result with a red “ ” dot. SWAY4 is always marked as “reasonable close” to the EAs. We acknowledge that the use of the “reasonableness” measure in the last paragraph is somewhat subjective assessment. Also, for some ultra-mission critical domains, it might indeed be required to select optimizers that generate hypervolumes that = 2% better than anything else. However, we susare 106−104 104 pect that many engineers would gladly use a method that is 50 times faster and delivers (very nearly) the same results.
8. Results 8.1. RQ1 Can SWAY perform ’as good as’ traditional MOEA in unconstrained models?
•
Figure 7 shows results obtained by all the optimizers, compared to the results obtained using SWAY techniques. The figure shows the median (med.) and inter quartile range (IQR 75th-25th value) for all the optimizers and SWAY techniques. Horizontal quartile plots show the median as a round dot within the inter-quartile range. In the figure, an optimizer’s score is ranked 1 (Rank=1) if other optimizers have (a) worse medians; and (b) the other distributions are significantly different (computed via Scott-Knott and bootstrapping); and (c) differences are not a small effect (computed via A12). Figure 7(a) shows the spread results and can be summarized as: the spreads found by standard EAs (NSGA-II and SPEA2) were always ranked last in all scenarios. That is, for these scenarios and models, to achieve a good distribution of results, it is better to sample than evolve. Figure 7(b) shows the hypervolume results and can be summarized as: GALE and SWAY2 were always ranked last in all scenarios. That is, for these scenarios and models, to find best optimization solutions, it is insufficient to explore just a few evaluations of a small population (e.g. the 100 instances explored by SWAY2 and GALE). Figure 7(c) shows the number of evaluations for our optimizers. Note that:
8.2. RQ2 Can SWAY perform ’as good as’ traditional MOEA in constrained models? The results of RQ1 recommends use SWAY 4. We also observe that: • SWAY 4 is better than SWAY 2 • SWAY 4 is better than GALE Accordingly for the constrained models we do not consider GALE and SWAY 2. Further, to compare the algorithms based on an extra parameter-’constraint level - how constraint the problem is’ along with the parameters mentioned in section 6.2. As seen in Figure 8, SPEA2 performs worse that SWAY4 in term of spread. When comparing results from Hypervolume, SPEA2 performs better than SWAY4 in only one case (MONRP-50-4-5-4-100). Please note that the MONRP-50-4-54-110 is the least constrained problem (among the constrained problems) considered in this paper. Hence, we cannot recommend this SPEA2 as our preferred method, for the MONRP family of problems. We observe in Figure 8 that:
• GALE requires more evaluations than SWAY since SWAY terminates after one generation while GALE runs for multiple evaluations. • Even though SWAY4 explores 100 times the population of SWAY2, it only has to evaluate logarithmically more individuals- so the total number of extra evaluations for SWAY4 may only increase 2 to 4 times from SWAY2.
• SWAY4 has the lowest spreads (lower the better) and highest hypervolume (higher the better) in most cases.
• The standard optimizers (NSGA-II and SPEA2) require orders of magnitude more evaluations. This is because these optimizers evaluate all n members of each population, GALE and SWAY, on the other hand, only evaluate 2logn members.
• The exception being MONRP-50-4-5-4-100, which is the least constrained along the four variants. That said we see that SWAY is the top ranked optimizer in 44 cases and 34 with respect to. Spread and Hypervolume respectively.
Figure 7(a) and Figure 7(b) made a case against SWAY2, GALE, and our EAs. As to SWAY4, we note that SWAY4’s spread is never worse than standard EAs (and sometimes it is even best: see the Pom3s spread results). As to the SWAY4 hypervolume results, in one case (Pom3b), SWAY4 is clearly inferior to standard EAs (NSGA-II and SPEA2). But in all the other results, SWAY4 is an interesting option. Often it is ranked second after EAs but those statistical rankings do not always pass
• Section (c) of Figure 8 compares the number of evaluations required by SWAY and other optimizers. Note that SWAY requires 20 times less evaluations compared to the standard optimizers, while performing reasonably well in other quality metrics. In summary, the MONRP results nearly always endorse the use of SWAY4. 12
using
med.
IQR
NSGAII SPEA2 NSGAIISC SPEA2SC
151 22.97 152 24.19 153 20.33 156 24.93
SPEA2SC SPEA2 NSGAII NSGAIISC
130 131 135 139
NSGAIISC NSGAII SPEA2 SPEA2SC
109 24.23 112 24.33 121 14.64 121 9.58
s s
12.86 20.0 17.27 18.17
s s
s
NSGA-II
Rank using med. IQR Pom3a 1 SPEA2 106 0.43 1 NSGAIISC 106 0.34 1 NSGAII 106 0.54 1 SPEA2SC 106 0.57 Pom3b 1 SPEA2 202 0.74 1 NSGAIISC 202 0.93 1 NSGAII 202 0.55 1 SPEA2SC 202 1.19 Pom3c 1 NSGAII 105 3.04 1 SPEA2SC 105 4.39 2 SPEA2 104 3.75 2 NSGAIISC 104 6.02
s s s s
s
s s
s s s s
NSGA-IISC
SPEA2SC
s s s s
103
102
101
POM3A
b. Hypervolume (more is better)
a. Spread (less is better)
SPEA2
104
s s s s
Model Evaluation #
Rank Pom3a 1 1 1 1 Pom3b 1 1 1 2 Pom3c 1 1 2 2
POM3B
POM3C
c. Median evaluations
using
med.
IQR
SPEA2 SPEA2SC NSGAIISC NSGAII
129 134 137 143
7.77 10.02 20.89 22.42
NSGAII SPEA2 SPEA2SC NSGAIISC
169 13.32 170 14.51 170 6.28 178 15.12
SPEA2SC NSGAIISC SPEA2 NSGAII
148 10.57 153 13.05 155 16.13 155 16.62
SPEA2 SPEA2SC NSGAII NSGAIISC
344 12.16 344 9.62 355 19.43 362 14.97
s
s s s s s
Rank using med. IQR Flight 1 SPEA2 146 0.97 1 NSGAIISC 147 0.74 1 NSGAII 147 1.31 1 SPEA2SC 147 1.25 Ground 1 SPEA2 205 1.19 1 NSGAII 205 0.94 2 NSGAIISC 203 0.85 2 SPEA2SC 203 0.89
s
s
s s s s s s
OSP 1 1 1 1 OSP2 1 1 1 1
s s
NSGA-II s s s s s s s s
SPEA2 NSGAIISC NSGAII SPEA2SC
261 261 261 261
1.22 1.0 1.16 1.51
s s s s
SPEA2 NSGAII SPEA2SC NSGAIISC
171 171 171 171
1.37 1.03 0.95 0.91
s s s s
d. Spread (less is better)
10
Model Evaluation #
Rank Flight 1 1 3 2 Ground 1 2 2 3 OSP 1 2 2 2 OSP2 1 1 2 2
SPEA2
NSGA-IISC
SPEA2SC
4
103
102
101
XOMO-Flight
XOMO-Ground
XOMO-OSP
XOMO-OPS2
e. Hypervolume (more is better) f. Median evaluations
1 2 3 4 50-4-5-0-090 1 2 3 3 50-4-5-4-110 1 2 3 3 50-4-5-4-090 1 1 2 2
SPEA2 NSGAII SPEA2SC NSGAIISC
127 130 137 148
SPEA2 SPEA2SC NSGAII NSGAIISC
140 158 167 183
SPEA2 SPEA2SC NSGAII NSGAIISC
102 11.8 114 22.04 125 24.87 145 45.14
SPEA2 SPEA2SC NSGAII NSGAIISC
117 122 133 149
s s s
0.0 0.0 0.0 0.0
s
23.18 30.77 30.74 37.95
29.07 20.85 32.41 39.47
g. Spread (less is better)
s
s
s s
s
s s
s
s
s
s
s
Rank 50-4-5-0-110 1 1 2 2 50-4-5-0-090 1 1 1 1 50-4-5-4-110 1 2 2 3 50-4-5-4-090 1 1 1 1
Treatment Median
NSGA-II
IQR
NSGAII SPEA2 SPEA2SC NSGAIISC
154 162 141 139
17.94 17.18 19.17 12.51
SPEA2 NSGAII SPEA2SC NSGAIISC
103 22.4 104 15.67 102 15.23 101 21.28
SPEA2 NSGAII SPEA2SC NSGAIISC
71 6.28 66 10.12 64 5.9 56 15.55
s
NSGAII SPEA2 SPEA2SC NSGAIISC
64 14.78 66 12.72 70 9.87 64 19.3
s s s s
s s s
s s s s
s
s
s s
SPEA2
NSGA-IISC
SPEA2SC
104
Model Evaluation #
Rank Treatment Median IQR 50-4-5-0-110
103
102
101
50-4-5-0-110
50-4-5-0-090
50-4-5-4-110
50-4-5-4-090
h. Hypervolume (more is better) i. Median evaluations
Figure 9: SWAY results were used to seed the initial population of the traditional MOEA. Spread, hypervolumes and evaluation seen in 20 repeats. This figure is of the same format as Figure 7 • The super-charged version of the algorithm would have lower spreads or higher hypervolumes that otherwise;
8.3. RQ3 Can SWAY be used to boost or super-charge the performance of other MOEAs?
• The results from the super-charged version have a different statistical rank (as listed in the first column of these results).
We compare EAs which were super-charged with the results from SWAY. Super-charging a EA means seeding the initial population with the results obtained from SWAY. The supercharged NSGA-II and SPEA2 is called NSGA-IISC and SPEA2SC respectively. The results from super-charging are shown in Figure 9. Results that endorse super-charging would have the following form:
Figure 9 for NSGA-II and SPEA2 there are 22 cases (each) where results might appear that endorse super-charging. • For NSGA-II, results endorsing super-charing appear zero times; 13
• For SPEA2, results endorsing super-charing appear once for spread for OSP and once for hypervolumes for Pom3c. Overall, the results endorsing super-charging occur so rarely that we cannot endorse using SWAY as a pre-processor to other optimisers. We conjecture that the reason for the competency of SWAY and NSGA-II and SPEA2 are very different and so SWAY cannot help the other algorithms. 9. Why does this work? In this section, we present an analysis to understand why SWAY achieves such low spread scores and hypervolume scores similar to more complicated algorithms. We hypothesize that the configuration space of the problem space lie on a low dimensional manifold. 9.1. History Menzies et. al [36] demonstrated how to exploit the underlying dimension to cluster data to find local homogeneous data regions in an otherwise heterogeneous data space. The authors used an algorithm called WHERE, which recurses on two dimensions synthesized in linear time using a technique called FASTMAP [19]. The use of underlying dimension has been endorsed by various other researchers [3, 15, 4, 56]. There are numerous other methods in the literature, which are used to learn the underlying dimensionality of the data set such as Principal Component Analysis (PCA) [26] 2 , Spectral Learning [48] and Random Projection [5]. These algorithms use different techniques to identify the underlying, independent/orthogonal dimensions to cluster the data points and differ with respect to the computational complexity and accuracy. We use WHERE since it computationally efficient O(2N ), while still being accurate. 9.2. Testing Technique Given our hypothesis the problem space lies in a lower dimensional hyperplane — it is imperative to demonstrate that the intrinsic dimensionality of the configuration space is less than the actual dimension. To formalize this notion, we borrow the concept of correlation dimension from the domain of physics [22]. The correlation dimension of a dataset with k items is found by computing the number of items found at distance withing radius r (where r is the Euclidean distance between two configurations) while varying r . This is then normalized by the number of connections between k items to find the expected number of neighbors at distance r . This can be written as: n X n X 2 I (||x i , x j || < r ) k(k − 1) i =1 j =i +1 ( 1, if x