The Psychological Record, 2011, 61, 583–598
Beyond the Shadow of a Trait: Understanding Discounting Through Item-Level Analysis of Personality Scales Shawn R. Charlton, Bradley D. Gossett, and Veda A. Charlton University of Central Arkansas
Temporal discounting, the loss in perceived value associated with delayed outcomes, correlates with a number of personality measures, suggesting that an item-level analysis of trait measures might provide a more detailed understanding of discounting. The current report details two studies that investigate the utility of such an item-level analysis. Study 1 demonstrates that discount rates correlate with the overall score as well as with 11 individual items on the Total SelfControl Scale (TSCS). Study 2 demonstrates a correlation between discount rates and the Consideration of Future Consequences (CFC) scale, but not with a measure of general self-efficacy. An item-level analysis of the CFC found that the CFC-Immediate subscale and four individual items correlated with discount rates. Overall, these two studies sketch an initial picture of how item-level analyses of existing trait measures can better inform our understanding of discounting. Key words: CFC scale, TSCS scale, impulsivity, personality measure, selfcontrol, temporal discounting
“To
them ,
I
said, the truth would be nothing but the shadow of the images .”
—P lato In the “Allegory of the Cave,” Plato asks Glaucon to imagine a cave in which prisoners are shackled so that they see only the back wall of a cave. Under these circumstances, the prisoners know the world only through shadows cast on the wall by strangers moving past the mouth of the cave. Plato argues that the distorted shadows would eventually become real to the prisoners as they develop explanations of the world through their interpretation of the shadows’ characteristics and actions. The shadows are, of course, not the real world, but rather the representation of actions that Bradley Gossett is now at Idaho State University. Financial support for this project was provided by a UCA University Research Council Grant and a Psi Chi Faculty Sponsor Grant, both to the first author. Special thanks to Hannah Abbott, Kristin Ktachuk, and the other research assistants from the Behavioral and Social Decisions Laboratory for assistance with data collection. Also, thanks to Cathy Sales, Cade Charlton, Mara Whiteside, and Lori Parker for comments on this article. Correspondence concerning this article should be addressed to Shawn R. Charlton, University of Central Arkansas, 201 Donaghey, 257 Mashburn Hall, Conway, AR 72035. E-mail:
[email protected]
584
CHARLTON et al.
manifest in the real world. While the shadows comprise as much truth of their surroundings as available to the prisoners, a full understanding would require a shift of focus from the shadows to the shadow casters.1 Though not the original context in which the “Allegory of the Cave” was intended, this analogy can serve as a reminder that derived psychological measures are reflections of actual behavior. One widely used, derived psychological measure is temporal, or delay, discounting (TD), which can be defined as (a) the decrease in the perceived (or psychological) value of an outcome as the time to its availability increases or (b) a decrease in the reinforcing value of an outcome as the delay to its occurrence lengthens (Critchfield & Kollins, 2001). The degree to which future rewards depreciate in value is well described using a form of Mazur’s (1987) hyperbolic equation: Vp =
V 1 + kD ,
(1)
where V P is the present value of the outcome, V is the absolute value, D is the delay to the outcome’s availability, and k is the discount rate; thus, k is a numerical index of reward/outcome devaluation as a product of extended delay—the larger the k value, the greater the impact of delay on outcome value. Most discounting studies determine the k value by asking participants to complete a series of choices between varying hypothetical monetary outcomes presented at different delays (D). Nonlinear regression using a hyperbolic equation like Equation 1 then estimates the k value based on the observed values of VP at each of the presented delays. An alternative approach is to use the area under the curve (AuC), a model-f ree estimate of discount rates, to produce an estimate of discounting without the need for nonlinear regression (Myerson, Green, & Warusawitharana, 2001). Whether estimating a k value using nonlinear regression or using the AuC, the end result is that the discount rate is based on data from self-report measures and, thus, both the k value and AuC may be considered indirect estimates of real-world behavior.2 That k values are a reflection of real-world behaviors of interest is evident in a large literature documenting individual differences in discount rates. One of the most discussed contributions pertains to greater levels of discounting among substance abusers than non-d rug-u sing controls. For instance, increased discount rates have been shown across a variety of substances, including alcohol (Petry, 2001a; Vuchinich & Simpson, 1998), cocaine (Coffey, Gudleski, Saladin, & Brady, 2003), heroin (Kirby, Petry, & Bickel, 1999), nicotine (Baker, Johnson, & Bickel, 2003; Bickel, Odum, & Madden, 1999), and opiates (Madden, Bickel, & Jacobs, 1999; Yi, Buchhalter, 1 This is, of course, a simplification of one element of the argument laid out by Plato in the allegory. However, it is unnecessary to fully develop his argument in order to highlight how the idea of shadows can illuminate our understanding of psychological processes. 2 An interesting comparison can be made between indirect measures and second-order dependent measures. Much of the literature in experimental behavior analysis relies on a second- order dependent variable: response rate. A response rate is an empirically derived measure of behavior that relies on two directly observed measures: number of responses and amount of time. As described above, discounting differs from response rate in that the measures used to calculate the discount rate are indirectly observed via self- report. The functional difference between second-order dependent measures and measures derived from self-report data is significant.
SHADOW OF a trait
585
Gatchalian, & Bickel, 2007). Furthermore, research indicates that discount rates are negatively correlated with college GPA (Kirby, Winston, & Santiesteban, 2005), long-term financial strategies and/or savings (Joireman, Sprott, & Spangenberg, 2005), performance in a single-player prisoner’s dilemma game (Harris & Madden, 2002; Yi, Johnson, & Bickel, 2005), frequency of cooperative choices on group tasks/activities (Critchfield & Atteberry, 2003), and lower levels of risky-choice behavior (Chesson et al., 2006; Dixon, Marley, & Jacobs, 2003; Odum, Madden, Badger, & Bickel, 2000; Petry, 2001b). The breadth of real-world behaviors that differ across individual discount rates highlights the usefulness of the discounting concept in understanding behavioral differences. Because discount rates are associated with socially important behavioral patterns, it is important to develop a detailed understanding of the specific behavioral patterns that vary with discount rates. For example, the existing literature demonstrates that elevated discount rates are suggestive of increased drug consumption. However, substance abuse is associated with a variety of distinct behaviors that differ from those engaged in by non- substance-u sing controls. Which of these behavior patterns are reflected by the elevated discount rates? In general, the utility of measuring discount rates will increase as the number of specific behavioral patterns predicted by discount rates increases (Green & Myerson, 2004). One strategy for identifying the component behaviors that correlate with discount rates is through the examination of existing inventories of behavior, such as personality scales. Like discounting, a personality scale is an aggregate measure of self-reported behaviors. However, while discounting tasks focus on a single behavioral dimension (choice between potential immediate and delayed payoffs), personality scales typically provide lists of distinct behaviors that have been shown to share some underlying relationship (the “trait”). A useful method for understanding the relation between a trait and the items used to calculate the trait is to think of the analogy of a nation (such as the United States) and its individual cities/townships (e.g., Los Angeles, New York). While the United States can, as a whole, be described as a single entity, it is recognized that this whole is a general description of discrete parts (a fact to which anyone who has experienced both New York and Los Angeles would attest). The same is true of trait measures. The total score on the measure is a general overview of a series of choices. The individual items, however, contain additional information that is often “lost” when added into the total score (similar to the loss of information when one generalizes about the United States as a whole as opposed to New York and Los Angeles separately). Considering that a personality measure consists of both a trait score and individual items, it is possible to use these existing behavioral inventories to better understand the behaviors associated with observed discount rates by examining the overall score and the individual items on the trait measure. The first part of this process—comparing discount rates to overall scores on trait measures—has been done with some success. Several studies demonstrate that discount rates correlate with diverse types of trait measures, including the Impulsivity (Madden, Petry, Badger, & Bickel, 1997; Richards, Zhang, Mitchell, & de Wit, 1999) and Extraversion (Richards et al., 1999) subscales of the Eysenck Personality Inventory (Eysenck, Eysenck, & Barrett, 1985), impulsivity scores on the Eysenck Personality Questionnaire-Revised
586
CHARLTON et al.
(EPQ-R ; Ostaszewski, 1996), the Barratt Impulsiveness Scale (Kirby et al., 1999), the Impulsiveness and Adventuresomeness subscales of the I-5 (Kirby et al., 1999), the Disinhibition scale of the Sensation Seeking Scale (Richards et al., 1999), the Experience Seeking, Disinhibition, and Liveliness scales of the I-5 (Vuchinich & Simpson, 1998), and the Thrill and Adventure Seeking subscale of the Sensation-S eeking Scale-Version V (Vuchinich & Simpson, 1998). The correlations between discount rates and these personality measures suggest that some of the behaviors used to create the personality measures comprise items that relate to discount rates. The current investigation focused on the second step in the two-step process suggested previously by comparing discount rates to the individual items that make up a personality measure. Although correlations between discount rates and personality scales are informative, the existing literature offers little insight into the specific items on personality scales with which discount rates are most closely associated. Returning to the United States analogy, demonstrating that discount rates correlate with a personality measure is tantamount to knowing only that a person is from the United States. This information is useful, but it still leaves a lot of territory to cover. By conceptualizing a personality scale as a list of items representing related behaviors, an item-level analysis shifts the level of analysis from a comparison of derived “psychological shadows” toward an investigation of the behaviors that cast the shadows. Moreover, approaching personality measures in this way may allow one to “see” the behavioral overlap between discounting and personality measures, which will aid in mapping out the meaningful relations between discounting and trait measures of behavior.
Study 1 The focus for this study was on the relation between the individual items on the Total Self-Control Scale (TSCS; Tangney, Baumeister, & Boone, 2004) and discount rates derived from a computer-based measure of discounting. The TSCS is a general trait measure of self-control that correlates positively with a breadth of “good” behaviors, such as grade point average, decreased alcohol abuse, relationship quality, interpersonal skills, and psychological adjustment (Tangney et al., 2004). Additionally, Schmeichel and Zell (2007) demonstrated that participants with high scores on the TSCS performed better on two behavioral tests of self-control: refraining from blinking during a 2-min test period and spending time with a hand submerged in cold water. The TSCS was selected for evaluation in the current study not only because of its wide acceptance as a trait measure of self-control but also because it shares some of the same correlates as that of TD (e.g., drug abuse, grade point average). Finally, there is reason to believe that TSCS scores and discount rates correlate above and beyond a simple demonstration of mutual behavioral relations. For instance, Joireman, Balliet, Sprott, Spangenberg, and Schultz (2008) found a positive correlation between scores on the TSCS, the Consideration of Future Consequences (CFC; Strathman, Gleicher, Boninger, & Edwards, 1994) scale, and the CFC-Future subscale (an index of the degree to which the long-d istance outcomes are included in current decisions). A negative correlation was also observed between TSCS scores and the CFC-I mmediate subscale (a measure of the degree to which immediate outcomes are weighted). Joireman and colleagues further demonstrated
SHADOW OF a trait
587
negative relations between discount rates and scores on the CFC-I mmediate scale but not the CFC-Future scale. However, a direct comparison was not made between TSCS scores and temporal discounting.
Method Participants. One hundred fifty-one (n = 151) undergraduate students participated in the study (55% female; n = 83), with an average age of 20.14 (SD = 4.63) years. Participant age did not differ across gender (t148 = −1.40, p = .16). Measures. The following measures were used to assess overall self- control and temporal discounting. TSCS. Participants completed a computer-based version of the TSCS. The 36-item scale presented one statement at a time, with item order randomized across participants. Sample items include “I am good at resisting temptation,” “I never allow myself to lose control,” and “I eat healthy foods.” Each item was scored on a Likert-t ype scale ranging from 1 (not at all) to 5 (very much) based on how accurately the participant felt the items described their typical behaviors. Scores on the TSCS range from 36 to 180, with higher scores representing greater self-control. TD. This study used Charlton and Fantino’s (2008) adaptation of the computer-delivered quick-adjusting procedure. During the task, participants responded to a series of binary choices of the following form: (a) $X now or (b) $100 in [delay]. The amount presented immediately (X) varied from $0 to $100 according to a predetermined decision tree adapted from Critchfield and Atteberry (2003). The adjusting algorithm increased the value of X following a choice of the larger, delayed outcome (b) and decreased the value of X following a choice of the smaller, immediate outcome (a). The program presented seven [delay] values in Choice b: 1 day, 2 days, 1 week, 1 month, 2 months, 6 months, and 1 year. Delays presented from shortest to longest. Each delay presented until the algorithm provided an estimated value of X that the participant perceived as equal to $100 after the specified delay (the indifference point, VP ). The adjusting algorithm required a maximum of seven choices per delay, for a maximum of 49 choices total on the TD task. The seven indifference points were used to estimate individual discount rates, that is, the k in Equation 1. The higher the k value, the steeper the discounting curve or the greater the loss in value for delayed outcomes. Only hypothetical rewards were used, as an extensive literature suggests no differences in discounting between real and hypothetical rewards in discounting tasks (Johnson & Bickel, 2002; Lagorio & Madden, 2005; Madden, Begotka, Raiff, & Kastern, 2003; Madden et al., 2004). Although the outcomes were hypothetical, participants were instructed to act as if they were real. Procedure. Both tasks were completed in a computer lab accommodating a maximum of five participants simultaneously. Participants completed the TSCS, a brief filler task unrelated to the current study, a demographic survey, and then the temporal discounting task. The order of task completion was the same for all participants.
Results TSCS. The average score for the participants on the TSCS was 120.32 (SD = 18.615). TSCS scores did not differ across gender (t149 = −.90, p = .37).
CHARLTON et al.
588
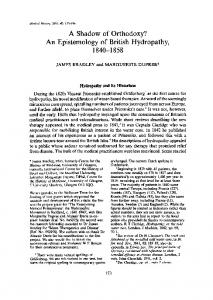
The computer-delivered TSCS showed good internal consistency (Cronbach’s alpha = .88). TD. Using the indifference points from each of the seven delays, discount rates were estimated through (a) nonlinear regression (calculated using GraphPad Prism® software) to estimate the k value in Mazur’s (1987) hyperbolic discounting equation (Equation 1) and (b) AuC, the model-f ree estimate of temporal discounting (Myerson et al., 2001). Note that level of impulse control decreases with k values and increases with AuC scores. The median indifference points at each of the delays were as follows: 1 day = $99 (interquartile range [IQR] = 10); 2 days = $96 (IQR = 10); 1 week = $93 (IQR = 39); 1 month = $80 (IQR = 43); 2 months = $70 (IQR = 53); 6 months = $50 (IQR = 60); and 1 year = $50 (IQR = 60). A nonlinear fit using these median indifference points for each of the seven delays produced an estimated k value of .005 (see curve illustrated in Figure 1) with a variance accounted for (r2 ) of .894. The nonlinear fits were also calculated for each individual participant. The distribution of individual discount scores produced a median discount rate of .006 (IQR = .02, median r2 = .80). The median AuC was .59 (IQR = .48). The distribution of both k values and AuC was nonnormal. A logarithmic transformation of the k values produced a normal distribution, with a mean log(k) of −5.21 (SD = 2.60). The log(k) and AuC values were highly correlated with each other (Spearman’s rank order: r = −.93, p