This article was downloaded by: [Saulius Vaikasas] On: 17 December 2013, At: 00:55 Publisher: Taylor & Francis Informa Ltd Registered in England and Wales Registered Number: 1072954 Registered office: Mortimer House, 37-41 Mortimer Street, London W1T 3JH, UK
Journal of Environmental Engineering and Landscape Management Publication details, including instructions for authors and subscription information: http://www.tandfonline.com/loi/teel20
BIAS ERRORS IN STUDIES ON SEDIMENT – LADEN FLOW IN SHORT EXPERIMENTAL CHANNELS a
b
Alfonsas Rimkus , Saulius Vaikasas & Boris Gjunsburgs
c
a
Water Management Institute of Lithuanian University of Agriculture , LT-58102, Vilainiai, Kedainiai, Lithuania b
Dept of Hydraulics , Vilnius Gediminas Technical University , Saulėtekio al. 11, LT-10223, Vilnius, Lithuania c
Water Engineering and Technology Department , Riga Technical University , Riga, Latvia Published online: 21 Oct 2011.
To cite this article: Alfonsas Rimkus , Saulius Vaikasas & Boris Gjunsburgs (2011) BIAS ERRORS IN STUDIES ON SEDIMENT – LADEN FLOW IN SHORT EXPERIMENTAL CHANNELS, Journal of Environmental Engineering and Landscape Management, 19:3, 198-207, DOI: 10.3846/16486897.2011.613981 To link to this article: http://dx.doi.org/10.3846/16486897.2011.613981
PLEASE SCROLL DOWN FOR ARTICLE Taylor & Francis makes every effort to ensure the accuracy of all the information (the “Content”) contained in the publications on our platform. However, Taylor & Francis, our agents, and our licensors make no representations or warranties whatsoever as to the accuracy, completeness, or suitability for any purpose of the Content. Any opinions and views expressed in this publication are the opinions and views of the authors, and are not the views of or endorsed by Taylor & Francis. The accuracy of the Content should not be relied upon and should be independently verified with primary sources of information. Taylor and Francis shall not be liable for any losses, actions, claims, proceedings, demands, costs, expenses, damages, and other liabilities whatsoever or howsoever caused arising directly or indirectly in connection with, in relation to or arising out of the use of the Content. This article may be used for research, teaching, and private study purposes. Any substantial or systematic reproduction, redistribution, reselling, loan, sub-licensing, systematic supply, or distribution in any form to anyone is expressly forbidden. Terms & Conditions of access and use can be found at http:// www.tandfonline.com/page/terms-and-conditions
JOURNAL OF ENVIRONMENTAL ENGINEERING AND LANDSCAPE MANAGEMENT
ISSN 1648–6897 print/ISSN 1822-4199 online 2011 Volume 19(3): 198–207
doi:10.3846/16486897.2011.613981
BIAS ERRORS IN STUDIES ON SEDIMENT – LADEN FLOW IN SHORT EXPERIMENTAL CHANNELS
Downloaded by [Saulius Vaikasas] at 00:55 17 December 2013
Alfonsas Rimkus1, Saulius Vaikasas2, Boris Gjunsburgs3
Water Management Institute of Lithuanian University of Agriculture, LT-58102 Vilainiai, Kedainiai, Lithuania 2 Dept of Hydraulics, Vilnius Gediminas Technical University, Saulėtekio al. 11, LT-10223 Vilnius, Lithuania 3 Water Engineering and Technology Department, Riga Technical University, Riga, Latvia E-mails:
[email protected] (corresponding author);
[email protected];
[email protected] Submitted 22 Mar. 2010; accepted 11 Jul. 2010 1
Abstract. For the further development of suspension flow theory extensive researches are performed in many hydraulic laboratories, as the up-to-date theory is not able to solve many practical problems yet. However, the recent methods of laboratory investigations and experimental equipment are not quite complete for successful scientific development yet. Analysis of published data of sediment-laden flow investigations revealed, that in many cases the experimental channel length was not sufficient for stabilization of sediment distribution along the water depth of flow, giving rise to bias errors. Unusual and unexplained deviations of experimental dependences from their normal character were detected in experimental dependences of sediment concentration, flow velocities and their fluctuations. These deviations were not similar to accidental measurement failures, as they were regular and the experimental points did not significantly disperse. It seemed as if they arose under the influence of certain unknown factors, which could reduce the quality, and reliability of experimental data and further conclusions. Therefore, it was necessary to establish the reasons for their occurrence. In the paper, these reasons and ways of eliminating these errors are considered. Keywords: suspended sediments, hydraulic investigations, bias errors.
1. Introduction
River flow and transport of sediments is a complex process and is closely connected with surrounding environment (Ždankus et al. 2008). Despite of extensive research efforts in the past decades, the up-to-date theory of suspension flows is not able to solve many problems as sediment motion, water pollution control, river restoration (Rimkus, Vaikasas 2000; Vaikasas 2003). Therefore, the experimental investigations on its further development are still being performed in many hydraulic laboratory flumes (Gjunsburgs et al. 2008). However, the laboratory investigation methods and experimental equipment are also not complete enough and in many cases can cause bias errors in received results of investigations; it sometimes leads to imprecise practical recommendations and even incorrect conclusions. This was noticed in results of recent laboratory investigations. Analyzing the data found in published articles, unusual unexplained deviations in experimental dependences of flow velocities, sediment concentrations and their fluctuations were observed. The deviations of these dependences from their main character were evident, regular and much larger than could be explained by possible measurement failures. They appeared to be caused by certain non-detected factors. Through the analysis of these data, it became clear that these unusual deviations were the 198
result of insufficient stabilization of distribution in whole flow of sediments presented in the beginning of the channel. The stabilization process was not completed until the section of measurements. It continues further after stabilization of water flow. Thus, the investigation results become imprecise and bias errors occur. In some cases they were quite large. Bias errors caused by various imperfections of investigations have already been considered in an article by M. Muste (2002) where certain means to avoid them were proposed. These means included: rational design and monitoring of the experiments, usage of accurate instrumentation, application of recent methods for the analysis of experimental data, performing of investigations in wide enough experimental channels. The means would help avoiding the bias errors and improving investigations, which would in turn, ensure a more successful scientific progress. Further analysis of possible bias errors was performed on the information found in the articles by M. Cellino and W. H. Graf (1997, 1999, 2000), W. H. Graf and M. Cellino (1999, 2002) and B. S. Mazumder et al. (2005). The papers contain detailed and comprehensive laboratory investigation data. Many other investigations (for example Kironto, Graf 1994; Coleman 1986; Snishchenko et al. 1988; Song et al. 1994 and many others) were not as detailed; therefore, the probable deviations caused by the insufficient stabi-
Copyright © 2011 Vilnius Gediminas Technical University (VGTU) Press Technika www.informaworld.com/teel
Journal of Environmental Engineering and Landscape Management, 2011, 19(3): 198–207
Downloaded by [Saulius Vaikasas] at 00:55 17 December 2013
lization of sediment distribution could not be detected and studied. M. Cellino and W. H. Graf (1997, 1999, 2000) measured the 2-D velocity field and concentration profiles, including their turbulent fluctuations, in the centreline of a straight, recirculating flume. These measurements provide a complete data set with information on turbulent fluctuations of flow velocities and sediment concentrations. The objective of the mentioned investigations of M. Cellino and W. H. Graf was to improve the estimation of vertical sediment distribution, as this is necessary for the precise calculation of suspended sediment transport and deposition. The measurements of sediment concentration and flow velocities were performed using an acoustic non-intrusive instrument (Shen 1997; Shen, Lemmin 1996). Sediment and flow-mass momentumdiffusion coefficients ε s and ε m and their ratio
β = ε s / ε m as well as distribution of these factors along the depth were determined. The suppression of flow velocity fluctuations by sediments was investigated. The values β = ε s / ε m are employed in the Rouse formula, where the sediment distribution along the depth is calculated as follows: v h− y a , z = s , C = Ca kβu* y h−a z
where Ca – sediment concentration at the distance a from the bottom; h – water depth; C – sediment concentration at the distance y from the bottom; z – Rouse number; u* – shear velocity; vs – fall velocity of sediment parti-
cles; k = 0.4 – the Von Karman constant. The coefficient β implies that the velocities and their fluctuations of water flow and the ones of sediment particles are not identical. The authors also estimated values β by applying the Rouse formula directly. The sediment concentration distribution estimated by taking water samples along the water depth was used for these calculations. The values β estimated through these two procedures were somewhat different. Naturally, the reason for this difference might be the complexity of sediment and water flow interaction, which cannot be accurately defined by the assumed concept of β . However, these values differ also due to the aforementioned imperfections of the investigations. In the present paper, the sensitivity of the flow structure on the sediment distribution and transport as well as eliminating possible errors is studied. 2. Flow turbulence structures and stabilization process of sediment disposition in water flow
It is known that the distribution of sediments in the water flow is the result of turbulent mixing created by the vortices and whirlpools. Therefore, for detection of the reasons of aforementioned deviations and possible bias
199
errors, it was necessary to study the process of turbulent vortices development, going along the experimental flumes. The structure of these vortices had already been investigated over many years (Vanoni, Nomicos 1959; Klaven 1966; Grishanin 1969; Cuthbertson, Ervin 1999; Nezu, Azuma 2004). Revealed by experiments of V. A. A. Vanoni and G. N. Nomicos (1959), distribution of turbulent vortices in experimental channels is presented in Fig. 1. There are two different main types of such vortices: (1) bottom vortices formed due to high local velocity gradients existing near the bottom, and (2) large whirlpools developed by the velocity gradients along the whole depth of flow. (Further, it will be named so these main types of vortices – bottom vortices and large whirlpools.) The height of large whirlpools reaches the whole flow depth (Fig. 1).
Fig. 1. Distribution of turbulent vortices according to V. A. A. Vanoni (1959)
Bottom vortices originate often as a result of flow separation from the bottom unevenness; therefore, they are displaced along the flow somewhat accidentally. Their existence is not long, only a few of them grow to 0.3 of water depth (Cuthbertson, Ervin 1999). The already generated large whirlpools are maintained further by the velocity gradients formed along a whole depth of flow. Consequently, they are stable. The distance between them is about 6 water depths. Our field investigations in straight interval of the river Nevėžis in Lithuania have found these regular large whirlpools too (Rimkus, Vaikasas 2000). The bottom vortices raise the sinking sediments, and then large whirlpools lift the water volume containing the already dying bottom vortices and the raised sediments higher into the outer flow zone. The smaller scale eddies generated between the bottom vortices also change the turbulent mixing; however, they are less important in the formation of sediment distribution. Large whirlpools are particularly effective in the mixing process, as they help the mixing of the whole flow volume, and lift the sediments to the water’s surface. Particle Image Velocimetry (PIV) photography of turbulent flow obtained by experiments of A. B. Klaven (1966) is presented in the Fig. 2. Development of the large whirlpools can be observed there. Two large whirlpools and several bottom vortices are visible in this photo. The height of the first whirlpool is equal to about 0.7 of the water depth height. The second one has more growth as these whirlpools flowing along the flow are developing. Therefore, the second whirlpool has more included bottom vortices. Vanoni’s velocity measurements were performed using 2-D methods. Measurements with 3-D means showed the existence of transversal components of velocity fluctuations also (Breuer, Haenel 1989; Robinson
200
A. Rimkus et al. Bias errors in studies on sediment – laden flow in short experimental channels
Downloaded by [Saulius Vaikasas] at 00:55 17 December 2013
Fig. 2. Vector field of flow velocities according to the investigations of A. B. Klaven (1966)
1991; Adrian et al. 2000; Stoesser et al. 2003; Nezu, Nakahawa 1993, Widera et al. 2009 and others). These fluctuations were formed because the axis intervals of bottom vortices are not long, and their ends are bent to the bottom, so the bottom vortices gain “turning legs” in which the transversal velocity components are formed. During the further development of bottom vortices these legs are usually laid to the bottom by intensively growing flow velocities. Consequently, these vortices became hairpin-like. The laid legs become quite long and make the intervals of longitudinal vortices (Adrian et al. 2000; Albayrak, Lemmin 2007, 2008; Rodriguez, Garcia 2008), which also help to raise the sinking sediments. This complex formation of vortices investigated by R. J. Adrian et al. (2000) and co-workers is illustrated in Fig. 3.
Fig. 3. The detected by Adrian hairpin-like formations
As one can see, the distribution of studied turbulent vortices even in the flow of experimental channels is quite complex. In turbulent flow investigation works development of bottom vortices and flow turbulence is related commonly to so-called bursting events and to ejection-like and sweep-like turbulence structures (Kaftori et al. 1995; Cellino, Lemmin 1999; Robinson 1991; Albayrak, Lemin 2008; Widera et al. 2009). However, for a detailed study of sediment motion the entire really existing system of whole turbulent vortices (Fig. 1) can be required. Such study of both types of turbulent vortices and their development was necessary for estimation of reasons of aforementioned deviations of experimental date.
In the initial part of the experimental channel, where the formation of the water and sediment flow begins, the turbulence vortices and whirlpools are not yet developed. Therefore, in recirculating channels, the incoming sandy sediments sink to the bottom, where the bottom vortices begin to develop. Consequently, the concentrated flow of sediments is formed there. These sediments are dispersed in this initial interval only throughout the height of the growing bottom vortices. In the non-recirculating experimental channels, conditions for sediment sinking are similar. After decrease of flow velocity in the inner zone, the creation of velocity gradients in the whole flow develops large whirlpools. First of all, whirlpools lift the bottom vortices containing high sediment concentration on its top. The clear water volume, which was there before, is brought down to the inner zone and decreases the sediment concentration there. Each new further developing whirlpool takes the high concentration volume – the sediment cloud (i.e. the volume with this higher sediment concentration). They are usually quite long. These clouds must be dispersed further by bottom vortices and secondary eddies along the whole perimeter of the whirlpool. However, this process is rather slow, as the peripheral velocity of the large whirlpool turning is comparatively low. The turning velocity of developed large whirlpools reaches only about 10% of the average flow velocity (Grishanin 1969; Cellino, Graf 1999, 2000). In a yet developing whirlpool, the peripheral velocity is lower still. Therefore, the formed sediment clouds cannot be completely dispersed until they reach the test section, when the length of usual laboratory channels is no more than 15–20 m. In such conditions, the large whirlpools can fully rotate not more than 2–3 times. A measurement section located at 160 R (R-hydraulic radius) from the flume entrance is sufficient for clear water (Bravo, Meinecke 1997). After stabilization of the flow turbulence characteristics, the stabilization of sediment distribution continues. For the stabilization of sediment distribution, longer experimental channels would be necessary (Rimkus, Vaikasas 2001, 2005). This is the reason for the non-completed stabilization of sediment distribution. For the suspension flow with formed sediment clouds, this process is more complex and has not yet been investigated properly. In many turbulent flow investigations, the interval of flow length presented in the PIV photos was not long enough to include the large whirlpools (for example Cuthbertson, Ervin 1999; Adrian et al. 2000). In such
Downloaded by [Saulius Vaikasas] at 00:55 17 December 2013
Journal of Environmental Engineering and Landscape Management, 2011, 19(3): 198–207
cases, such whirlpools were not noticed and could not be investigated. Consequently, it decreased the necessary attention to the importance of their influence to the sediment disposition and to the necessity of their investigation. The large whirlpools revealed itself in these investigations by lifting of bottom vortices from the inner to the outer zone of the flow. The location of a formed sediment cloud in the large whirlpool is changing when the whirlpool is moving forwards. The whirlpools of this type in laboratory channels are regular. They are formed under the same conditions; thus, each whirlpool flows through the test section with the similar disposition of a sediment cloud. The cloud can occur either on the top or at the bottom, or in any other place within the whirlpool perimeter, although its position changes in the following sections. Thus, the measured time-averaged vertical distribution of sediments depends on the disposition of the test section. This distribution is yet changing along the flow. The stabilized distribution of sediments cannot be found and measured in such conditions. Equipment of long enough channels (maybe till 50 or more metres) is difficult; so ways to accelerate the stabilization of sediment distribution in channels are necessary. The factors that caused the aforementioned deviations were not obvious and could not be easily estimated. It was the simplest to understand them as unexplained measurement failures. Further, several examples that illustrate the impact of sediment clouds are now discussed. 3. Examples of sediment clouds impact Example 1
A typical example of the effect of sediment clouds was found in the article “Sediment-Laden Flow in Open Channels under Non-Capacity and Capacity Conditions” published by M. Cellino and W. H. Graf (1999), where the existence of sediment clouds was visible from the change of measured graphs of the vertical sediment distribution (Fig. 4). The sediment concentrations along the depth are obtained by taking water samples from the channel flow. The investigations were performed with different sediment mean concentrations. During the runs 1–6 of these, concentrations were 0.23, 0.43, 0.99, 1.11, 1.6 and 2.48 g/l. The water discharge was regulated so
Fig. 4. Vertical sediment distribution according to Cellino (1999) investigations measured by taking water samples during runs 1–5 and also in saturated flow. h – water depth, y – distance from the bottom, Ca – sediment concentration at the depth y = 0.05 h
201
that the water depth along the channel would be equal to 12 cm. Channel slope was constant and equal to 0.150%. Exchange of sediment concentration and sediment discharge was formed by injection of certain amount of sediments ( ≈ 10 kg) in the recirculating water flow at the beginning of each next run. The increase of sediment concentration during the experimental runs caused the increasing attenuation of bottom vortices; subsequently, they transported less energy in the inner zone, reducing the velocities there, so the measured flow velocity profiles were found to be exchanged. This, in turn, caused the increase in velocity gradients in the whole flow, which made the large whirlpools rotate faster. Therefore, the position of the sediment cloud in the measurement section was also changing. During Run 2, according to the measurements, the time average sediment concentration near the bottom of the test section (y/h = 0.2) was about 3 times higher than that in the middle of the flow (y/h = 0.5). It shows that the sediment cloud was near the bottom of the test section. During Run 5 the cloud was placed in an outer zone of the flow; thus, the sediment concentrations at heights y/h = 0.2 and 0.5 became almost equal. During the runs 3 and 4 the sediment cloud and the sediment concentration profiles attained an intermediate position. The sediment concentrations in Fig. 4 are shown as ratios C/Ca, so the concentrations in the cases of runs with lower concentrations (Run 1) seem much greater. For the analysis, the vertical distribution of concentrations was studied. The exchange of sediment cloud disposition from run to run distorted the sediment concentration in the main flow. Therefore, its measured amount was growing disproportionally to the increase of injected in water flow circulating sediment amount. The largest increase from 0.43 to 0.99 g/l was received during the Run 3, when the sediment cloud was raised from the bottom (Run 2) into the outer zone of flow. The change of sediment cloud disposition made to change the character of turbulence intensity profiles. These profiles were taken from the cited paper and are shown in Fig. 5, where the time-averaged turbulence intensity is expressed as
v′2 / u∗ ( v ′ – vertical component of fluctuating velocity; u* – bed-shear velocity). A particularly significant change in the disposition of vertical fluctuation profiles obtained during Runs 1–2 and 3–5 seems to be unusual as well (Figs 5a and 5b). During Run 3, the turbulence was suppressed much stronger than during Run 2. The experimental points of profiles are not dispersed significantly; therefore, the received significant change of position of profiles can be caused only by a really existing factor. That occurred due to the aforementioned change in the position of the sediment cloud shown in Fig. 4. During Run 2, the cloud was placed near the bottom; therefore the turbulence was suppressed here. On the backside of the large whirlpool, where the flow is increasing, the sediment cloud was yet not lifted, so here the flow volume contained the normal
202
A. Rimkus et al. Bias errors in studies on sediment – laden flow in short experimental channels
Downloaded by [Saulius Vaikasas] at 00:55 17 December 2013
non-suppressed turbulent vortices. As a consequence of this, the turbulence intensity in the outer zone was higher. During Run 3 the sediment cloud containing the suppressed turbulence vortices became higher, significantly decreasing the time-averaged turbulence intensity (Fig. 5a). During Runs 4 and 5 the turbulence intensity was slowly changing, corresponding to turbulence in the cloud.
It is interesting that during Run 1 with the lowest sediment concentration (Fig. 5a), the turbulence in flow zone y/h > 0.4 is more intensive than during the run with clear water. This is due to the aforementioned increase in the rotation of large whirlpools. They lifted more speedily the water volume with yet un-suppressed turbulence from the zone 0.2 < y/h < 0.4. In the inner zone the turbulence during Run 1 was less intensive than in clear water, as it was suppressed by sediments accumulated near to the bottom. The aforementioned deviations of vertical sediment concentration distribution caused the evident bias errors of β values estimated by applying the Rouse formula. Therefore, these values could not coincide with the ones calculated as ratio of sediment and momentum diffusion coefficients ε s / ε m . Similar distortions and bias errors of measured sediment discharges caused by sediment clouds were received also in many earlier investigations. They were performed with the aim to create the sediment discharge calculation formulas. Therefore, the discharges revealed by various investigators in the channels with different ratios of channel length and water depth are received different to a certain degree (Gilbert 1914; Myer-Peter, Mueller 1948; Guy et al. 1965; Taylor 1971; Stein 1965 and others). Also, there are other factors changing the calculated meanings of sediment discharge employing different formulas such as structure of these formulas, width of a channel and others. Sediment clouds also have their influence. Example 2
Fig. 5. Vertical profiles of turbulence intensity: a – the vertical velocity fluctuations, b – horizontal velocity fluctuations
The relationship between the results given in Figs 4 and 5 shows that the observed deviations are due to really existing phenomena but not the result of measurement failures. As we can see, this peculiarity of turbulence intensity profiles is caused by changes in the position of the sediment cloud (Fig. 4). The peculiarities of vertical flow fluctuations were analyzed higher, because their deviations were more distinct as of longitudinal ones (Fig. 5b), which were similar but smaller in their size. That is because the longitudinal fluctuations mainly are created by large whirlpools, which cannot be suppressed by sediments or their clouds. They even increase with the increase of sediment concentration, due the exchange of velocity gradients. Their longitudinal fluctuations are 3–4 times larger and their frequency is only 0.9 1/s (Cellino, Graf 1999). The distance between the whirlpools with such frequency is about 6 water depths, i.e., it is similar as in experiments of V. A. A. Vanoni and G. N. Nomicos (1959) (second type of turbulent vortices). Sediment clouds can suppress the horizontal fluctuations made by bottom vortices, and some deviations of their summary amount occur.
Distortions made by sediment clouds were noticed also in the publicized paper “Experiments on Suspension Flow with Bed Forms” by M. Cellino and W. H. Graf (2000). Some results from the runs named BF_SO15 and BF_SO2 were unusual too. These runs were carried out when the channel slope was 0.15 and 0.20%, respectively. The suspended sediment concentration was measured by taking water samples in the flow at the points above the height of 0.05 h from the bottom (h = 12 cm – water depth). The sediments moving below 0.05 h height were assumed to be bed load. It would be natural to expect the increase in transportable suspended sediment concentration when the channel slope and flow velocities are increased. However, the measured average concentration of saturated flow was 3.01 g/l in run BF_ SO15 and only 1.94 g/l in the other one. The sediment concentration profiles obtained during those runs are given in Fig. 6. Lower concentrations were found here also during the run BF_SO2, though higher concentrations were expected. As can be seen, the evaluated sediment concentration profiles are regular, and the experimental points in diagrams not noticeably scattered; thus, the differences in their sediment concentration values were genuine and too large to be the result of accidental measurement failures.
Journal of Environmental Engineering and Landscape Management, 2011, 19(3): 198–207
Downloaded by [Saulius Vaikasas] at 00:55 17 December 2013
Fig. 6. Vertical sediment distribution measured during the runs: 1 – BF-SO215 and 2 – BF-SO2
The reason for such results was again due to the differing position of the sediment clouds. In run BF_SO2, the cloud was at the bottom between two elements of bed forms and was therefore carried through the measurement section as bed load. This meant that the sediment concentration measured at higher levels became less. During the run BF_SO215 the cloud was transported at the heights up to 0.4 of water depth, where the concentration became even greater than the average. If the measurements had been taken in the other cross-section with a different placing of the sediment cloud, different sediment distribution would be obtained. The measured sediment concentrations, and the transported sediment discharge in the run BF_SO215 was 1.55 times greater than in the other one, when it would be some less. It means that the bias errors caused by in dispersed sediment clouds can be quite large. Therefore, the distortions of the results of afore mentioned investigations performed for creation of sediment discharge calculation formulas were quite obvious. Example 3
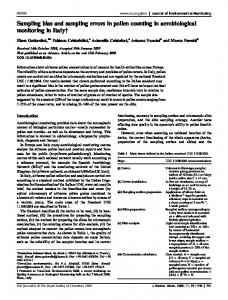
The change in data due to the motion of sediment clouds was also noticed in the article by W. H. Graf and M. Cellino “Suspension flows in open channels; experimental study” (2002). The paper presented a study on the turbulence in a saturated flow when the slope of the channel and sediment concentration was increasing. The results of these measurements are given in Fig. 7. The sediment concentrations were also estimated in this case by taking water samples from the channel flow. As one can see, the evaluated dependences seem to be also incorrect. The deviations were especially large in the case with sediment particles D50 = 0.23 mm. The main increase in concentrations of measured suspended sediments with increasing channel slope was interrupted during the runs where the channel slopes were 0.175 and 0.2%. The sediment concentration during the run with slope 0.2% was about 25% lower than during the run with the slope 0.15%, when of course it would be higher. Such deviations are clearly too large to occur as a result of measurement failures. During the experiments, the ratio of large whirlpool peripheral velocity and the mean flow velocity were also changing due to the increased channel slope and sediment
203
Fig. 7. Distorted by sediment clouds dependence of measured transportable suspended sediment concentration C on the channel slope (Graf and Cellino). Diameter of sand particles: 1 – D50 = 0.135 mm, 2 – D50 = 0.23 mm
concentrations. Therefore, the disposition of a sediment cloud in the test section was changing around the whirlpool from run to run. It happened so that during the first two runs the cloud was in the upper part of the whirlpool in the test section. During the runs were the channel slopes were 0.175 and 0.2% it occurred near to the bottom, and then a certain portion of the sediments was carried as bottom load and, thus, was not measured. Subsequently, during the runs where the slopes were 0.225 and 0.25%, the cloud was once more in the upper part of the whirlpool. Then, the measured suspended sediment concentration increased again. It became larger than it could be in stabilized flow. This demonstrates that such change of sediment concentrations occurred because of consecutive change of sediment cloud position. The received bias errors were quite significant in this investigation as well. The deviations reached till 30%. The investigations with finer sediments (D50 = 0.135 mm) were performed in wider diapason of channel slope change. Therefore, the two analogical decreases of measured sediment concentration occurred: when the slopes were 1.25 and 2.25%. They were less obvious than the ones received with the coarser sand (D50 = 0.23 mm), as the sediment cloud was formed of finer sand particles with less settling velocity; therefore, the cloud at the bottom was wider. Consequently, the smaller part of the cloud occurred in the unmeasured bottom layer. The second decrease of measured sediment concentration (with the slope 2.25%) was less deep, as it occurred during the next rotation of a large whirlpool. The authors of the cited articles have mentioned the possibility that readings by acoustic measurement devices can be distorted by ultrasonic echoes reflected from the flow bottom, when the measurements are performed at a depth of less than 0.2 h However, even if such distortions were possible, this would not affect the diagrams in Figs 4, 6 and 7, as the concentration values were obtained by taking water samples and not by means of an acoustic device. The diagrams in Fig. 5 were mostly derived from the measurements with acoustic devices at a depth of more than 0.2 h, where these distortions are absent.
204
A. Rimkus et al. Bias errors in studies on sediment – laden flow in short experimental channels
Downloaded by [Saulius Vaikasas] at 00:55 17 December 2013
Example 4
The negative influence of sediment clouds was also revealed in the data of experiments described in the article “Influence of bed roughness on sediment suspension: experimental and theoretical studies” by B. S. Mazumder et al. (2005). They investigated the distribution of concentration of sediment fractions with different particle size. Their investigations were performed in a recirculating channel. A layer of sand with known sediment distribution was laid on the bottom of a channel. The amount of fractions composing the suspended sediments was the same for all experiments. The amounts of coarser fractions were changed so that the different bottom roughness would be received from the unwashed grains during the performed series of experiments. After stabilization of the water and sediment flow, water samples were taken from the heights 5, 10 and 20 cm above the bottom, and their grain-size distribution was estimated. Water depth was h = 35 cm. A series of experiments were performed with the average flow velocities 68, 101 and 116 cm/s. The estimated grain size distribution of suspended sediments at the height 20 cm, when the flow velocity was 116 cm/s, for 5 variants of increasing bottom roughness is shown in Fig. 8. The authors of the investigation found that the suspended sediment concentration of fraction with D = 0.09 mm was less than the one of the neighbouring fractions. Thus, the dependences of sediment distribution became quasi bimodal. The section where sediment concentration measurement was at the distance L = 7.5 m, so the ratio L/h = 7.5/0.35 = 21 was low. Under these conditions, the flow and sediment distribution were not stabilized and the sediment clouds were lifted and not dispersed. By their influence the mentioned irregularity can be explained. In the initial part of the channel during these experiments, a high concentration sediment layer at the bottom was formed also, as the large whirlpools had not yet developed there. Therefore, the growing large whirlpools lifted the high concentration sediments and formed sediment clouds.
Sediment clouds of different fractions were formed and displaced around the whirlpool in different strips according to their particle size and ability of the whirlpool to lift them. The most concentrated interval of the sediment cloud of fraction with D = 0.09 mm passed the measurement section near the bottom, at a height below 5 cm; therefore, decreasing the sediment concentration measured higher in the outer zone of the whirlpool. The sediment clouds of other fractions passed through the measurement section at higher levels, so the decrease in sediment concentration was either less or not observed or the concentrations were even increased, when the sediment cloud was lifted higher. Such was a sediment concentration peak of fraction with D = 0.123 mm. This cloud was moving behind the one of finer fraction with D = 0.09 mm. If the concentration measurements would be taken in another section, the sediment cloud of other fraction could occur at the bottom, then the minimum concentration would be received for this fraction. Bimodal form of diagrams obtained at the height of 20 cm was more distinct than at the other heights, as the entire sediment cloud in measurement section was below this height. Only the coarsest bottom sediment distribution was clearly bimodal at all heights, as the whole length of the cloud occurred at the bottom during this experiment. During the experiment with low average flow velocity, the measured distribution of sediment fractions was without these irregularities, as the large whirlpools were weak in this case and could not lift too coarse sediments high enough to spin them and their clouds around the whirlpool. The vertical distribution of investigated sediment fractions was assessed by authors, also modelling it mathematically. The necessary sediment concentration at the reference level was calculated with the value of β (see Eq. 1) adjusted for the best fit of desired concentration profiles with the observed data, which were distorted by sediment clouds. Consequently, the results of mathematical modelling were received similar to the experimental ones, i.e. bimodal as well. As one can see, the detected bimodality is not true. It is only a result of non-completed stabilization of sediment distribution in the whole flow. Of course, such bimodality could not exist in the fully stabilized sedimentladen flow. The authors of the article mentioned that the bimodal sediment fraction distribution was observed also during the analogical investigations of other authors (Sengupta et al. 1999). Sediment clouds were formed during these analogical investigations and distorted the measurement results as well. 4. Ways to avoid the formation of sediment clouds
Fig. 8. Grain size distribution of suspended sediments estimated for the water example taken at the height 20 cm from the bottom for 5 variants of bottom roughness
As one can see, all of the observed abnormal peculiarities and deviations of dependences received by several thoroughly performed experimental investigation works and experiments were explained namely by the influence of consecutive changes in the position of yet undispersed
Downloaded by [Saulius Vaikasas] at 00:55 17 December 2013
Journal of Environmental Engineering and Landscape Management, 2011, 19(3): 198–207
sediment clouds. This confirms their existence in many performed investigations of sediment-laden flow and the consequent need to avoid this phenomenon, as it leads to sometimes quite large bias errors and even incorrect conclusions. Investigation of sediment-laden flow continues to be necessary. To avoid the influence of undispersed sediment clouds, certain special means accelerating the water and sediment flow stabilization must be applied. It is necessary to speed up the development of bottom vortices and large whirlpools. It may be the grids with the thickness changing across the height, artificial roughness in some interval of bottom, some slanting plates for creating large whirlpools or other means forming the necessary vertical flow distribution and large whirlpools, which would help to lift the sediments. For non-recirculating channels the speeding up of whirlpool development would be also useful, however, the injection of sediments would be necessary to disperse or in the entry section, or in some interval of the initial part of the channel. If the sediment would be injected concentrated, sediment clouds would be formed in each case. For detection and optimization of these means, special laboratory investigations must be performed in the future. These must be chosen so that the measurement results at the measurement sections would not be changing along the flow near the measurement section. Maybe these means will somewhat depend on the channel properties. If these means would not be applied for certain investigations, then it would be necessary to at least verify the existence and influence of undispersed sediment clouds through sediment concentration measurements in several measurement sections. Different results obtained by measurements in these sections would confirm the presence and influence of sediment clouds. For the detection of these differences, the measurements can be necessary in three sections, as in the case of the symmetrical position of a cloud; the sediment concentrations if measured in only two test sections can be quite similar. The distance between these test sections must be sufficient for change in the position of sediment clouds. For the studied cases it would be about 5–10 water depths in the channel. 5. Conclusions
Analysis of data from recent laboratory investigations showed that the sediments getting in the beginning of channels form the clouds moving further along the perimeter of large whirlpools of turbulence. At the start of experimental channels, the conditions for formation of sediment clouds are very favourable, since neither bottom vortices nor the large whirlpools are not developed there yet. The sand particles that get there sink to the bottom. The bottom vortices, developing there due to high velocity gradients at the bottom, raise the sinking sediments into the layer of the bottom vortices. After developing velocity gradients through the whole water depth, the large whirlpools begin to form. Each initial whirlpool raises the concentrated sediments from the inner zone to
205
the water surface. Thus, the zones with high sediment concentration (sediment clouds) are formed there. The dispersion of these clouds is slow due to the low rotating velocity of the large whirlpools, so stabilization of vertical sediment distribution in channels with a standard length of 15–20 m is not completed, although this length is sufficient for clear water flows. This is a very unfavourable phenomenon for the investigations, as the use of long channels having the length more than 20 meters is complicated. Therefore, to eliminate possible bias errors, certain special means of accelerating the water and sediment flow stabilization must be employed. To elaborate these means, laboratory investigations must be performed for each experimental flume. For detection of sediment clouds the measurement of vertical sediment distribution must be performed at least in two or three test cross-sections. Acknowledgement
The work described in this paper has been partially funded by the Lithuanian Science Support Fund. References Adrian, R. J.; Meinhart, C. D.; Tomkins, C. D. 2000. Vortex organization in the outer region of the turbulent boundary layer, Journal of Fluid Mechanics 422: 1–54. doi:10.1017/S0022112000001580 Albayrak, I.; Lemmin, U. 2007a. Dynamics of secondary currents and surface boils in turbulent open-channel flow revealed by surface Partice Image Velocity measurements, in IAHR 32nd Congress, Venice, Italy. Albayrak, I.; Lemmin, U. 2007b. The effect of water depth on the dynamics of secondary currents in turbulent openchannel flowover rough bed, in River Flow 2008, Proceedings of the International Conference on Fluvial Hydraulics, Turkey, September 3–5, 2008, 271–279. Albayrak, I.; Lemmin, U. 2008. A study of open-channel surface Flow dynamics USING large Scale Particle Image Velocimetry (LSPIV), in River Flow 2008, Proceedings of the International Conference on Fluvial Hydraulics, Turkey, September 3–5, 2008, 195–202. Bravo, H. R.; Meinecke, J. W. 1997. Entrance flow and the achievement of uniform fully developed open channel flow, in Proceedings 27th Congress IAHR. Theme A, San Francisco, CA, 726–728. Breuer, M.; Haenel, D. 1989. Solution of the 3-D incompressible Navier – Stoces equations for the simulation of vortex breakdown, in Proc. of 8th GAMM conf. 29: 42–51. Cellino, M.; Graf, W. H. 1997. Measurements of suspension flow in open channels, in Proc., 27th IAHR Congr. 1: 179– 184. Cellino, M.; Graf, W. H. 1999. Sediment-laden flow in openchannels under non-capacity and capacity conditions, American Society of Civil Engineering, Journal of Hydraulic Engineering 125(5): 455–462. doi:10.1061/(ASCE)0733-9429(1999)125:5(455) Cellino, M.; Graf, W. H. 2000. Experiments on suspension flow in open channel with bed forms, Journal of Hydraulic Research 19(3): 211–229.
Downloaded by [Saulius Vaikasas] at 00:55 17 December 2013
206
A. Rimkus et al. Bias errors in studies on sediment – laden flow in short experimental channels
Cellino, M.; Lemmin, U. 1999. Coherent flow structure analysis in suspension flow, in Proceedings of XXII IAHR Conference Graz, Austria. Coleman, N. L. 1986. Effects of suspended sediment on the open-channel velocity distribution, Water Recourses Research 22(10): 1377–1384. doi:10.1029/WR022i010p01377 Cuthbertson, A. J. S.; Ervin, D. A. 1999. The interaction between turbulent vortices and fine sediment particles – a possible reason for enhanced settling characteristics?, in Proc., 28th IAHR Congr., Graz, Austria, CD-ROM. Gilbert, G. K. 1914. The Transportation of debris by Running Water: USGS Professional Paper 86. Gjunsburgs, B.; Klive, G.; Neilands, R. 2008. Local scour at straight guide banks in plain rivers, in Proc. of Intern. Conf. on Fluvial Hydraulics, Izmir, Turkey, September 3– 5, 2008, 2: 1577–1585. Graf, W. H.; Cellino, M. 1999. Turbulence suppression in suspension flow, in Proc., 28th IAHR Congr., Graz, Austria, CD-ROM. Graf, W. H.; Cellino, M. 2002. Suspension flows in open channels; experimental study, Journal of Hydraulic Research 40(4): 435–447. doi:10.1080/00221680209499886 Greiman, B. P.; Muste, M.; Holly, J. R. 2000. Two-phase formulation of suspended sediment transport, Journal of Hydraulic Research 37(4): 479–500. doi:10.1080/00221686.1999.9628264 Grishanin, K. V. 1969. Dinamika rechnogo potoka [Динамика речного потока]. Leningrad: Gidrometeorologicheskoe izdatelstvo. 428 p. Guy, H. P.; Simons, D. B.; Richardson, E. V. 1966. Summary of Alluvial Channel Data from Flume Experiment 1956– 1961, in USGS Professional paper 462-I. 96 Kaftori, D.; Hetsroni, G.; Banerjee, S. 1995. Particle behavior in the turbulent boundary layer I. Motion, deposition and entrainment, Phys. Fluids 7(5): 1095–1106. doi:10.1063/1.868551 Kironto, B. A.; Graf, W. H. 1994. Turbulence characteristics in rough uniform open-channel flow, in Proc. Inst. Civ. Engrs. Wat., Marit. and Energy 106: 333–344. Klaven, A. B. 1966. Investigation on the structure of turbulent flow. Trudy Gosudarstvennogo gidrologicheskogo instituta 136: 65–76. Mazumder, B. S.; Ghoshal, K.; Dalal, D. C. 2005. Influence of bed roughness on sediment suspension: experimental and theoretical studies, Journal of Hydraulic Research 43(3): 245–257. doi:10.1080/00221680509500119 Meyer-Peter, E.; Mueller, R. 1948. Formulas for Bed-Load Transport, in Sec. Int. IAHR congress, Stockholm, Sweden. Muste, M. 2002. Sources of bias errors in flume experiments on suspended-sediment transport, Journal of Hydraulic Research 40(6): 695–708. doi:10.1080/00221680209499916 Nezu, I.; Azuma, R. 2004. Turbulence Characteristics and Interaction between Particles and Fluid in Particle-Laden Open Channel Flows, Journal of Hydraulic Engineering 130(10 October 1): 988–1001. Nezu, I.; Nakahawa, H. 1993. Turbulence in open channels, in Balkema, A. A. (Ed.). IAHR Monograph series. Rotterdam, the Netherlands.
Rimkus, A.; Vaikasas, S. 2000. About the investigation of interaction between suspended sediments and turbulent flow, Water Management Engineering. Transactions 9(31): 40– 51. Lithuanian Institute of Water Management. Rimkus, A.; Vaikasas, S. 2001. The length of laboratory channels necessary for the stabilization of suspension flow, Water Management Engineering. Transactions 18(40): 59–64. Lithuanian Institute of Water Management. Rimkus, A.; Vaikasas, S. 2005. Improvement of experimental investigations of sediment-laden flow, Water Management Engineering. Transactions 2(5): 33–42. Lithuanian Institute of Water Management. Robinson, K. 1991. Coherent motions in the turbulent boundary layer, Fluid Mech. 23: 601–639. doi:10.1146/annurev.fl.23.010191.003125 Rodriguez, J. F.; Garcia, M. H. 2008. Laboratory measurements of 3-D flow patterns and turbulence in straight open channel with rough bed, Journal of Hydraulic Research 45(4). Sengupta, S.; Das, S. S.; Maji, A. K. 1999. Sediment transport and sorting process in streams, Proc. Ind. Nat. Sci. Acad. 65A(2): 167–206. Shen, W. 1997. An acoustic instantaneous sediment flux profiler for turbulent flow: Doctoral dissertation No. 1630. Ecole Polytechnique Federale, Lausanne, CH. Shen, W.; Lemmin, U. 1996. Ultrasonic measurements of suspended sediments. A concentration profiling system with attenuation compensation, Meas. Sc. Techn. 7: 1191– 1194. doi:10.1088/0957-0233/7/9/001 Snishchenko, B. F.; Zaicev, N. L.; Meserlans, G. G. 1988. About the influence of suspended sediments on the turbulence characteristics of water flow, Trudy gosudarstvennogo gidrologicheskogo instituta 336: 80–104. Song, T.; Graf, W. H.; Lemmin, U. 1994. Uniform flow in open channels with moveable gravel bed, Journal of Hydraulic Research 32(6): 861–876. doi:10.1080/00221689409498695 Stein, R. A. 1965. Laboratory Studies of total load and apparent bed load, J. Geophys. Res. 70(8): 1831–1842. doi:10.1029/JZ070i008p01831 Stoesser, T.; Froelich, J.; Rodi, W. 2003. Identification of coherent flow structures in open-channel flow over rough bed using large eddy simulation, in Proc. 30th IAHR. Thessaloniki, Greece. Taylor G.I. 1917. Motion of Solide in Fluide when the Flow is not Irrotational, in Proc. Royal Society, London, A93, 99– 113. Vaikasas, S. 2003. Peculiarities of different modeling methods used in investigation flood water flow dynamics in the Nemunas floodplain, Journal of Environmental Engineering and Landscape Management 11(2): 55–64. Vanoni, V. A. A.; Nomicos, G. N. 1959. Resistant properties of sediment-laden streams, J. Hydr. Div. Am. Soc. Civ. Engrs., 85, No. HY5. Widera, P.; Ghorbaniasl, G.; Lacor, Ch. 2009. Study of the sediment transport over flat and wavy bottom using largeeddy simulation, Journal of Turbulence 10(33): 1–20. Ždankus, N.; Vaikasas, S.; Sabas, G. 2008. Impact of a hydropower plants on the downstream reach of a river, Journal of Environmental Engineering and Landscape Management 16(3): 128–134. doi:10.3846/1648-6897.2008.16.128-134
Journal of Environmental Engineering and Landscape Management, 2011, 19(3): 198–207 SISTEMINGOSIOS PAKLAIDOS, TYRINĖJANT NEŠMENIS PLUKDANČIAS TĖKMES PER TRUMPUOSE EKSPERIMENTINIUOSE LATAKUOSE A. Rimkus, S. Vaikasas, B. Gjunsburgs Santrauka
Gausūs eksperimentiniai turbulentinių srautų struktūrų tyrimai atliekami daugelyje hidraulinių laboratorijų. Tiriant skendinčiųjų nešmenų pasiskirstymą tėkmėse siekiama toliau plėtoti teoriją bei ją geriau pritaikyti praktiniams uždaviniams spręsti. Deja, turima eksperimentinė įranga ir tyrimų metodai vis dar nėra pakankamai tobuli, todėl dažnai būdavo gaunamos nemažos sistemingosios paklaidos. Įvairių tyrėjų moksliniuose straipsniuose pateiktų duomenų analizė tai patvirtino. Daugeliu atvejų tyrimams naudojamų eksperimentinių latakų ilgis buvo nepakankamas skendinčiųjų nešmenų pasiskirstymui stabilizuoti. Tai ir buvo tų paklaidų, o kartais ir neteisingų išvadų, priežastis. Analizuojant tyrimų duomenis pastebėta sunkiai paaiškinami nešmenų koncentracijos, tėkmės greičių bei turbulentinių pulsacijų nukrypimai nuo įprastinių. Šie nukrypimai nebuvo matavimų paklaidos ar netikslumai, nes jie reguliariai kartojosi, o eksperimentinių kreivių taškų sklaida buvo maža. Akivaizdu, kad jie atsirado dėl kažkokių dar nenustatytų veiksnių, kurie savaip formavo turbulentinės tėkmės sūkurių struktūrą atliekamų matavimų pjūvyje. Darbo tikslas – nustatyti tos struktūros formavimosi eksperimentiniuose latakuose eigą ir rasti būdų išvengti nešmenų matavimo sistemingųjų paklaidų.
Downloaded by [Saulius Vaikasas] at 00:55 17 December 2013
Reikšminiai žodžiai: nešmenų dinamika, hidrauliniai tyrimai, sistemingosios paklaidos.
CИСTEMHЫE ПОГРЕШНОСТИ B ЭКСПЕРИМЕНТАЛЬНЫX ИCCЛEДOBAHИЯХ B3BECEНЕСУЩИХ ПОТОКOВ В KOPOTKИX ЛАБОРАТОРНЫХ ЛОТКАХ А. Римкус, С. Вайкасас, Б. Гюнсбургс Резюме
Для дальнейшего развития теории взвесенесущего потока многочисленные экспериментальные исследования проводятся во многих гидравлических лабораториях мира, так как современная теория еще не в состоянии решить многие практические задачи. Однако ни современное лабораторное оборудование, ни методы исследования не являются достаточно совершенными. Анализ результатов опубликованных исследований показал, что во многих случаях длина экспериментальных лотков была недостаточной для стабилизации вертикального распределения взвешенных наносов в потоке воды. Это приводило к существенным систематическим ошибкам, а иногда и к неправильным выводам. Наблюдались трудно объяснимые отклонения получаемых экспериментальных зависимостей от их обыкновенного характера. Они не могли быть объяснены погрешностями измерений, так как были регулярны, а экспериментальные точки не были слишком разбросаны. По-видимому, они возникли под влиянием еще не установленных факторов. Было необходимо установить причины этих явлений и пути устранения появляющихся ошибок, что и стало целью работы, излагаемой в настоящей статье. Ключевые слова: взвешенные наносы, гидравлические исследования, систематические погрешности измерения.
Alfonsas RIMKUS. Dr Habil, Water Management Institute in Lithuanian University of Agriculture. Doctor Habil of Science (environmental engineering), 1995. Doctor of Science, 1965 (Lithuanian Institute of Water Management). Employment: Principle researcher. Publications: over 300 research papers. Research interests: fluid mechanics, hydraulics of hydro structures, riverbed processes and their influence to environment.
Saulius VAIKASAS. Dr Habil, Prof., Dept of Hydraulics, Vilnius Gediminas Technical University (VGTU). Doctor Habil of Science (environmental engineering), principle researcher of Lithuanian University of Agriculture, 2007. Doctor of Science, Lithuanian Scientific Institute of Water Management, 1993. Employment: Professor (2007), principle researcher paper. Membership: academician of Lithuanian Academy of Sciences, member of IAHR, IAHS, ISSMGE. Research interests: fluid mechanics, river flows and processes, mechanical hydraulic systems, interaction between hydraulics structures and the environment.
Boris GJUNSBURGS. Dr Sc. Ing., Prof., Head of Dept of Water Engineering and Technology Riga Technical University. Member of the international Association of Hydraulic engineering and research. Employment: Principle researcher. Publications: over 100 research papers. Research interests: climate change impacts and damage risk assessment for engineering structures in flow fluid mechanics, hydraulics of structures, scouring at bridge crossings.
207