Bias Toward Sufficiency and Completeness in Causal Explanations Bob Rehder (
[email protected]) Goran Milovanovic(
[email protected]) Department of Psychology, New York University 6 Washington Place, New York, NY 10003 USA Theories of causal learning in which people induce the strength, or structure, of causal relationships between variables abound (e.g., Cheng, 1997; Griffiths & Tenenbaum, 2004). However, observing correlations in data may do more than just influence one's causal beliefs. Suppose you like your causal explanations to be both sufficient (the alleged cause always produces the outcome) and complete (there are no other causes of the outcome). Suppose you are then told that mental illness is the cause of homelessness. We suggest that your desire for sufficiency and completeness may lead you to alter your estimates of the prevalence of mental illness and homelessness to be more equal. Specifically, if your estimate of the prevalence of mental illness is greater (less) than that for homelessness, sufficiency (completeness) will lead you to decrease (increase) your estimate of mental illness and increase (decrease) your estimate of homelessness. Moreover, if you are then given a second cause of homelessness (e.g., poor education), you will once again have to adjust your estimate of the outcome's frequency to be consistent with this newly acquired knowledge. In this way, data not only affects theory but theory affects (one's beliefs about) data. To test these claims 144 students were taught about four variables in the domain of economics, meteorology, or sociology. For example, the economic variables were interest rates, trade deficits, retirement savings, or job mobility, each which could be "high" or "low." Ss were then taught either 0, 1, 2, or 3 causal relationships between these variables (as in Fig. 1). For example, Ss might be told that "Low interest rates can cause small trade deficits. The low cost of borrowing money leads businesses to invest in the latest manufacturing technologies, and the resulting lowcost products are exported around the world." (Which variables played the role of A, B, and C was balanced over conditions.) All Ss then observed the same sample of 28 economies (or weather systems or societies). In this sample variables A, B, and C were uncorrelated, and each occurred with probability .32 and covaried with E with ∆P = .31 (and causal power = .74). The sample's higher-order statistics were consistent with A, B, and C being noninteracting causes of E and the probability of E was .68. Ss then rated the likelihood of a series of example economies (or weather systems or societies). They then observed the sample a second time and repeated the rating task. To treat these ratings as probability estimates, they were normalized to sum to 1. The probability of the cause and effect variables and the causal power between them were then derived. The causes were B, A and B, and A, B, and C in the 1-, 2-, and 3-cause conditions, respectively. For comparison, A, B, and C were the "causes" in the 0-Cause (Control) condition. The results are presented in Fig. 2.
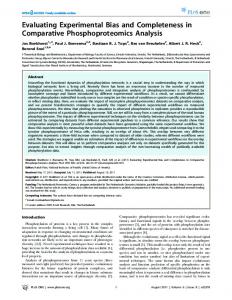
0-Cause
1-Cause
2-Cause
3-Cause
A
A
A
A
B C
E
B C
E
B
E
C
B
E
C
Figure 1 In the 1st rating in 0-Cause condition, the cause variables were considered rare, P(C) < .5, and E was considered common, P(E) > .5, accurately reflecting the statistics of the observed sample. In comparison, in the 1-cause condition Ss equalized the probability of the cause and effect. Apparently, reasoners prefer complete explanations: If P(C) < P(E) then E must have additional causes, but the need for those additional causes can be eliminated by increasing one's estimate of P(C) and decreasing P(E). Relative to the 1cause condition, in the 2- and 3-cause conditions estimates of P(C) are lower and P(E) higher. Apparently, reasoners also prefer sufficient explanations: An outcome must be more prevalent than its multiple causes if each cause is individually sufficient. That is, theory (the causal links) affected (subjects' perception of) data (the base rates of events). As expected, in the 2nd rating (after more data has been seen), the base rates in all conditions more accurately reflect the statistical properties of the observed sample.
Figure 2 As expected, estimates of causal power were higher in the causal conditions than in the 0-cause condition. But those estimates decreased with the number of causes (even though observed causal power was identical in all conditions), reflecting Ss' need to downgrade the causes' sufficiency to be consistent with P(C) and P(E). That is, the base rates of events (data) affects theory (estimates of causal strength). A Bayesian model in which a preference for sufficient and complete causal explanations is formalized in terms of priors on Beta distributions reproduces each of the qualitative effects shown in Fig. 2.
References Cheng, P. (1997). From covariation to causation: A causal power theory. Psychological Review, 104, 367-405. Griffiths, T. L., & Tenenbaum, J. B. (2004). Structure and strength in causal induction. Cognitive Psychology, 51, 334-384.