Big Data Benchmark Compendium Todor Ivanov1 , Tilmann Rabl2 , Meikel Poess3 , Anna Queralt4 , John Poelman5 , Nicolas Poggi4 , and Jeffrey Buell6 1
Goethe University Frankfurt 2 bankmark 3 Oracle Corporation 4 Barcelona Supercomputing Center (BSC) 5 IBM 6 VMware
[email protected],
[email protected],
[email protected],
[email protected],
[email protected],
[email protected],
[email protected]
Abstract. The field of Big Data and related technologies is rapidly evolving. Consequently, many benchmarks are emerging, driven by academia and industry alike. As these benchmarks are emphasizing different aspects of Big Data and, in many cases, covering different technical platforms and uses cases, it is extremely difficult to keep up with the pace of benchmark creation. Also with the combinations of large volumes of data, heterogeneous data formats and the changing processing velocity, it becomes complex to specify an architecture which best suits all application requirements. This makes the investigation and standardization of such systems very difficult. Therefore, the traditional way of specifying a standardized benchmark with pre-defined workloads, which have been in use for years in the transaction and analytical processing systems, is not trivial to employ for Big Data systems. This document provides a summary of existing benchmarks and those that are in development, gives a side-by-side comparison of their characteristics and discusses their pros and cons. The goal is to understand the current state in Big Data benchmarking and guide practitioners in their approaches and use cases.
1
Introduction
Big Data is a new and rapidly evolving discipline in computer science utilizing a diverse spectrum of technical platforms and serving a wide range of applications. This is because, with the combinations of large volumes of data, heterogeneous data formats and the rapidly improving performance of both hardware and Big Data systems, it is hard to generalize architectural aspects that best suit all application requirements, making the investigation and standardization of such systems very difficult. As these systems are evolving, there is an inherent need to evaluate and quantify their performance with the ultimate goal of comparing these systems. Comparisons are desirable in different dimensions, such as software stack, hardware, use case, and tuning parameters. That is, one might want to compare a particular software stack on different hardware systems, a particular hardware
setting on different software stacks, or one software stack on a particular hardware with different tunings. With the rapid increase in Big Data solutions, both academia and industry alike are developing new benchmarks at a rapid pace. Driven by the ”velocity of change” many performance benchmark developers ”cut corners” by customizing their benchmarks too closely to the architectural characteristic of the system they want to benchmark, instead of abstracting its core performance attributes. These benchmarks become ”island solutions” that only fit the systems they targeted in the first place. This approach works well if the goal is to compare the performance of a particular software stack on a particular hardware setting. However, this does not work well to compare the performance of different software stacks on the same hardware platforms or vice versa. Many standard performance organizations, such as TPC, SPEC, and SPC follow similar approaches when developing benchmarks. One of their approaches, which is targeted at increasing the acceptance of benchmarks across many hardware and software vendors, is developing technology agnostic benchmarks for general use cases. The goal is to define a set of functional requirements that can be applied to any system that claims to be able to solve the use case, regardless of hardware, database management software or operating system. It is the responsibility of those measuring the performance of systems using the benchmarks to implement the specification and to submit proof that the implementation meets all benchmark requirements, i.e., that the implementation complies with the specification. The proof is generally captured in a document, e.g., Full Disclosure Report (FDR), whose intent is to enable other parties to reproduce the performance measurement. This approach allows any vendor, using ”proprietary” or ”open” systems, to implement the benchmarks while still guaranteeing end-users that the resulting measurements are comparable. A second approach is to provide executable versions of benchmarks that are targeted on a small number of hardware and software solutions. While these benchmarks can only be used to compare a small number of systems, they are generally easier to develop and deploy. Both approaches can be modeled after actual production applications and environments or be synthetic. The former allows for benchmark analysts to better understand and interpret benchmark results, while the latter is generally better for engineering, e.g., in product development and product improvement. Employing these traditional ways of specifying standardized benchmarks with predefined workloads is not trivial for Big Data systems, because of the combinations of large volumes of data, heterogeneous data formats, and velocity of changes in the processing technology used in Big Data solutions. As a consequence, many companies and research institutions are developing their own ”island solutions” that only fit systems they target. It is a challenge for both industry and academia to keep track of the large number of emerging benchmarks. This document serves as a compendium of Big Data benchmarks that are currently available and that are under development. The contributions of this paper are a detailed summary of these benchmarks as well as a detailed discussion
of the commonalities and differences of them, which can guide academia and industry in choosing the most appropriate benchmark to suit their needs. The paper concludes by proposing a simplified Big Data benchmarks classification, which can be used to come up with a more generalized Big Data benchmark in the future.
2
Existing Big Data Benchmarks
This section presents, in alphabetical order, Big Data benchmarks that are most frequently referenced in current literature. They were developed to stress test and evaluate Big Data systems such as the Hadoop framework and its extensions into the open source ecosystem. 2.1
AMP Lab Big Data Benchmark
AMP Lab Benchmark [2] measures the analytical capabilities of data warehousing solutions. This benchmark currently provides quantitative and qualitative comparisons of five data warehouse systems: RedShift, Hive, Stinger/Tez, Shark, and Impala. Based on Pavlo’s Benchmark [44, 53] and HiBench [28, 32], it consists of four queries involving scans, aggregations, joins, and UDFs. It supports different data sizes and scaling to thousands of nodes. 2.2
BigBench
BigBench [13, 27, 15] is an end-to-end Big Data benchmark that represents a data model simulating the volume, velocity, and variety characteristics of a Big Data system, together with a synthetic data generator for structured, semi-structured, and unstructured data. The structured part of the retail data model is adopted from the TPC-DS benchmark and further extended with semi-structured (registered and guest user clicks) and unstructured data (product reviews). The BigBench raw data volumes can be dynamically changed based on a scale factor. The simulated workload is based on a set of 30 queries covering the different aspects of Big Data analytics proposed by McKinsey [37]. The benchmark consists of four key steps: (i) System setup; (ii) Data generation; (iii) Data load; and (iv) Execute application workload. A reference implementation [15] for the Hadoop ecosystem is available. Currently the TPC committee is working towards standardizing it as a TPC Big Data benchmark [14]. 2.3
BigDataBench
BigDataBench [57] is an open source Big Data benchmark suite [31] consisting of 14 data sets and 33 workloads. Six of the 14 data sets are real-world based, generated using the BDGS [39] data generator. The generated data types include text, graph, and table data, and are fully scalable. According to the literature it is unclear of what the upper bound of the data set sizes are. The remaining eight data
sets are generated from a small seed of real data and are not scalable yet. The 33 workloads are divided into five common application domains: search engine, social networks, electronic commerce, multimedia analytics, and bioinformatics. BigDataBench has many similarities with the DCBench [30], a benchmark suite developed to test data center workloads. This is a rapidly evolving benchmark. Please check the official website for current updates. 2.4
BigFrame
BigFrame [34] is a benchmark generator offering a benchmarking-as-a-service solution for Big Data analytics. While the latest version together with documentation is available on GitHub [16], changes are still being made to the benchmark generator. The benchmark distinguishes between two different analytics workload, 1) offline-analytics and 2) real-time analytics. It consists of structured data (Sales, Item, Customer and Promotion tables) adapted from the TPC-DS benchmark and semi-structured JSON data types containing unstructured text. The current version of the benchmark provides data models for two types of workloads: historical and continuous query. The data in the historical workflow is processed at typical data warehouse rates, e.g., week, whereas the continuous workflow is processed in real-time. It enables real-time decision making based on instant sales and user feedback updates. The development of mixed workloads combining relational, text and graph data is also in progress. 2.5
CloudRank-D
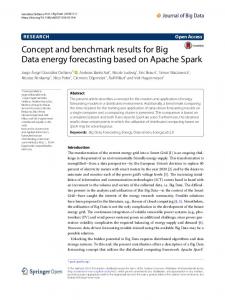
CloudRank-D [36, 29] is a benchmark suite for evaluating the performance of cloud computing systems running Big Data applications. The suite consists of 13 representative data analysis tools, which are designed to address a diverse set of workload data and computation characteristics (i.e., data semantics, data models, and data sizes, the ratio of the size of data input to that of data output). Table 1 depicts the representative applications along with its workload type. The benchmark suite reports two complimentary metrics: data processed per second (DPS) and data processed per Joule (DPJ). DPS is defined as the total amount of data inputs of all jobs divided by the total running time from the submission time of the first job to the end time of the last job. The DPJ is defined as the total amount of data inputs of all jobs divided by the total energy consumed during the duration from the submission time of the first job to the end time of the last job. 2.6
CloudSuite
CloudSuite [25] is a benchmark suite consisting of both emerging scale-out workloads and traditional benchmarks. The goal of the benchmark suite is to analyze and identify key inefficiencies in the processor’s core micro-architecture and memory system organization when running today’s cloud workloads. Table 2 summarizes the workload categories as well as the applications that were actually benchmarked.
Category
No Workload 1 Sort Basic Operations 2 WordCount 3 Grep 4 Naive bayes Classification 5 Support vector machine Clustering 6 K-means Recommendation 7 Item based collaborative filtering Association rule mining 8 Frequent pattern growth Sequence learning 9 Hidden Markov 10 Grep select 11 Ranking select Data warehouse operations 12 User-visits aggregation 13 User-visits ranking join Table 1. Representative applications in CloudRank-D; Adopted from [36]
Category Application Data Serving Cassandra 0.7.3 with YCSB 0.1.3 MapReduce Bayesian classification from Mahout 0.4 lib Media Streaming Darwin Streaming Server 6.0.3 with Faban Driver SAT Solver Klee SAT Solver Web Frontend Olio, Nginx and CloudStone Web Search Nutch 1.2/Lucene 3.0.1 Web Backend MySQL 5.5.9 Traditional Benchmarks PARSEC 2.1, SPEC CINT2006, SPECweb09, TPC-C, TPC-E Table 2. Applications in CloudSuite; Adopted from [25]
2.7
GridMix
GridMix [9] is a benchmark suite for Hadoop clusters, which consists of a mix of synthetic jobs. The benchmark suite emulates different users sharing the same cluster resources and submitting different types and number of jobs. This includes also the emulation of distributed cache loads, compression, decompression, and job configuration in terms of resource usage. In order to run the GridMix benchmark a trace describing the mix of all running MapReduce jobs in the given cluster has to be recorded. 2.8
Hadoop Workload Examples
Since its first version the Hadoop framework has included several ready to use MapReduce sample applications. They are located in the hadoop-examplesversion.jar jar file. These applications are commonly used to both learn and benchmark Hadoop. The most popular ones include: WordCount, Grep, Pi, and Terasort. The Hibench suite, which is briefly described in the next sub-section, also includes these example workloads. Grep Task Grep [6] is a standard MapReduce program that is included in the major Hadoop distributions. The program extracts strings from text input files, matches regular expressions against those strings and counts their number of occurrences. More precisely it consists of two MapReduce jobs running in sequence. The first job counts how many times a matching string occurred, and the second job sorts the matching strings by their frequency and stores the output in a single output file. Pi Pi [4] is a MapReduce program computing the exact binary digits of the mathematical constant Pi. It uses multiple map tasks to do the computation and a single reducer to gather the results of the mappers. Therefore, the application is more CPU bound and produces very little network and storage I/O. 2.9
HiBench
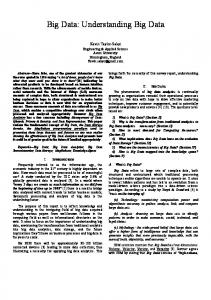
HiBench [28, 32] is a comprehensive benchmark suite for Hadoop consisting of ten workloads including both synthetic micro-benchmarks and real-world applications. HiBench features several ready-to-use benchmarks from 4 categories: micro benchmarks, web search, machine learning, and HDFS benchmarks. Table 3 depicts the category and the exact workload included in HiBench. The HiBench suite evaluates and characterizes the MapReduce framework in terms of speed (job running time) and throughput (the number of tasks completed per minute) and the HDFS in terms of bandwidth, system resource utilization and data access patterns. The following list briefly describes the benchmarks currently implemented. For a complete description please refer to [28, 32].
Category
No Workload 1 Sort 2 WordCount Micro Benchmarks 3 TeraSort 4 EnhancedDFSIO 5 Nutch Indexing Web Search 6 PageRank 7 Bayesian Classification Machine Learning 8 K-means Clustering 9 Hive Join Analytical Query 10 Hive Aggregation Table 3. HiBench Workloads
– Sort, uses the MapReduce framework to sort the input directory into the output directory, being predominately I/O intensive. – WordCount, counts number of word occurrences in a large text files. It is distributed with Hadoop and used in many MapReduce learning books. It is CPU bound. – TeraSort, sorts data generated by the TeraGen program distributed with Hadoop. TeraSort is widely used as reference in research papers as well as in Big Data competitions. TeraSort is I/O and CPU intensive. – EnhancedDFSIO or DFSIOE,is an I/O intensive benchmark that measures throughput in HDFS using MapReduce. It features separate read and write workloads. – Nutch Indexing, tests the search indexing sub-system in Nutch, a popular open source (Apache project) search engine. – PageRank, an implementation of Google’s Web page ranking algorithm. It crawls Wikipedia sample pages. – Bayes, Bayesian Machine Learning classification using the Mahout library. The input of this benchmark is extracted from a subset of the Wikipedia dump. – K-means, Mahout’s implementation of the k-means clustering algorithm for knowledge discovery and data mining. – HiveBench, the OLAP-style Join and Aggregation queries, are adapted from the Pavlo’s Benchmark [44] and have the goal to test the Hive performance. Since version 4.0, HiBench contains 12 Spark workloads implemented in Java, Scala and Python. 2.10
MRBench
MRBench [33] is a benchmark evaluating the processing of business oriented queries and concurrent data modifications on MapReduce systems. It implements the 22 queries of the TPC-H decision support system benchmark directly in map and reduce operations. The MRBench supports three configuration options: database size and number of map and reduce tasks.
2.11
MapReduce Benchmark Suite (MRBS)
MRBS [50, 51, 40] is a comprehensive benchmark suite for evaluating the performance of MapReduce systems. It covers five application domains listed in Table 4. The high-level metrics reported by the benchmark are client request latency, throughput and cost. Additionally, low-level metrics like size of read/written data, throughput of MR jobs, and tasks are also reported. The MRBS implements a service that provides different types of operations, which can be requested by clients. Two execution modes are supported: interactive mode and batch mode. The benchmark run consists of three phases dynamically configurable by the end-user: warm-up phase, run-time phase, and slow-down phase. The user can specify the number of runs and the different aspects of load: dataload and workload. The dataload is characterized by the size and the nature of the data sets used as inputs for a benchmark, and the workload is characterized by the number of concurrent clients and the distribution of the request type. Domain Recommendation Business Intelligence Bioinformatics Text Processing
Application Benchmark based on real movie database TPC-H DNA sequencing Search patterns, word occurrence and sorting on randomly generated text files Data Mining Classifying newsgroup documents into categories, canopy clustering operations Table 4. Representative Applications in MRBS
2.12
Pavlo’s Benchmark (CALDA)
Pavlo’s Benchmark [44, 53, 3] consists of five tasks defined as SQL queries among which is the original MapReduce Grep task, which is a representative of most real user MapReduce programs. The benchmark was developed to specifically compare the capabilities of Hadoop with those of commercial parallel Relational Database Management Systems (RDBMS). Although the reported results do not favor the Hadoop platform, the authors remain optimistic that MapReduce systems will coexist with traditional database systems. Table 5 summarizes all types of tasks in Pavlo’s Benchmark and their complimentary SQL statements. 2.13
PigMix
PigMix/PigMix2 [11] is a set of 17 queries specifically created to test the performance of Pig systems. Specifically, it tests the latency and scalability of Pig systems. The queries, written in Pig Latin [42], test different operations like data loading, different types of joins, group by clauses, sort clauses, as well as aggregation operations. The benchmark includes eight data sets, with varying
Category General task
No Workload/SQL Query 1 SELECT * FROM Data WHERE field LIKE ’%XYZ%’; PageRank/Selection Task 2 SELECT pageURL, pageRank FROM Rankings WHERE pageRank >X; SELECT sourceIP, SUM(adRevenue) Web Log/Aggregation Task 3 FROM UserVisits GROUP BY sourceIP; SELECT SUBSTR(sourceIP,1,7), SUM(adRevenue) FROM UserVisits GROUP BY SUBSTR(sourceIP, 1, 7); Join Task 4 SELECT INTO Temp sourceIP, AVG(pageRank) as avgPageRank, SUM(adRevenue) as totalRevenue FROM Rankings AS R, UserVisits AS UV WHERE R.pageURL = UV.destURL AND UV.visitDate BETWEEN Date(’2000-01-15’) AND Date(’2000-01-22’) GROUP BY UV.sourceIP; SELECT sourceIP, totalRevenue, avgPageRank FROM Temp ORDER BY totalRevenue DESC LIMIT 1; UDF Aggregation Task 5 SELECT INTO Temp F(contents) FROM Documents; SELECT url, SUM(value) FROM Temp GROUP BY url; Table 5. Pavlo’s Benchmark Queries
schema attributes and sizes, generated using the DataGeneratorHadoop [7] tool. PigMix/PigMix2 are not considered true benchmarks as they lack some of the main benchmark elements, such as metrics. 2.14
PRIMEBALL
PRIMEBALL [26] is a novel and unified benchmark specification for comparing the parallel processing frameworks in the context of Big Data applications hosted in the cloud. It is implementation- and technology-agnostic, using a fictional news hub called New Pork Times, based on a popular real-life news site. Included are various use-case scenarios made of both queries and data-intensive batch processing. The raw data set is fetched by a crawler and consists of both structured XML and binary audio and video files, which can be scaled by a pre-defined scale factor (SF) to 1 PB. The benchmark specifies two main metrics: throughput and price performance. The throughput metric reports the total time required to execute a particular scenario. The price performance metric is equal to the throughput divided by the price, where the price is defined by the specific cloud provider and depends on multiple factors. Additionally, the benchmark specifies several relevant properties characterizing cloud platforms, such as 1) scale-up; 2) elastic speedup; 3) horizontal scalability; 4) latency; 5) durability; 6) consistency and version handling; 7) availability; 8) concurrency and other data and information retrieval properties.
2.15
SparkBench
SparkBench [35, 38], developed by IBM, is a comprehensive Spark specific benchmark suite. It comprises of four main workload categories: machine learning, graph processing, streaming, and SQL queries. Currently ten workloads are implemented, listed in Table 6. The purpose of the benchmark suite is to help users evaluate and analyze the tradeoffs between different system designs, guide the optimization of workload configurations and cluster provisioning for Spark deployments. SparkBench reports two metrics: job execution time (seconds) and data process rate (MB/second). The job execution time measures the execution time of each workload, whereas the data process rate is defined as the input data size divided by the job execution time. Application Type Machine Learning
Workload Logistic Regression Support Vector Machine Matrix Factorization Graph Computation PageRank SVD++ TriangleCount SQL Queries Hive RDDRelation Streaming Application Twitter PageView Table 6. SparkBench Workloads
2.16
Statistical Workload Injector for MapReduce (SWIM)
SWIM [21, 20, 60] is a benchmark, which takes a different approach in the testing process. It consists of a framework, which is able to synthesize representative workload from real MapReduce traces taking into account the job submit time, input data size, and shuffle/input and output/shuffle data ratio. The result is a synthetic workload, which has the exact characteristics of the original workload. Similarly, the benchmark generates artificial data. Then the workload executor runs a script which takes the input data and executes the synthetically generated workload (jobs with specified data size, data ratios, and simulating gabs between the job executions). Additionally, the reproduced workload includes a mix of job submission rates and sequences and a mix of common job types. Currently, the benchmark includes multiple real Facebook traces and the goal is to further extend the repository by including new real workload traces. 2.17
TPC-H
TPC-H [54] is the de facto benchmark standard for testing data warehouse capability of a system. Instead of representing the activity of any particular business segment, TPC-H models any industry that manages, sells, or distributes
products worldwide (e.g., car rental, food distribution, parts, suppliers, etc.). The benchmark is technology-agnostic. The purpose of TPC-H is to reduce the diversity of operations found in a typical data warehouse application, while retaining the application’s essential performance characteristics, namely: the level of system utilization and the complexity of operations. The core of the benchmark is comprised of a set of 22 business queries designed to exercise system functionalities in a manner representative of complex decision support applications. These queries have been given a realistic context, portraying the activity of a wholesale supplier to help the audience relate intuitively to the components of the benchmarks. It also contains two refresh functions (RF1, RF2) modeling the loading of new sales information (RF1) and the purging of stale or obsolete sales information (RF2) from the database. The exact definition of the workload can be found in the latest specification [54]. It was adapted very early in the development of Hive [10, 12] and Pig [8], and implementations of the benchmark are available for both. In order to publish a TPC-H compliant performance result the system needs to support full ACID (Atomicity, Consistency, Isolation, and Durability). 2.18
TPC-DS
TPC-DS [55] is a decision support benchmark that models several generally applicable aspects of a decision support system, including queries and data maintenance. It takes the marvels of TPC-H and, now obsolete TPC-R, and fuses them into a modern DSS benchmark. The main focus areas: – – – – – – –
Multiple snowflake schemas with shared dimensions 24 tables with an average of 18 columns 99 distinct SQL 99 queries with random substitutions More representative skewed database content Sub-linear scaling of non-fact tables Ad-hoc, reporting, iterative and extraction queries ETL-like data maintenance
While TPC-DS may be applied to any industry that must transform operational and external data into business intelligence, the workload has been granted a realistic context. It models the decision support tasks of a typical retail product supplier. The goal of selecting a retail business model is to assist the reader in relating intuitively to the components of the benchmark, without tracking that industry segment so tightly as to minimize the relevance of the benchmark. The schema, an aggregate of multiple star schemas, contains essential business information, such as detailed customer, order, and product data for the classic sales channels: store, catalog, and Internet. Wherever possible, real world data are used to populate each table with common data skews, such as seasonal sales and frequent names. In order to realistically scale the benchmark from small to large datasets, fact tables scale linearly while dimensions scale sub linearly. The benchmark abstracts the diversity of operations found in an information analysis application, while retaining essential performance characteristics. As
it is necessary to execute a great number of queries and data transformations to completely manage any business analysis environment, TPC-DS defines 99 distinct SQL-99 (with OLAP amendment) queries and twelve data maintenance operations covering typical DSS like query types such as ad-hoc, reporting, iterative (drill down/up), and extraction queries and periodic refresh of the database. The metric is constructed in a way that favors systems that can overlap query execution with updates (trickle updates). As with TPC-H full ACID characteristics are required. Implementation with more than 50 sample queries is available for Hive [12]. 2.19
TPCx-HS
This section presents the TPCx-HS benchmark, its methodology and some of its major features as described in the current specification (version 1.3.0 from February 19, 2015) [56]. The TPCx-HS was released in July 2014 as the first industry’s standard benchmark for Big Data systems [41]. It stresses both the hardware and software components including the Hadoop run-time stack, Hadoop File System, and MapReduce layers. The benchmark is based on the TeraSort workload [5], which is part of the Apache Hadoop distribution. Similarly, it consists of four modules: HSGen, HSDataCkeck, HSSort, and HSValidate. The HSGen is a program that generates the data for a particular Scale Factor (see Clause 4.1 from the TPCx-HS specification) and is based on the TeraGen, which uses a random data generator. The HSDataCheck is a program that checks the compliance of the dataset and replication. The HSSort is a program, based on TeraSort, which sorts the data into a total order. Finally, HSValidate is a program, based on TeraValidate, that validates the output is sorted. A valid benchmark execution consists of five separate phases which have to be run sequentially to avoid any phase overlapping. Additionally, Table 7 provides the exact description of each of the execution phases. The benchmark is started by the script and consists of two consecutive runs, Run1 and Run2. No activities except file system cleanup are allowed between Run1 and Run2. The completion times of each phase/module (HSGen, HSSort and HSValidate) except HSDataCheck are currently reported. An important requirement of the benchmark is to maintain 3-way data replication throughout the entire experiment. The benchmark reports the total elapsed time (T) in seconds for both runs. This time is used for the calculation of the TPCx-HS performance metric also abbreviated with HSph@SF. The run that takes more time and results in lower TPCx-HS performance metric is defined as the performance run. On the contrary, the run that takes less time and results in TPCx-HS performance metric is defined as the repeatability run. The benchmark reported performance metric is the TPCx-HS performance metric for the performance run. The scale factor defines the size of the dataset, which is generated by HSGen and used for the benchmark experiments. In TPCx-HS, it follows a stepped size model. Table 8 summarizes the supported scale factors, together with the
Phase Description as provided in TPCx-HS specification [56] 1 Generation of input data via HSGen. The data generated must be replicated 3-ways and written on a durable medium. 2 Dataset (See Clause 4) verification via HSDataCheck. The program is to verify the cardinality, size, and replication factor of the generated data. If the HSDataCheck program reports failure then the run is considered invalid. 3 Running the sort using HSSort on the input data. This phase samples the input data and sorts the data. The sorted data must be replicated 3-ways and written on a durable medium. 4 Dataset (See Clause 4) verification via HSDataCheck. The program is to verify the cardinality, size and replication factor of the sorted data. If the HSDataCheck program reports failure then the run is considered invalid. 5 Validating the sorted output data via HSValidate. HSValidate validates the sorted data. If the HSValidate program reports that the HSSort did not generate the correct sort order, then the run is considered invalid. Table 7. TPCx-HS Phases
corresponding data sizes and number of records. The last column indicates the argument with which to start the TPCx-HS-master script. Dataset Size Scale Factor (SF) Number of Records 100 GB N/A 1 Billion 300 GB N/A 3 Billion 1 TB 1 10 Billion 3 TB 3 30 Billion 10 TB 10 100 Billion 30 TB 30 300 Billion 100 TB 100 1000 Billion 300 TB 300 3000 Billion 1 PB 1000 10000 Billion Table 8. TPCx-HS Phases
2.20
Option to Start Run ./TPCx-HS-master.sh -g 1 ./TPCx-HS-master.sh -g 2 ./TPCx-HS-master.sh -g 3 ./TPCx-HS-master.sh -g 4 ./TPCx-HS-master.sh -g 5 ./TPCx-HS-master.sh -g 6 ./TPCx-HS-master.sh -g 7 ./TPCx-HS-master.sh -g 8 ./TPCx-HS-master.sh -g 9
Yahoo! Cloud Serving Benchmark (YCSB)
YCSB [23, 43] is a benchmark designed to compare emerging cloud serving systems like Cassandra, HBase, MongoDB, Riak, and many more, which do not support ACID. The benchmark consists of a workload generator and a generic database interface, which can be easily extended to support other relational or NoSQL databases. YCSB provides a core package of six pre-defined workloads AF, which simulate a cloud OLTP application (read and update operations). The reported metrics are execution time and throughput (operations per second). The benchmark is open source and available on GitHub [59].
3
Discussion
There is a great number of existing benchmarks focused on testing certain features of data intensive systems, but they are all developed with different goals in mind and for different platforms. With the steady growth of Big Data, the need for a specific benchmark testing the Big Data characteristics of current platforms becomes more important. At the same time, the platforms are becoming more complex as the number of requirements they should address also grows. This makes the creation of an objective Big Data benchmark, that covers all relevant characteristics, a complex task. The workload diversity is one such important characteristics in a Big Data benchmark, as outlined in related papers [19, 36, 20, 13, 27, 57, 22, 18]. The benchmark should include a wide range of workloads, based on real world applications, and offer the ability to easily integrate new ones. At the same time these workloads should not be redundant or test similar data and component characteristics [58]. The different workload types should be seen as complementary to each other in a benchmark suite, with the overall goal to test a bigger range of functionalities. Tightly coupled with the workload type is the data generator used to synthesize the test data, based on real data samples, for a specifically set scale factor and size. The generated data varies between structured, semistructured, unstructured, or mixed. Because of this data heterogeneity, there are various different approaches to generate the data discussed in research papers [20, 1, 46, 47, 39]. Similarly, existing benchmarks differ in how they define accurate and representative benchmark metrics, which incorporate all the necessary information to independently compare the systems under test. Motivated by the platform and benchmark complexity, data heterogeneity, size, and scalability, there is an urgent need of new metrics. They can be workload specific like in HiBench [28] or more complex based on multiple workloads in an endto-end benchmark suite [27]. Others, like the SWIM benchmark [21, 20], define job specific metrics like number of jobs for each job type and job submission patterns, which are limited only to MapReduce platforms. On the contrary, more general metrics, independent of workload type, based on processor microarchitecture characteristics are reported. Such examples, presented in [58, 24], are Cycles per Instructions (CPI), first level data cache misses per 1000 instructions (L1 MPKI), and last level cache (LLC) miss ratio. Finally, new types of metrics like data processed per second and data processed per Joule implemented in CloudRank-D [36], improve the measurement of data processing and energy consumption.
4
Benchmarking platforms
Benchmarking platforms are systems and tools that facilitate the different phases of executing and evaluating benchmark results. These include: benchmark planning, server deployment and configuration, execution and queuing, metrics collection, data and results management, data transformation, error detection, and
evaluation of results. The evaluation of results can be either by individual benchmarks or by group of benchmarks. 4.1
ALOJA benchmarking platform
The ALOJA research project [45] is an initiative from the Barcelona Supercomputing Center (BSC) to produce a systematic study of Hadoop configuration and deployment options. The project provides an open source platform for executing Big Data frameworks in an integrated manner facilitating benchmark execution and evaluation of results. ALOJA currently provides tools to deploy, provision, configure, and benchmark Hadoop, as well as providing different evaluations for the analysis of results covering both software and hardware configurations of executions. The project also hosts the largest public Hadoop benchmark repository with over 42,000 executions from HiBench (See Section 2.9). The online repository can be used as a first step to understand and select benchmarks to execute in the selected deployment and reduce benchmarking efforts by sharing results from different systems. The repository and the tools can be found online [17]. 4.2
Liquid Benchmarking platform
Liquid Benchmarking [48, 49, 52] is an online cloud-based platform for democratizing the performance evaluation and benchmarking processes. The goals of the project are to: – Dramatically reduce the time and effort for conducting performance evaluation processes by facilitating the process of sharing the experimental artifacts (software implementations, datasets, computing resources, and benchmarking tasks) and enabling the users to easily create, mashup, and run the experiments with zero installation or configuration efforts. – Support for searching, comparing, analyzing, and visualizing (using different built-in visualization tools) the results of previous experiments. – Enable the users to subscribe for notifications about the results of any new running experiments for the domains/benchmarks of their interest. – Enable social and collaborative features that can turn the performance evaluation and benchmarking process into a living process where different users can run different experiments and share the results of their experiments with other users.
5
Conclusion
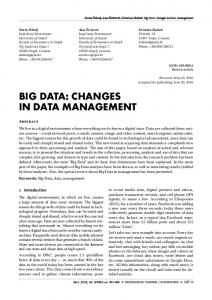
This document presented a review of existing Big Data benchmarks, as well as a discussion about their major characteristics. Table 9 summarizes the Big Data benchmarks described in our survey.
Benchmark
Workloads
AMP Lab Micro Big Data mark Benchmark BigBench
Metrics
Bench- Query time
30 Queries
Query time BBQpH
S Yes
and Yes
SS U Current Implementations No No Hive, Tez, Shark, Impala, Redshift Yes Yes Teradata Aster, Hadoop, Spark Yes Yes Multiple technologies Yes Yes Multiple Yes Yes Hadoop
Available Yes [2]
Yes [15]
BigDataBench Multiple Multiple metrics Yes Yes [31] (See [31]) BigFrame Multiple Execution time Yes Yes [16] CloudRank-D Multiple (See Data processed Yes Yes [29] Table 1) per second and Data processed per Joule CloudSuite Multiple (See No Yes Yes Yes Multiple No Table 2) technologies GridMix Synthetic and Number of com- Yes No No Hadoop Yes [9] Basic Opera- pleted jobs and tions elapsed time Hadoop Work- Micro Bench- No No No Yes Hadoop Yes [6, 4] load Examples marks HiBench Micro Bench- Execution time Yes Yes Yes Hadoop, Yes [32] marks (See and throughput Spark Table 3) MRBench Data ware- Query time Yes No No Hadoop No house operations: TPC-H MRBS Multiple (See Client request la- Yes Yes Yes Hadoop Yes [40] Table 4) tency, throughput and cost Pavlo’s Micro Bench- Query time Yes No No Hive Yes [3] Benchmark mark (See (CALDA) Table 5) PigMix Pig Specific Execution time Yes No No Pig, Hadoop Yes [11] Queries PRIMEBALL Multiple Price performance Yes Yes Yes Hadoop No (See Sub- and other property section 2.14) specific SparkBench Multiple (See Job execution time Yes Yes Yes Spark Yes [38] Table 6) and data process rate SWIM Synthetically Multiple metrics No No No Hadoop Yes [60] User-generated TPC-H Data ware- Query time Yes No No Hive, Pig, Yes [10, 8] house opera- and throughImpala, IBM tions put: QphH@Size, Big SQL $/QphH@Size TPC-DS Data ware- Query time Yes No No Hive, Pig, Yes [12] house opera- and throughImpala, IBM tions put: QphDS@SF, Big SQL $/QphDS@SF TPCx-HS HSGen, HS- Performance, No No Yes Hadoop Yes [56] DataCkeck, price and enHSSort and ergy: HSph@SF, HSValidate $/HSph@SF, Watts/HSph@SF YCSB Cloud OLTP Execution time Yes No No NoSQL Yes [59] and throughput databases Table 9. Big Data Benchmarks - Data Types: Structured(S), Semi-structured(SS), Unstructured(U); Hadoop = MapReduce and HDFS;
5.1
Future work
This benchmark survey is the beginning of a mid-term project to perform an in-depth analysis of Big Data benchmarks. This project not only aims to cover more benchmarks, but also to provide a performance characterization that can be used as a reference for the results one should expect from each benchmark type. There is also the intention to compare different data compression and storage formats i.e., avro, parquet, ORC, as well as testing different implementations of reference benchmarks such as BigBench and TCP-H. Acknowledgment This research has been supported by the Research Group of the Standard Performance Evaluation Corporation (SPEC).
References 1. Alexandrov, A., Br¨ ucke, C., Markl, V.: Issues in big data testing and benchmarking. In: Proceedings of the Sixth International Workshop on Testing Database Systems, DBTest 2013, New York, NY, USA, June 24, 2013. pp. 1:1–1:5 (2013) 2. AMP Lab: AMP Lab Big Data Benchmark (2013), https://amplab.cs.berkeley.edu/benchmark/ 3. Andrew Pavlo: Benchmark (2011), http://database.cs.brown.edu/projects/mapreducevs-dbms/ 4. Apache Hadoop: Package org.apache.hadoop.examples.pi (2015), http://hadoop.apache.org/docs/r0.23.11/api/org/apache/hadoop/examples/pi/ package-summary.html 5. Apache Hadoop: TPC Express Benchmark HS - Standard Specification (2015), http://hadoop.apache.org/docs/current/api/org/apache/ hadoop/examples/terasort/package-summary.html 6. Apache Software Foundation: Grep (2009), http://wiki.apache.org/hadoop/Grep 7. Apache Software Foundation: DataGeneratorHadoop (2010), http://wiki.apache.org/pig/DataGeneratorHadoop 8. Apache Software Foundation: Running TPC-H Benchmark on Pig (2012), https://issues.apache.org/jira/browse/PIG-2397 9. Apache Software Foundation: GridMix (2013), https://hadoop.apache.org/docs/stable1/gridmix.html 10. Apache Software Foundation: Hive performance benchmarks (2013), https://issues.apache.org/jira/browse/HIVE-396 11. Apache Software Foundation: PigMix (2013), https://cwiki.apache.org/confluence/display/PIG/PigMix 12. Apache Software Foundation: TPC-H and TPC-DS for Hive (2015), https://github.com/hortonworks/hive-testbench/tree/hive14 13. Baru, C., Bhandarkar, M., Nambiar, R., Poess, M., Rabl, T.: Setting the Direction for Big Data Benchmark Standards. In: Nambiar, R., Poess, M. (eds.) Selected Topics in Performance Evaluation and Benchmarking, Lecture Notes in Computer Science, vol. 7755, pp. 197–208. Springer Berlin Heidelberg (2013) 14. Baru, C.K., Bhandarkar, M.A., Curino, C., Danisch, M., Frank, M., Gowda, B., Jacobsen, H., Jie, H., Kumar, D., Nambiar, R.O., Poess, M., Raab, F., Rabl, T., Ravi, N., Sachs, K., Sen, S., Yi, L., Youn, C.: Discussion of bigbench: A proposed industry standard performance benchmark for big data. In: Performance Characterization and Benchmarking. Traditional to Big Data - 6th TPC Technology Conference, TPCTC 2014, Hangzhou, China, September 1-5, 2014. Revised Selected Papers. pp. 44–63 (2014)
15. BigBench: BigBench (2015), https://github.com/intel-hadoop/Big-DataBenchmark-for-Big-Bench 16. BigFrame Team: BigFrame (2013), https://github.com/bigframeteam/BigFrame/wiki 17. BSC: Aloja home page: http://aloja.bsc.es/ (2014) 18. Chang, J., Lim, K.T., Byrne, J., Ramirez, L., Ranganathan, P.: Workload diversity and dynamics in big data analytics: Implications to system designers. In: Proceedings of the 2Nd Workshop on Architectures and Systems for Big Data. pp. 21–26. ASBD ’12, ACM, New York, NY, USA (2012) 19. Chen, Y.: We dont know enough to make a big data benchmark suite-an academiaindustry view. Technical Report No. UCB/EECS-2012-71 (2012) 20. Chen, Y., Alspaugh, S., Katz, R.H.: Interactive analytical processing in big data systems: A cross-industry study of mapreduce workloads. PVLDB 5(12), 1802–1813 (2012) 21. Chen, Y., Ganapathi, A., Griffith, R., Katz, R.H.: The case for evaluating mapreduce performance using workload suites. In: MASCOTS 2011, 19th Annual IEEE/ACM International Symposium on Modeling, Analysis and Simulation of Computer and Telecommunication Systems, Singapore, 25-27 July, 2011. pp. 390– 399 (2011) 22. Chen, Y., Raab, F., Katz, R.H.: From TPC-C to big data benchmarks: A functional workload model. In: Specifying Big Data Benchmarks - First Workshop, WBDB 2012, San Jose, CA, USA, May 8-9, 2012, and Second Workshop, WBDB 2012, Pune, India, December 17-18, 2012, Revised Selected Papers. pp. 28–43 (2012) 23. Cooper, B.F., Silberstein, A., Tam, E., Ramakrishnan, R., Sears, R.: Benchmarking cloud serving systems with YCSB. In: Proceedings of the 1st ACM Symposium on Cloud Computing, SoCC 2010, Indianapolis, Indiana, USA, June 10-11, 2010. pp. 143–154 (2010) 24. Dimitrov, M., Kumar, K., Lu, P., Viswanathan, V., Willhalm, T.: Memory system characterization of big data workloads. In: Proceedings of the 2013 IEEE International Conference on Big Data, 6-9 October 2013, Santa Clara, CA, USA. pp. 15–22 (2013) 25. Ferdman, M., Adileh, A., Ko¸cberber, Y.O., Volos, S., Alisafaee, M., Jevdjic, D., Kaynak, C., Popescu, A.D., Ailamaki, A., Falsafi, B.: Clearing the clouds: a study of emerging scale-out workloads on modern hardware. In: Proceedings of the 17th International Conference on Architectural Support for Programming Languages and Operating Systems, ASPLOS 2012, London, UK, March 3-7, 2012. pp. 37–48 (2012) 26. Ferrarons, J., Adhana, M., Colmenares, C., Pietrowska, S., Bentayeb, F., Darmont, J.: PRIMEBALL: A parallel processing framework benchmark for big data applications in the cloud. In: Performance Characterization and Benchmarking 5th TPC Technology Conference, TPCTC 2013, Trento, Italy, August 26, 2013, Revised Selected Papers. pp. 109–124 (2013) 27. Ghazal, A., Rabl, T., Hu, M., Raab, F., Poess, M., Crolotte, A., Jacobsen., H.A.: BigBench: Towards an Industry Standard Benchmark for Big Data Analytics. In: SIGMOD (2013) 28. Huang, S., Huang, J., Dai, J., Xie, T., Huang, B.: The hibench benchmark suite: Characterization of the mapreduce-based data analysis. In: Workshops Proceedings of the 26th International Conference on Data Engineering, ICDE 2010, March 1-6, 2010, Long Beach, California, USA. pp. 41–51 (2010) 29. ICT, Chinese Academy of Sciences: CloudRank-D (2013), http://prof.ict.ac.cn/CloudRank/ 30. ICT, Chinese Academy of Sciences: DCBench (2013), http://prof.ict.ac.cn/DCBench/ 31. ICT, Chinese Academy of Sciences: BigDataBench 3.1 (2015), http://prof.ict.ac.cn/BigDataBench/ 32. Intel: HiBench Suite (2015), https://github.com/intel-hadoop/HiBench
33. Kim, K., Jeon, K., Han, H., Kim, S.G., Jung, H., Yeom, H.Y.: Mrbench: A benchmark for mapreduce framework. In: 14th International Conference on Parallel and Distributed Systems, ICPADS 2008, Melbourne, Victoria, Australia, December 810, 2008. pp. 11–18 (2008) 34. Kunjir, M., Kalmegh, P., Babu, S.: Thoth: Towards managing a multi-system cluster. PVLDB 7(13), 1689–1692 (2014) 35. Li, M., Tan, J., Wang, Y., Zhang, L., Salapura, V.: Sparkbench: A comprehensive benchmarking suite for in memory data analytic platform spark. In: Proceedings of the 12th ACM International Conference on Computing Frontiers. pp. 53:1–53:8. CF ’15, ACM, New York, NY, USA (2015) 36. Luo, C., Zhan, J., Jia, Z., Wang, L., Lu, G., Zhang, L., Xu, C., Sun, N.: Cloudrankd: benchmarking and ranking cloud computing systems for data processing applications. Frontiers of Computer Science 6(4), 347–362 (2012) 37. Manyika, J., Chui, M., Brown, B., Bughin, J., Dobbs, R., Roxburgh, C., Byers, A.H.: Big data: The Next Frontier for Innovation, Competition, and Productivity. Tech. rep., McKinsey Global Institute (2011), http://www.mckinsey.com/insights/mgi/research/technology_and_ innovation/big_data_the_next_frontier_for_innovation 38. Min Li: SparkBench (2015), https://bitbucket.org/lm0926/sparkbench 39. Ming, Z., Luo, C., Gao, W., Han, R., Yang, Q., Wang, L., Zhan, J.: BDGS: A scalable big data generator suite in big data benchmarking. In: Advancing Big Data Benchmarks - Proceedings of the 2013 Workshop Series on Big Data Benchmarking, WBDB.cn, Xi’an, China, July 16-17, 2013 and WBDB.us, San Jos´e, CA, USA, October 9-10, 2013 Revised Selected Papers. pp. 138–154 (2013) 40. MRBS: MRBS (2013), http://sardes.inrialpes.fr/research/mrbs/index.html 41. Nambiar, R.O., Poess, M., Dey, A., Cao, P., Magdon-Ismail, T., Ren, D.Q., Bond, A.: Introducing tpcx-hs: The first industry standard for benchmarking big data systems. In: Performance Characterization and Benchmarking. Traditional to Big Data - 6th TPC Technology Conference, TPCTC 2014, Hangzhou, China, September 1-5, 2014. Revised Selected Papers. pp. 1–12 (2014) 42. Olston, C., Reed, B., Srivastava, U., Kumar, R., Tomkins, A.: Pig latin: a notso-foreign language for data processing. In: Proceedings of the ACM SIGMOD International Conference on Management of Data, SIGMOD 2008, Vancouver, BC, Canada, June 10-12, 2008. pp. 1099–1110 (2008) 43. Patil, S., Polte, M., Ren, K., Tantisiriroj, W., Xiao, L., L´ opez, J., Gibson, G., Fuchs, A., Rinaldi, B.: YCSB++: benchmarking and performance debugging advanced features in scalable table stores. In: ACM Symposium on Cloud Computing in conjunction with SOSP 2011, SOCC ’11, Cascais, Portugal, October 26-28, 2011. p. 9 (2011) 44. Pavlo, A., Paulson, E., Rasin, A., Abadi, D.J., DeWitt, D.J., Madden, S., Stonebraker, M.: A Comparison of Approaches to Large-Scale Data Analysis. In: SIGMOD. pp. 165–178 (2009) 45. Poggi, N., Carrera, D., Call, A., Mendoza, S., Becerra, Y., Torres, J., Ayguad´e, E., Gagliardi, F., Labarta, J., Reinauer, R., Vujic, N., Green, D., Blakeley, J.: ALOJA: A systematic study of hadoop deployment variables to enable automated characterization of cost-effectiveness. In: 2014 IEEE Intl. Conf. on Big Data, Big Data 2014, Washington, DC, USA, October 27-30, 2014. pp. 905–913 (2014) 46. Rabl, T., Frank, M., Sergieh, H.M., Kosch, H.: A data generator for cloud-scale benchmarking. In: Performance Evaluation, Measurement and Characterization of Complex Systems - Second TPC Technology Conference, TPCTC 2010, Singapore, September 13-17, 2010. Revised Selected Papers. pp. 41–56 (2010) 47. Rabl, T., Poess, M.: Parallel data generation for performance analysis of large, complex RDBMS. In: DBTest ’11. p. 5 (2011) 48. Sakr, S., Casati, F.: Liquid benchmarks: Towards an online platform for collaborative assessment of computer science research results. In: Proceedings of the Second
49.
50. 51.
52. 53. 54. 55. 56. 57. 58.
59. 60.
TPC Technology Conference on Performance Evaluation, Measurement and Characterization of Complex Systems. pp. 10–24. TPCTC’10, Springer-Verlag, Berlin, Heidelberg (2011) Sakr, S., Shafaat, A., Bajaber, F., Barnawi, A., Batarfi, O., Altalhi, A.H.: Liquid benchmarking: A platform for democratizing the performance evaluation process. In: Proceedings of the 18th International Conference on Extending Database Technology, EDBT 2015, Brussels, Belgium, March 23-27, 2015. pp. 537–540 (2015) Sangroya, A., Serrano, D., Bouchenak, S.: MRBS: A Comprehensive MapReduce Benchmark Suite. Tech. rep., LIG Grenoble Fr (2012) Sangroya, A., Serrano, D., Bouchenak, S.: MRBS: towards dependability benchmarking for hadoop mapreduce. In: Euro-Par 2012: Parallel Processing Workshops - BDMC, CGWS, HeteroPar, HiBB, OMHI, Paraphrase, PROPER, Resilience, UCHPC, VHPC, Rhodes Islands, Greece, August 27-31, 2012. Revised Selected Papers. pp. 3–12 (2012) Sherif Sakr: Liquid benchmarking (2015), http://wiki.liquidbenchmark.net/doku.php/home Stonebraker, M., Abadi, D.J., DeWitt, D.J., Madden, S., Paulson, E., Pavlo, A., Rasin, A.: Mapreduce and parallel dbmss: friends or foes? Commun. ACM 53(1), 64–71 (2010) Transaction Processing Performance Council: TPC Benchmark H - Standard Specification (2014), version 2.17.1 Transaction Processing Performance Council: TPC Benchmark DS - Standard Specification (2015), version 1.3.1 Transaction Processing Performance Council: TPC Express Benchmark HS - Standard Specification (2015), version 1.3.0 Wang, L., Zhan, J., Luo, C., Zhu, Y., Yang, Q., He, Y., Gao, W., Jia, Z., Shi, Y., Zhang, S., Zhen, C., Lu, G., Zhan, K., Li, X., Qiu, B.: BigDataBench: a Big Data Benchmark Suite from Internet Services. In: HPCA (2014) Xiong, W., Yu, Z., Bei, Z., Zhao, J., Zhang, F., Zou, Y., Bai, X., Li, Y., Xu, C.: A characterization of big data benchmarks. In: Proceedings of the 2013 IEEE International Conference on Big Data, 6-9 October 2013, Santa Clara, CA, USA. pp. 118–125 (2013) Yahoo: YCSB (2015), https://github.com/brianfrankcooper/YCSB Yanpei Chen: Statistical Workload Injector for MapReduce (SWIM) (2013), https://github.com/SWIMProjectUCB/SWIM/wiki