Business Analytics and Intelligence, 11–13 December 2013
Big Data: Evaluating the Nature of data in Indian Corporate Prof. Minakshi Agrawal Welingkar Institute of Management Development and Research Mumbai, India Emailid:
[email protected]
Prof. Dr. Pradeep Pendse, Welingkar Institute of Management Development and Research Mumbai, India Emailid:
[email protected]
Ritesh Dhameja. Welingkar Institute of Management Development and Research Mumbai, India Emailid:
[email protected]
Abstract Data-driven decision-making is now being recognized broadly, and there is growing enthusiasm for the notion of ``Big Data.‟‟ Decisions that previously were based on guess work can now be made based on data itself. The Indian economy produces a constant stream of data that is being monitored and analyzed. There has been a tremendous explosion of Information amongst the Indian enterprises over the last few years. Notably in Indian organizations (across verticals like BFSI, Media & Entertainment, Telecommunications, and Government) at present have more than 100 TB data. The research paper aims to study the amount of data stored by Indian corporate today along with their characteristics such as Size, Type and the rate at which the data is received. The research also focuses on identifying scope for Usage of Big data Technologies in Data Management in Corporate in India. Keywords Big data, Data Management, Data Driven Decision making, velocity, variety, volume, veracity
Business Analytics and Intelligence, 11–13 December 2013
1. Introduction As per the International Data Corporation(IDC), the amount of information generated and replicated surpassed 1.8ZB (1.6 trillion gigabytes) in 2011 and will rise to 90 zettabytes by 20201i. The large volume of data which includes customer information, social interactions, sales data, and physical infrastructure contribute to growth of volume of data. The recent study conducted by the EMC corporation reveals that 91 per cent of Indian businesses were aware of the potential benefits of Big Data, but 26 per cent of companies had no current plans to utilize Big Data technology. According to another study by technology researcher International Data Corp., the Big Data market in India is expected to grow at nearly 38 per cent annually, reaching $153.1 million in 2014. 1.1 Defining Bigdata IDC defines that big data is the new generation of technologies and architectures designed to extract value economically from very large volumes of a wide variety of data by enabling high-velocity capture, discovery, and/or analysis. The definition encompasses hardware and software which integrates, organizes, manages, analyzes, and the real time data which can be further characterized as the "Three Vs": Volume, Variety, and Velocity. Gartner, the author of the “hype cycle” concept, defines the “BIG Data” (BIGD) concept as "high volume, velocity and/or variety information assets that demand cost-effective, innovative forms of information processing that enable enhanced insight, decision making, and process automation"2. Zikipoulos et al (2013) outline four Vs that characterize IBM‟s approach to big data.According to Zikipoulos (2013) ,Volume deals with the average of data measured in zettabytes and each of which contains about one million petabytes of data. Velocity is rate which the data has been captured processed and understood. Variety is defined as the capturing of the new unstructured data and then identifies the linkages of the new data with the structured data.3 Hendler(2013) defines“Veracity” as “conformity with truth or fact” 4. The Veracity of Big Data has less to do with the inherent characteristics of the data but helps to deal with the lack of consistency/quality in big data sources. The Veracity involves techniques from data warehouse world to clean the data or analyze or verify the quality of the data. Big Data is the unstructured data of the relational world and efforts need to be made to ensure its quality5. Thre has been lots of tools and
1
Gantz, J., & Reinsel, D. (2011). Extracting value from chaos. IDC iView, 1-12.
2
Fenn, J., Raskino, M., & Gammage, B. (2009). Gartner's hype cycle special report for 2009. Gartner, Stamford, CT. 3
Crandall, R. E., & CFPIM, C. The Big Data Revolution.
4
Hendler, J. (2013). Broad data: Exploring the emerging web of data. Big Data, 1(1), 18-20
5
Chang, F., Dean, J., Ghemawat, S., Hsieh, W. C., Wallach, D. A., Burrows, M., ... & Gruber, R. E. (2008). Bigtable: A distributed storage system for structured data. ACM Transactions on Computer Systems (TOCS), 26(2), 4.
Business Analytics and Intelligence, 11–13 December 2013
technologies developed to deal with the four V‟s of big data. The tools and technologies available are : 1. MapReduce technologies used to decentralize data storage and process the large data sets to increase the speed and reliability of dealing with data6. 2. Hadoop was developed to use for building distributed system to store, process and analyze the large datasets. It helps the programmers who deals with thousands of independent computers and petabytes for solving big data problems7. 3. Not only SQL Database (No SQL) is a document-oriented database using a key/ value interface to classify, organize and to manage large volumes of unstructured data which do not have a fixed schema8. 4. Natural Language Processing is used for sentimental analysis by extracting information from human-created text9. This type of processing requires sorting through data that is created by human. For instance, if we are analyzing Twitter data from the previous six months, you might be looking for keywords and sentiments which would require natural language processing. 1.2 Benefits of bigdata: 1. Big data gives the holistic picture of the customer expectation and innovative ways to engage with existing and potential customers. 2. Data warehouses are restricted to store and process the data in traditional RDBMS, while big data allows to store, process and analyze from a wide range of unstructured sources such as social media, emails and spreadsheets 3. Other Benefits which Include: a) Efficiently analyze and relate the Information according to the market trends, Competition to predict future b) Reduce costs c) Increase Sales
6
Dean, J., & Ghemawat, S. (2008). MapReduce: simplified data processing on large clusters. Communications of the ACM, 51(1), 107-113. 7
White, T. (2012). Hadoop: the definitive guide. O'Reilly.
8
Tauro, C. J., Aravindh, S., & Shreeharsha, A. B. (2012). Comparative Study of the New Generation, Agile, Scalable, High Performance NOSQL Databases.International Journal of Computer Applications (0975–888) Volume, 7461-0336. 9
Lohr, S. (2012). The age of big data. New York Times, 11.
Business Analytics and Intelligence, 11–13 December 2013
d) Helps to take other Strategic decisions 1.3 Challenges to Big Data Usage: 1) Expensive in terms of analyzing and processing so should be used only for the Business purpose. 2) Data analysis is a clear bottleneck in many applications because of the lack of scalability of complex algorithm and complexity of the data. 3) The data today are in weakly structured or not in structured format which need to be convert in the structured for storage purpose as well as for future analysis. for example, tweets and blogs are weakly structured pieces of text, while images and video are structured for storage and display, but need to be converted in structured format for future analysis. 4) The complexity, diversity in terms of scale and time and privacy problems with Big Data impacts the progress at each stages which can create value from data. 5) The high Velocity data is to be stored, analyzed and process at a speed which enables to give out a desired response. 6) Experience and skills of Company‟s own employees to use Big Data effectively 2. Purpose of Research The purpose of the paper is 1. To determine the average size of data in organization of different sizes. 2. Analyzing data based on Volume, velocity and Variety of data in a given organizations to qualify the data as bigdata. 3. Capability of Organization to manage the big data. All the above analysis was further carried out with reference to the size of the organization. 3. Research Methodology A data was collected from 28 people ranging from Team Leaders to CIOs of reputed organization. Data has been administered through questionnaire using convenience sampling. The sample size was small due to the difficulty in getting responses from Senior Management people like CIO‟s. The questionnaire was focused on the three v‟s of bigdata volume, velocity and variety to analyze the purpose of storage of Historical data in Organizations and the proportion in which the different types of data is stored in the Organization. Thus an attempt to collect the information about the three “V”s of Big Data and along with other factors such as the purpose of storage of data and the Key concerns organizations are facing today with respect to data management. The big data score is calculated for the responses collected by dividing Organizations into
Business Analytics and Intelligence, 11–13 December 2013
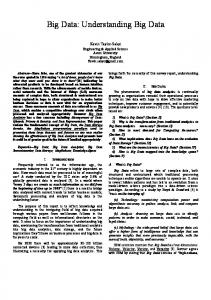
groups based on size of data as the sample size collected. The big data score is an indication to the extent to which the Organization is efficiently able to meet its big data needs and is depicted through a scorecard method for measuring the four key activities of data management such as 1) Capture of Data 2) Storage of data 3) Processing 4) Retrieve and View. Based on the data gathered and the subsequent analysis a comment was made whether the data in the organization could be considered as a big data. 4. Data Analysis Amount of data with Organizations. (Amount of Data Stored in the Transactional, Archived and Data warehouse Databases). The transactional data stored in databases by various Organizations surveyed is as follows: 4.1 Size of Data
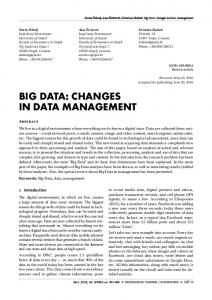
36% of the Organizations are storing more than 50TB of data in their transactional databases. 4.2 Data warehouse 20% of Organizations are storing more than 1 PetaByte of data in their data warehouse databases:
Business Analytics and Intelligence, 11–13 December 2013
4.3 Archival 15% of Organizations store more than 10 PetaBytes of data in their archived databases:
4.4 Purpose of Storing data The reasons for which historical data is being stored is as follows: Rank Responses Data Mining/Analysis
1
22
Compliance
2
20
Transactional
3
17
BCP and DR
4
13
Knowledge Management 5
12
Business Analytics and Intelligence, 11–13 December 2013
Thus maximum data is being stored for Data Mining/analysis and Compliance purposes followed by Transactional. The responses column shows the number of respondents storing data for that reason. 4.5 Rate of generation of data (Data volume received daily/Monthly). 24% of Organizations receive more than 50GB of data per day.
4.6 Future growth of data. (Rate of increase in data the organization expects in the next 3 years).
36% of the Organizations expect that massive data exploitation will be there and data will increase at a rate of more than 40% year on year for the next three years. 4.7 Variety of data stored with the Corporate. (Different types of data stored/received by the Organization). The Organizations were asked to rate the data on a scale of 1(Lowest share) to 6(highest share) the share of different types of data and the result was as follows: Type of Data Transactions Unstructured content(documents, emails) Voice / Audio data
Rank 1 2 3
Score out of 6 4.64 4.15 3.38
Business Analytics and Intelligence, 11–13 December 2013
Social Media Sensor/Machine Data Click stream Data
4 5 6
3.31 3.27 3.17
Table 1 Hence we can see Transactions and unstructured content from emails, office Docs have a major share and Click stream data has the lowest share. There is a close tie between transactions and office docs. Voice and Audio content is on the third number showing the need for NoSQL tools to handle unstructured content. 4.8 Concern areas related to data management (Please rate the level of concern the organization is having in the following activities related to data management. 1 - Not a Concern, 6 - Most Concerned). Task Maintaining Security of data Deriving useful information from data in required time Response time to customers Increase in Data management Costs. Having a Centralized view of Data Scalability of Current Infrastructure Manpower available
Rank 1 2
Average Score by respondents 4.86 4.36
3 4
4.29 3.64
5
3.50
6
3.43
7
2.86 Table 2
The Organizations were asked to rate the level of concern in each of above activity related to data management and the result was that the most concern is about being able to derive useful information from data in time, and to maintain security of all the data at all points. The response time to customers follows closely. Determination of big data requirement: The rating points given by organizations is for the four processes of 1. 2. 3. 4.
Capture of data Storage of Data Process and Analysis of data Retrieve and Visualize in Required format and time
Method of Calculation of big data score: For each combination of Big Data Measures i.e. volume, velocity and variety and Activities i.e. Capture, store, process and visualize a score was taken by the respondents according to the following scale: 6 = Handled perfectly or not required 4 = Handled ok but could be improved 2 = Handled poorly and frequently results in
Business Analytics and Intelligence, 11–13 December 2013
negative business impact 1 = Need exists but not handled. The ratings on a scale of 1 to 6 of the processes being carried out in their respective organizations: The Organizations have divided on the basis of the amount of data being stored in the transactional databases. The Analysis for each segment gave a big data score by which we can determine as to how much the organization is able to meet its Big Data Requirements. The three clusters formed are as follows: 1) Data stored below 1 Tera Byte Capture 3.82 Volume Velocity 4.09 3.36 Variety Total Big Data Score
Store
Process/Analyze Retrieve and Visualize
3.91 4.18 3.64
3.27 3.36 3.00 42.55
3.45 3.36 3.09
Total of Each "V" 14.45 15.00 13.09
Table 3 Hence the overall score of these companies is 42.55 from a total score of 72 (which is arrived at by combining all the 3V‟s X 4 Activities X 6). 2) Data size between 1TB and 50TB Capture
4.50 Volume 5.00 Velocity 4.50 Variety Total Big Data Score
Store
5.00 5.25 5.13
Process /Analyz e 4.00 4.13 3.38 53.75
Retrieve and Visualize 4.75 4.25 3.88
Total of Each "V" 18.25 18.63 16.88
Table 4 Hence the overall score of these companies is 53.75 from a total score of 72. 3) Data size beyond 50TB Capture 4.60 Volume 4.60 Velocity 4.30 Variety Total Big Data Score
Store 4.90 4.80 4.70
Process/ Analyze 4.10 3.90 4.10 52.90
Retrieve and Visualize 4.40 4.20 4.30
Total of Each "V" 18.00 17.50 17.40
Table 5 Hence the overall score of these companies is 53.90 from a total score of 72 Average Score: Hence the average big data score of all the respondents in the three categories is 69%.
Business Analytics and Intelligence, 11–13 December 2013
5. Limitation of Research The present study is subjected to following LIMITATIONS, 1. The sample was restricted to 28 respondents, which may restrict the scope and completion of study. 2. Bigdata opportunities for judging the veracity /quality of data in an organization which may be important in certain analysis such as sentimental analysis has not been considered in the scope of research. 6. Conclusion The following factors are derived from the research done: 1. Approximately 20% of the Organizations store more than 1 Peta Byte of data in their Datawarehouse databases and 15% of the organizations store more than 10 Petabytes of data in their Archival databases. 2. Data explosion – 36% of the companies expect data to grow at a rate of more than 40% year-on-year. 3. 24% of the Organizations receive more than 50GB of data per day. 4. The major concern areas in data management are security, analyzing it for business decisions and responding to customers in time, all of them are crucial for any business. 5. In addition to that as per the respondents the major reason for storing historical data itself is for Analysis/Decision making and Compliance purposes. 6. Unstructured content (business documents, emails) has one of the highest shares among the total pie of data stored with the Organizations of the respondents and to use this unstructured content big data tools and technologies are required. Considering the above 6 factors and a average Big data score of 69% we can conclude that there are huge Big data technologies requirement for Data Management in Indian corporate today. References [1] Gantz, J., & Reinsel, D. (2011). Extracting value from chaos. IDC iView, pp. 112. [2] Fenn, J., Raskino, M., & Gammage, B. (2009). Gartner's hype cycle special report for 2009. Gartner, Stamford, CT. [3] Crandall, R. E., & CFPIM, C. The Big Data Revolution. [4] Hendler, J. (2013). Broad data: Exploring the emerging web of data. Big Data,Vol. 1(1), pp. 18-20
Business Analytics and Intelligence, 11–13 December 2013
[5] Chang, F., Dean, J., Ghemawat, S., Hsieh, W. C., Wallach, D. A., Burrows, M., & Gruber, R. E. (2008). Bigtable: A distributed storage system for structured data. ACM Transactions on Computer Systems (TOCS), Vol. 26(2), pp 4. [6] Dean, J., & Ghemawat, S. (2008). MapReduce: simplified data processing on large clusters. Communications of the ACM,Vol. 51(1), pp. 107-113. [7] White, T. (2012). Hadoop: the definitive guide. O'Reilly. [8] Tauro, C. J., Aravindh, S., & Shreeharsha, A. B. (2012). Comparative Study of the New Generation, Agile, Scalable, High Performance NOSQL Databases.International Journal of Computer Applications (0975–888) Vol.,pp. 7461-0336. [9] Lohr, S. (2012). The age of big data. New York Times, 11. [10] Russom, P. (2011). Big data analytics. TDWI Best Practices Report, Fourth Quarter. [11] Malik, P. (2013). Governing Big Data: Principles and practices. IBM Journal of Research and Development, Vol. 57(3/4),pp. 1-1. [12] APICS The Association for Operations Management. 2012. “2012 Big Data Insights and Innovations.” [13] Zikopoulos, Paul C., Dirk de Roos, Krishnan Parasuraman, Thomas Deutsch, David Corrigan, James Giles.( 2013). Harness the Power of Big Data: The IBM Big Data Platform. McGraw-Hill, New York. [14] Analytics: The real-world use of big data. How innovative enterprises extract value from uncertain data, IBM Global Business Services Business Analytics and Optimization,Executive Report, IBM Institute for Business Value. http://public.dhe.ibm.com/common/ssi/ecm/en/gbe03519usen/GBE03519USEN.PD F [15] Davenport, T. H., Barth, P., & Bean, R. (2012). How „Big Data‟is Different. MIT Sloan Management Review, Vol. 54(1),pp. 22-24. [16] Bertino, E., Bernstein, P., Agrawal, D., Davidson, S., Dayal, U., Franklin, M., & Widom, J. (2011). Challenges and Opportunities with Big Data. [17] Manyika, J., Chui, M., Brown, B., Bughin, J., Dobbs, R., Roxburgh, C., & Byers, A. H. (2011). Big data: The next frontier for innovation, competition, and productivity. [18] Ferguson, M. (2012). Architecting A Big Data Platform for Analytics. A Whitepaper Prepared for IBM.