International Journal of Information Management 36 (2016) 1231–1247
Contents lists available at ScienceDirect
International Journal of Information Management journal homepage: www.elsevier.com/locate/ijinfomgt
Big data: From beginning to future Ibrar Yaqoob a,∗ , Ibrahim Abaker Targio Hashem a , Abdullah Gani a,∗ , Salimah Mokhtar a , Ejaz Ahmed a , Nor Badrul Anuar a , Athanasios V. Vasilakos b a Centre for Mobile Cloud Computing Research (C4MCCR), Faculty of Computer Science and Information Technology, University of Malaya, 50603 Lembah Pantai, Kuala Lumpur, Malaysia b Lulea University of Technology, Sweden
a r t i c l e
i n f o
Article history: Received 19 November 2014 Received in revised form 29 June 2016 Accepted 31 July 2016 Keywords: Big data Parallel and distributed computing Cloud computing Internet of things Social media Analytics
a b s t r a c t Big data is a potential research area receiving considerable attention from academia and IT communities. In the digital world, the amounts of data generated and stored have expanded within a short period of time. Consequently, this fast growing rate of data has created many challenges. In this paper, we use structuralism and functionalism paradigms to analyze the origins of big data applications and its current trends. This paper presents a comprehensive discussion on state-of-the-art big data technologies based on batch and stream data processing. Moreover, strengths and weaknesses of these technologies are analyzed. This study also discusses big data analytics techniques, processing methods, some reported case studies from different vendors, several open research challenges, and the opportunities brought about by big data. The similarities and differences of these techniques and technologies based on important parameters are also investigated. Emerging technologies are recommended as a solution for big data problems. © 2016 Elsevier Ltd. All rights reserved.
Contents 1. 2.
3.
4.
Introduction . . . . . . . . . . . . . . . . . . . . . . . . . . . . . . . . . . . . . . . . . . . . . . . . . . . . . . . . . . . . . . . . . . . . . . . . . . . . . . . . . . . . . . . . . . . . . . . . . . . . . . . . . . . . . . . . . . . . . . . . . . . . . . . . . . . . . . . . . . 1232 Genesis of big data applications . . . . . . . . . . . . . . . . . . . . . . . . . . . . . . . . . . . . . . . . . . . . . . . . . . . . . . . . . . . . . . . . . . . . . . . . . . . . . . . . . . . . . . . . . . . . . . . . . . . . . . . . . . . . . . . . . . . . . 1232 2.1. Current big data trends . . . . . . . . . . . . . . . . . . . . . . . . . . . . . . . . . . . . . . . . . . . . . . . . . . . . . . . . . . . . . . . . . . . . . . . . . . . . . . . . . . . . . . . . . . . . . . . . . . . . . . . . . . . . . . . . . . . . . . . 1233 2.2. Sources of big data . . . . . . . . . . . . . . . . . . . . . . . . . . . . . . . . . . . . . . . . . . . . . . . . . . . . . . . . . . . . . . . . . . . . . . . . . . . . . . . . . . . . . . . . . . . . . . . . . . . . . . . . . . . . . . . . . . . . . . . . . . . . 1234 State-of-the-art big data processing technologies and methods . . . . . . . . . . . . . . . . . . . . . . . . . . . . . . . . . . . . . . . . . . . . . . . . . . . . . . . . . . . . . . . . . . . . . . . . . . . . . . . . . . . . 1234 3.1. Batch based processing technologies . . . . . . . . . . . . . . . . . . . . . . . . . . . . . . . . . . . . . . . . . . . . . . . . . . . . . . . . . . . . . . . . . . . . . . . . . . . . . . . . . . . . . . . . . . . . . . . . . . . . . . . . 1235 3.2. Technologies based on stream processing . . . . . . . . . . . . . . . . . . . . . . . . . . . . . . . . . . . . . . . . . . . . . . . . . . . . . . . . . . . . . . . . . . . . . . . . . . . . . . . . . . . . . . . . . . . . . . . . . . . 1237 3.3. Big data processing methods . . . . . . . . . . . . . . . . . . . . . . . . . . . . . . . . . . . . . . . . . . . . . . . . . . . . . . . . . . . . . . . . . . . . . . . . . . . . . . . . . . . . . . . . . . . . . . . . . . . . . . . . . . . . . . . . . 1238 3.3.1. Hashing . . . . . . . . . . . . . . . . . . . . . . . . . . . . . . . . . . . . . . . . . . . . . . . . . . . . . . . . . . . . . . . . . . . . . . . . . . . . . . . . . . . . . . . . . . . . . . . . . . . . . . . . . . . . . . . . . . . . . . . . . . . . . 1238 3.3.2. Indexing . . . . . . . . . . . . . . . . . . . . . . . . . . . . . . . . . . . . . . . . . . . . . . . . . . . . . . . . . . . . . . . . . . . . . . . . . . . . . . . . . . . . . . . . . . . . . . . . . . . . . . . . . . . . . . . . . . . . . . . . . . . . . 1238 3.3.3. Bloom filter . . . . . . . . . . . . . . . . . . . . . . . . . . . . . . . . . . . . . . . . . . . . . . . . . . . . . . . . . . . . . . . . . . . . . . . . . . . . . . . . . . . . . . . . . . . . . . . . . . . . . . . . . . . . . . . . . . . . . . . . . 1239 3.3.4. Parallel computing . . . . . . . . . . . . . . . . . . . . . . . . . . . . . . . . . . . . . . . . . . . . . . . . . . . . . . . . . . . . . . . . . . . . . . . . . . . . . . . . . . . . . . . . . . . . . . . . . . . . . . . . . . . . . . . . . . 1239 3.4. Summary . . . . . . . . . . . . . . . . . . . . . . . . . . . . . . . . . . . . . . . . . . . . . . . . . . . . . . . . . . . . . . . . . . . . . . . . . . . . . . . . . . . . . . . . . . . . . . . . . . . . . . . . . . . . . . . . . . . . . . . . . . . . . . . . . . . . . 1239 Big data analysis techniques . . . . . . . . . . . . . . . . . . . . . . . . . . . . . . . . . . . . . . . . . . . . . . . . . . . . . . . . . . . . . . . . . . . . . . . . . . . . . . . . . . . . . . . . . . . . . . . . . . . . . . . . . . . . . . . . . . . . . . . . . 1240 4.1. Data mining . . . . . . . . . . . . . . . . . . . . . . . . . . . . . . . . . . . . . . . . . . . . . . . . . . . . . . . . . . . . . . . . . . . . . . . . . . . . . . . . . . . . . . . . . . . . . . . . . . . . . . . . . . . . . . . . . . . . . . . . . . . . . . . . . . . 1240 4.2. Web mining . . . . . . . . . . . . . . . . . . . . . . . . . . . . . . . . . . . . . . . . . . . . . . . . . . . . . . . . . . . . . . . . . . . . . . . . . . . . . . . . . . . . . . . . . . . . . . . . . . . . . . . . . . . . . . . . . . . . . . . . . . . . . . . . . . . 1240 4.3. Visualization methods . . . . . . . . . . . . . . . . . . . . . . . . . . . . . . . . . . . . . . . . . . . . . . . . . . . . . . . . . . . . . . . . . . . . . . . . . . . . . . . . . . . . . . . . . . . . . . . . . . . . . . . . . . . . . . . . . . . . . . . . 1240 4.4. Machine learning . . . . . . . . . . . . . . . . . . . . . . . . . . . . . . . . . . . . . . . . . . . . . . . . . . . . . . . . . . . . . . . . . . . . . . . . . . . . . . . . . . . . . . . . . . . . . . . . . . . . . . . . . . . . . . . . . . . . . . . . . . . . . 1240 4.5. Optimization methods . . . . . . . . . . . . . . . . . . . . . . . . . . . . . . . . . . . . . . . . . . . . . . . . . . . . . . . . . . . . . . . . . . . . . . . . . . . . . . . . . . . . . . . . . . . . . . . . . . . . . . . . . . . . . . . . . . . . . . . . 1241 4.6. Social network analysis . . . . . . . . . . . . . . . . . . . . . . . . . . . . . . . . . . . . . . . . . . . . . . . . . . . . . . . . . . . . . . . . . . . . . . . . . . . . . . . . . . . . . . . . . . . . . . . . . . . . . . . . . . . . . . . . . . . . . . . 1241
∗ Corresponding authors. E-mail addresses:
[email protected],
[email protected] (I. Yaqoob),
[email protected] (I.A.T. Hashem),
[email protected] (A. Gani),
[email protected] (S. Mokhtar),
[email protected] (E. Ahmed),
[email protected] (N.B. Anuar),
[email protected] (A.V. Vasilakos). http://dx.doi.org/10.1016/j.ijinfomgt.2016.07.009 0268-4012/© 2016 Elsevier Ltd. All rights reserved.
1232
5.
6.
7. 8.
I. Yaqoob et al. / International Journal of Information Management 36 (2016) 1231–1247
4.7. Summary . . . . . . . . . . . . . . . . . . . . . . . . . . . . . . . . . . . . . . . . . . . . . . . . . . . . . . . . . . . . . . . . . . . . . . . . . . . . . . . . . . . . . . . . . . . . . . . . . . . . . . . . . . . . . . . . . . . . . . . . . . . . . . . . . . . . . 1241 Case studies on big data technologies . . . . . . . . . . . . . . . . . . . . . . . . . . . . . . . . . . . . . . . . . . . . . . . . . . . . . . . . . . . . . . . . . . . . . . . . . . . . . . . . . . . . . . . . . . . . . . . . . . . . . . . . . . . . . . . 1241 5.1. AppNexus . . . . . . . . . . . . . . . . . . . . . . . . . . . . . . . . . . . . . . . . . . . . . . . . . . . . . . . . . . . . . . . . . . . . . . . . . . . . . . . . . . . . . . . . . . . . . . . . . . . . . . . . . . . . . . . . . . . . . . . . . . . . . . . . . . . . . 1241 5.2. Safari books online . . . . . . . . . . . . . . . . . . . . . . . . . . . . . . . . . . . . . . . . . . . . . . . . . . . . . . . . . . . . . . . . . . . . . . . . . . . . . . . . . . . . . . . . . . . . . . . . . . . . . . . . . . . . . . . . . . . . . . . . . . . 1243 Big data opportunities and challenges . . . . . . . . . . . . . . . . . . . . . . . . . . . . . . . . . . . . . . . . . . . . . . . . . . . . . . . . . . . . . . . . . . . . . . . . . . . . . . . . . . . . . . . . . . . . . . . . . . . . . . . . . . . . . . . 1243 6.1. Data analytics . . . . . . . . . . . . . . . . . . . . . . . . . . . . . . . . . . . . . . . . . . . . . . . . . . . . . . . . . . . . . . . . . . . . . . . . . . . . . . . . . . . . . . . . . . . . . . . . . . . . . . . . . . . . . . . . . . . . . . . . . . . . . . . . . 1243 6.2. Open research challenges for big data . . . . . . . . . . . . . . . . . . . . . . . . . . . . . . . . . . . . . . . . . . . . . . . . . . . . . . . . . . . . . . . . . . . . . . . . . . . . . . . . . . . . . . . . . . . . . . . . . . . . . . . 1243 6.2.1. NoSql databases . . . . . . . . . . . . . . . . . . . . . . . . . . . . . . . . . . . . . . . . . . . . . . . . . . . . . . . . . . . . . . . . . . . . . . . . . . . . . . . . . . . . . . . . . . . . . . . . . . . . . . . . . . . . . . . . . . . . . 1243 6.2.2. High-performance computing systems . . . . . . . . . . . . . . . . . . . . . . . . . . . . . . . . . . . . . . . . . . . . . . . . . . . . . . . . . . . . . . . . . . . . . . . . . . . . . . . . . . . . . . . . . . . . 1243 6.2.3. Big data indexing schemes . . . . . . . . . . . . . . . . . . . . . . . . . . . . . . . . . . . . . . . . . . . . . . . . . . . . . . . . . . . . . . . . . . . . . . . . . . . . . . . . . . . . . . . . . . . . . . . . . . . . . . . . . 1243 6.2.4. Analytics . . . . . . . . . . . . . . . . . . . . . . . . . . . . . . . . . . . . . . . . . . . . . . . . . . . . . . . . . . . . . . . . . . . . . . . . . . . . . . . . . . . . . . . . . . . . . . . . . . . . . . . . . . . . . . . . . . . . . . . . . . . . 1243 6.2.5. Data quality . . . . . . . . . . . . . . . . . . . . . . . . . . . . . . . . . . . . . . . . . . . . . . . . . . . . . . . . . . . . . . . . . . . . . . . . . . . . . . . . . . . . . . . . . . . . . . . . . . . . . . . . . . . . . . . . . . . . . . . . . 1244 6.2.6. Visualization . . . . . . . . . . . . . . . . . . . . . . . . . . . . . . . . . . . . . . . . . . . . . . . . . . . . . . . . . . . . . . . . . . . . . . . . . . . . . . . . . . . . . . . . . . . . . . . . . . . . . . . . . . . . . . . . . . . . . . . . 1244 6.2.7. Big data security . . . . . . . . . . . . . . . . . . . . . . . . . . . . . . . . . . . . . . . . . . . . . . . . . . . . . . . . . . . . . . . . . . . . . . . . . . . . . . . . . . . . . . . . . . . . . . . . . . . . . . . . . . . . . . . . . . . . 1244 Emerging technologies for big data management . . . . . . . . . . . . . . . . . . . . . . . . . . . . . . . . . . . . . . . . . . . . . . . . . . . . . . . . . . . . . . . . . . . . . . . . . . . . . . . . . . . . . . . . . . . . . . . . . . . 1244 Conclusions . . . . . . . . . . . . . . . . . . . . . . . . . . . . . . . . . . . . . . . . . . . . . . . . . . . . . . . . . . . . . . . . . . . . . . . . . . . . . . . . . . . . . . . . . . . . . . . . . . . . . . . . . . . . . . . . . . . . . . . . . . . . . . . . . . . . . . . . . . . 1244 Conflict of interest . . . . . . . . . . . . . . . . . . . . . . . . . . . . . . . . . . . . . . . . . . . . . . . . . . . . . . . . . . . . . . . . . . . . . . . . . . . . . . . . . . . . . . . . . . . . . . . . . . . . . . . . . . . . . . . . . . . . . . . . . . . . . . . . . . . 1244 Acknowledgments . . . . . . . . . . . . . . . . . . . . . . . . . . . . . . . . . . . . . . . . . . . . . . . . . . . . . . . . . . . . . . . . . . . . . . . . . . . . . . . . . . . . . . . . . . . . . . . . . . . . . . . . . . . . . . . . . . . . . . . . . . . . . . . . . . . 1244 References . . . . . . . . . . . . . . . . . . . . . . . . . . . . . . . . . . . . . . . . . . . . . . . . . . . . . . . . . . . . . . . . . . . . . . . . . . . . . . . . . . . . . . . . . . . . . . . . . . . . . . . . . . . . . . . . . . . . . . . . . . . . . . . . . . . . . . . . . . . . 1246 Further reading . . . . . . . . . . . . . . . . . . . . . . . . . . . . . . . . . . . . . . . . . . . . . . . . . . . . . . . . . . . . . . . . . . . . . . . . . . . . . . . . . . . . . . . . . . . . . . . . . . . . . . . . . . . . . . . . . . . . . . . . . . . . . . . . . . . . . . 1246
1. Introduction Since the invention of computers, large amounts of data have been generated at a rapid rate. This condition is the key motivation for current and future research frontiers. Advances in mobile devices, digital sensors, communications, computing, and storage have provided means to collect data (Bryant, Katz, & Lazowska, 2008). According to the renowned IT company Industrial Development Corporation (IDC; 2011), the total amounts of data in the world has increased nine times within five years (Gantz and Reinsel, 2011). This figure is expected to double at least every two years (Chen, Mao, & Liu, 2014). Big data is a novel term that originated from the need of large companies, such as Yahoo, Google, and Facebook, to analyze large amounts of data (Garlasu et al., 2013). Various explanations from 3V Volume, Variety, and Velocity to 4V Volume, Velocity, Variety and Veracity have been provided to define big data (Gandomi & Haider, 2015; Philip Chen & Zhang, 2014; RodríguezMazahua et al., 2015; Hashem et al., 2015). Doug Laney (presently with Gartner) described big data through three Vs, namely, volume, velocity, and variety. The term volume refers to the size of the data, velocity refers to the speed of incoming and outgoing data, and variety describes the sources and types of data (Philip Chen & Zhang, 2014). IBM and Microsoft added veracity or variability as the fourth V to define big data. The term veracity refers to the messiness and trustworthiness of data. McKinsey & Co. added value as the fourth V to define big data (Chen et al., 2014). Value refers to the worth of hidden insights inside big data. Commonly, big data is a collection of large amounts of complex data that cannot be managed efficiently by the state-of-the-art data processing technologies (Philip Chen & Zhang, 2014). Off-the-shelf technologies utilized to store and analyze largescale data cannot operate satisfactorily (Siddiqa et al., 2016). Only advanced data mining and storage techniques can make the storage, management, and analysis of enormous data possible. The major challenges for researchers and practitioners arise from the exponential growth rate of data, which surpasses the current ability of humans to design appropriate data storage and analytic systems to manage large amounts of data effectively (Begoli & Horey, 2012). All the acronyms along with their definitions have been provided in Table 1. The contributions of this survey are as follows: (a) A broad overview of the genesis of big data applications and its current trends, (b) A discussion of big data processing technologies and methods, (c) A discussion of analysis techniques, (e) We look at dif-
ferent reported case studies (f) We explore opportunities brought about by big data and also discuss some of the research challenges remain to be addressed, (g) A discussion of emerging technologies for big data problems. These contributions are given in separate Sections from 2 to 7 respectively; the conclusion is provided in Section 8. 2. Genesis of big data applications To get to know the origins of big data applications, we considered the application architecture, chronological development, and gradual evolution of major application models, namely, standalone, desktop, the web, rich Internet, and big data applications (Abolfazli et al., 2014a). We then extrapolated our findings through two paradigms: structuralism and functionalism. These paradigms help analyze, characterize, comprehend, and interpret a phenomenon. “Structuralism examines the evolution of a phenomenon, compares its structural characteristics, and unveils its limitations while generally maintaining its ontology and epistemology (Burrell & Morgan, 1997). Structuralism aims to identify the underlying building blocks of a phenomenon and the relationships among these blocks to better comprehend the phenomenon. Functionalism analyzes the current and future roles and functionalities of a phenomenon in a certain environment to identify its characteristics and behavior (Burrell & Morgan, 1997).” Five metrics, namely, storage architecture, computing distribution, storage technology, analytics technology, and user experience, are utilized to evaluate these applications. These metrics are discussed below. • Storage architecture refers to stored data in a computing environment. It offers criteria for data processing operations that can be employed to control the flow of data in the system. It also provides standards for data systems and the interactions between these systems. • Computing distribution refers to numerous software components located in networked computers that perform as a single system. These computers can be remote from one another and connected by a wide area network or physically close together and connected by a local network. • Storage technology refers to the location where data is held in an electromagnetic or optical form. Storage technology has changed the landscape of digital media in a profound manner. Most current storage technologies rely on tape backup equipment (e.g., Large Hadron Collider) and software to manage storage systems.
I. Yaqoob et al. / International Journal of Information Management 36 (2016) 1231–1247 Table 1 List of acronyms. Abbreviation
Description
BI ETL HDFS HPC ICT IDC IoT IT NoSQL OLAP PB PY RDBMS RUX S4 SQL XML ZB
Business Intelligence Extract Transform, and Load Hadoop Distributed File System High-Performance Computing Information Communication Technology International Data Corporation Internet of Things Information Technology Not Only SQL Online Analytical Processing Petabyte Partially Yes Relational Database Management System Rich User Experience Simple Scalable Streaming System Structured Query Language Extensible Markup Language Zettabyte
• Analytics technology refers to the systematic computational analysis of transforming data into information; it is described as data-driven decision-making (Cooper, 2012). The main goal of analytics technology is to capture data collected from different sources and analyze these data to reach an optimal decision. • User experience refers to the overall quality of a user’s interaction with the system. It includes experiential, meaningful, practical, and valuable aspects of human–computer interaction. The study of the genesis of big data applications is beneficial to comprehending the conceptual foundation, vision, and trend of big data. The evolution of big data applications is discussed in detail in the succeeding paragraphs. The results of research in this area are shown in Fig. 1. The requirements of every era are summarized at the bottom of the diagram, and the top portion shows the technologies. Standalone applications employ a single processing unit to reflect users’ actions based on the computation speed of the host machine (Abolfazli et al., 2014a). When no network exists, a PC or server (e.g., an accounting package, image editor, word processor, custom programs, inventory management company, and actuarial table mortgage calculator) accepts input on the PC, performs several calculations, stores the data, and produces results. Organizations and individuals prefer this configuration because it can perform local tasks that can be confined to a specific location. It has opened up the pre-packaged software industry because of the many general applications that can be sold in many locations. The ability to select locally which software to run (either on a managed machine or a personal machine) is a significant source of empowerment and led to an increase in the purchase of the first managed corporate machines in the 1960s and 1970s and in the ˙ purchase of PCs in the 1980s (Kacprzyk & Zadrozny, 2001). The need for improved data storage capacity has increased rapidly, and the requirements of users continue to change over time. Standalone computation provides no mechanism for outsourcing in the case of excessive load processing (Abolfazli et al., 2014a,b,c). These restrictions affected the exponential growth and processing of data, inefficient institution supervision, and significant progress in the field of storage technology in 1970 and paved the way for the development of an innovative model when relational databases came into existence. Desktop applications are standalone applications that run on a desktop computer without accessing the Internet. Instant messaging applications are examples of desktop applications. The use of instant messaging has reached its peak (Lee et al., 1998). Therefore, several data monitoring machines are required to analyze data. To
1233
manage and analyze data in the past, OLAP, ETL, no SQL, and grid computing technologies were utilized. Access to all local services and data through the Internet is made possible by the development of web applications. Using web applications is similar to using custom software on a web server. However, a higher cost is required to make web pages and other data from a PC to connect to a web application. Applications, such as Google Docs, Meebo, Wobzip, Jaycut, Hootsuite, and Moof are examples of web applications. Development, maintenance, and management of web applications are complex because many operations are no longer available for interpretation in the absence of human intervention and machine operation. Rich Internet Applications combine web and desktop applications that have multilevel architecture. Currently distributed RIAs have an aesthetically pleasing, interactive, and easy-to-use interface for applications that provide users with constant Rich User Experience (Abolfazli et al., 2014b; Sanaei et al., 2014). People are inclined to use these applications because of their useful characteristics and ability to generate data rapidly. Although RIA methods, such as HTML5, XML, and AJAX, provide portability, online/offline functionality, and data access through an attractive interface, these advantages are insufficient to manage large amounts of data in an efficient manner. Concurrent with the success of the regional integration of computers and advances in fixed computers everywhere, smartphones have gained a significant contract rate capacity and resources, particularly movement and awareness related to a sensor’s unique location-based services and multimedia data. The data generated through heterogeneous resources are unstructured and cannot be stored in traditional databases. The requirements of users have changed; users now demand fast access to data, high data quality, efficient data compression techniques, data visualization, and data privacy and protection (O’Leary, 2015). The management of big data applications is currently a challenging task. 2.1. Current big data trends The world’s data volume is expected to grow 40% per year, and 50 times by 2020, as has been stated in (Waal-Montgomery, 2016). The ScienceDaily has been published a news that 90% of today’s data was generated in last two years (ScienceDaily, 2016). The market value of big data in 2010 was $3.2 billion, and this value was expected to increase to $16.9 billion in near future (Khan et al., 2014a). In (Waal-Montgomery, 2016), it has been predicted that there will be a huge increase in demand for Big Data skills between now and 2020. In addition, it has also been indicated that this demand is expected to grow by 160% in the United Kingdom alone. Walmart processes and imports more than 1 million customer transactions into databases, and according to estimates, this value involves more than 2.5 PB of data each hour. Owing to the rapid growth, data production in 2020 will be 44 times larger than it was in 2009 (Khan et al., 2014a). The daily increase in data allows us to foresee the respective growth rates. Until the early 1990s, the annual growth rate of data production was constant at roughly 40%. However, in 1998, it peaked at 88% (Odom & Massey, 2003). Since then, technological progress has slowed down (Khan et al., 2014a). IDC indicated that 1.8 ZB of data was created by the end of 2011 and predicted that 2.8 ZB would be generated by the next few years. Globally, approximately 1.2 ZB of electronic data are generated yearly (Khan et al., 2014a). IDC claims that enterprise data will reach 40 ZB by 2020 (Sagiroglu & Sinanc, 2013). According to IDC’s estimation, business-to-consumer (B2C) and Internet business-to-business (B2B) transaction will reach 450 billion per day by 2020 (Khan et al., 2014a). An illustration of recent data generation is provided in Fig. 2. The figure highlights how rapidly data is increasing in Zettabytes (Reckoning, 2014).
1234
I. Yaqoob et al. / International Journal of Information Management 36 (2016) 1231–1247
Fig. 1. Genesis of big data applications, including the gradual development of the architecture of candidate applications from early desktop to recent versions (Abolfazli et al., 2014a).
Fig. 2. The rapid growth rate of data in Zettabytes.
The number of e-mail accounts created worldwide is expected to increase from 3.3 billion in 2012 to over 4.3 billion by late 2016 (Khan et al., 2014a). In 2012, the number of e-mails sent and received was 89 billion per day; these amounts are expected to increase at an average annual rate of 13% over the next four years and will reach over 143 billion by the end of 2016. Boston.com reported that in 2013, approximately 507 billion e-mail messages were sent daily and this sending rate is expected to increase in future (Khan et al., 2014a). Presently, an e-mail is sent every 3.5 × 10⁻⁷ s (Khan et al., 2014a). These conditions are some of the causes of the rapid production of data, which increases the volume of data alarmingly by each second. 2.2. Sources of big data Big data is a combination of different types of granular data. The applications that are the main sources of producing voluminous amounts of data, namely Internet of Things (IoT), self-quantified, multimedia, and social media data.
IoT data are generated by GPS devices, intelligent/smart cars, mobile computing devices, PDAs, mobile phones, intelligent clothing, alarms, window blinds, window sensors, lighting and heating fixtures, refrigerators, microwave units, washing machines, and so on (Hashem et al., 2016a). These data have different characteristics as big data because IoT data does not exhibit heterogeneity, variety, and redundancy. HP predicted that although the current amounts of IoT data are small, by the end of 2030, the number of sensors will reach 1 trillion; at that time, IoT data will become big data. Self-quantification data are generated by individuals by quantifying personal behavior. Data from wristbands used to monitor movements and exercise and sphygmomanometers utilized to measure blood pressure are examples of self-quantification data. This type of data helps build a connection between behavior and psychology (Chen et al., 2014). Multimedia data are generated from various sources, such as text, images, and audio, video, and graphic objects (Yousafzai et al., 2016a,b). The growth rate of such type of data is very fast. Each individual connected to the Internet generates multimedia data. Social media data are generated by Facebook, Twitter, LinkedIn, YouTube, Google-, Apple, Brands, Tumblr, Instagram, Flickr, Foursquare, WordPress, and so on. The use of social media causes a surge in data generation (Bello-Orgaz, Jung, & Camacho, 2016). Table 2 shows the growth rate of social media data. 3. State-of-the-art big data processing technologies and methods Big data architecture must perform in line with the organization’s supporting infrastructure. To date, all organizations do not use operational data (Khan et al., 2014a). Growing amounts of data originate from various sources that are not organized or straightforward, including data from machines or sensors and massive public and private data sources (McAfee et al., 2012). In the past, most companies were unable to either capture or store vast amounts of data (Khan et al., 2014a). Existing processing tools are also unable
I. Yaqoob et al. / International Journal of Information Management 36 (2016) 1231–1247
1235
Table 2 Data generated by social media (Khan et al., 2014a). Social media data
Data production scenario
YouTube (Youtube, 2014)
• Users upload 100 h of new videos every minute • More than 1 billion unique users open YouTube each month • Over 6 billion hours are spent watching videos each month; that is, almost an hour for every person on Earth and 50% more than last year
Facebook (Facebook, 2014)
• • • •
Twitter (Twitter, 2014)
• Over 645 million users • 175 million tweets per day
Google+ (plus, 2014)
• 1 billion accounts
Google (Google, 2014a)
• Receives over 2 million search queries per minute • Processes 25 petabytes of data each day
Pinterest (Pinterest, 2014)
• 70 million users by October 2013
Apple (Apple, 2014)
• Receives around 47,000 application downloads per minute
Tumblr (Tumblr, 2014)
• Blog owners publish 27,000 new posts per minute
Instagram (Instagram, 2014)
• Users share 40 million photos daily
Flickr (Flickr, 2014)
• Snappers upload 3125 new photos per minute
LinkedIn (LinkedIn, 2014)
• 2.1 million groups
Foursquare (Foursquare, 2014)
• Over 2000 check-ins • 571 new websites launched per minute
WordPress (Wordpress, 2014)
• Bloggers publish nearly 350 new blogs per minute
Receives 34,722 “likes” every minute 100 terabytes of data uploaded daily Currently 1.4 billion users Employs 70 languages
to produce complete results within a reasonable time frame. However, the implementation of new technologies for big data has contributed to performance improvement, innovation in business model products, and service and decision-making support (Carasso, 2012). The three major motives for big data technology implementation are to minimize hardware costs, check the value of big data before committing significant company resources, and reduce processing costs (Leavitt, 2013; Khan et al., 2014a). The following sub-sections examine various important processing technologies and methods to present a deeper insight into how big data can be handled in practice. 3.1. Batch based processing technologies Apache Hadoop allows to process large amounts of data. Many companies, such as SwiftKey (Amazon, 2014), 343 industry (Microsoft, 2014), redBus (Google, 2014b), Nokia (Cloudera, 2014), Alacer (Alacer, 2014) are using Apache Hadoop technology in different fields (e.g., business and commerce). A brief comparison of batch based processing tools based on strengths and weaknesses is presented in Table 3. Apache Hadoop is used to perform the processing of data intensive applications (Li et al., 2013). It uses a Map/Reduce programming model to process a large volume of data (Thusoo et al., 2009). Map/Reduce operates through the divide-and-conquer method by breaking down a problem into many small parts. Two types of nodes, namely, master and worker, exist in the Hadoop infrastructure. The master node is responsible to divide the task into smaller parts and distribute to the workers nodes. When all the worker nodes have performed their task, they send the small parts back to the master node. The master node then combines all the small parts to provide a solution (output) to the specified prob-
lem. Despite many advantages of Hadoop, such as distributed data processing, independent tasks, easy to handle partial failure, linear scaling, and simple programming model, there are many disadvantages of the Hadoop, such as restrictive programming model, joins of multiple data sets that make it tricky and slow, hard cluster management, single master node, and unobvious configuration of the nodes, to name a few. Skytree Server is utilized to process large amounts of data at high speed (Han et al., 2011). It is user-friendly and provides a command line interface where users can enter commands. Skytree Server has five uses, namely, recommendation system, anomaly outlier identification, clustering, market segmentation, and predictive analytics. The main focus of Skytree Server is real-time data analytics. It is optimized for the implementation of machine-learning algorithms on big data by using mechanisms that are remarkably faster than those of other platforms. It can handle relational databases, flat files, and structured and unstructured data. Despite many advantages of the Skytree Server, such as high-performance machine learning, advanced analytics, and fast data processing, however, high complexity is one of the limitations. Talend Open Studio provides a graphical environment to conduct an analysis for big data applications. With the aid of this platform, users can resolve big data problems even without extensive knowledge of Java language. The drag-and-drop feature to build up tasks makes this tool user-friendly. Visual programming appears challenging. Although visualization enables users to represent things in graphical form, it does not help the user fully understand the mechanism. Despite many advantages of Talend Open Studio, such as rich component sets, code conversion, connectivity with all the databases and high-level design, there are many disadvantages, such as system becomes slow after Talend Open Studio installation and small parallelism.
1236
I. Yaqoob et al. / International Journal of Information Management 36 (2016) 1231–1247
Table 3 Comparison of batch-based processing tools. Batch-Based Processing tools
Description
Strengths/Advantages
Weaknesses/Disadvantages
Hadoop
To perform the processing of data-intensive applications
– – – – – –
– Restrictive programming Model – Joins of multiple data set that make it tricky and slow – Hard cluster management – Single master node – Unobvious configuration of the nodes
Skytree Server
To process large amounts of data at high speed
– Fast processing of voluminous amounts of dataset in an accurate manner – Advanced analytics – High-performance machine learning
Talend Open Studio
To provide a graphical environment to conduct an analysis for big data applications
– – – –
Jaspersoft
To produce a report from database columns
– low price – Easy installation – Great functionality and efficiency
– Jaspersoft supports documentation errors – Jaspersoft customer service issues after extending the suit’s functionalities
Dryad
To improve the parallel and distributed programs and scale up the capability of processing from a small to a large number of nodes
– Easier programming – Compared with MapReduce more flexible – Allows multiple inputs and outputs
– Unsuitable for iterative and nesting program – Conversion of irregular computing into data flow graph is very difficult.
Pentaho
To generate reports from a large volume of structured and unstructured data
– Easy access to data – Fast reporting due to in-memory caching techniques – Detailed visualization – Seamless integration
– Inconsistent in the manner in which they work – Less advanced analytics as compared to Tableau
Tableau
To process large amounts of datasets
– Amazing data visualization – Low-cost solution to upgrade – Excellent mobile support
– Lack of predictive capabilities – Risky security – Change management issues
Karmasphere
To perform business analysis
– Rapidly pattern discovery – Parallel collaboration – Self-service
– High complexity
Jaspersoft is utilized to produce a report from database columns. It provides a scalable platform for big data analytics without needing to undergo ETL. It provides fast data visualization on several renowned storage platforms, including Mongo DB, Couch DB, Cassandra, Riak, Redis, and Hadoop (Wayner, 2012). One of the excellent properties of this tool is its capability to quickly explore big data without having to undergo the ETL process. It explores large amounts of data through HTML 5 visualization. The reports produced by Jaspersoft can be shared with anyone or can be embedded in a user’s application. Despite many advantages of Jaspersoft, such as low price, easy installation, and great functionality and efficiency, there are many disadvantages of this tool, such as Jaspersoft support documentation errors and Jaspersoft customer service issues after extending the suit’s functionalities. Dryad is based on data flow graph processing (Lee & Messerschmitt, 1987). Dryad consists of a cluster of computing nodes and a computer cluster used to run the programs in a distributed manner (Philip Chen & Zhang, 2014). A Dryad programmer can employ hundreds of machines with multiple processors even without having extensive knowledge of concurrent programming. Dryad employs a computational graph that consists of computational vertices and graph edges. Dryad generates a graph that helps the programmer deal with unexpected events during the computation. Dryad involves Map/Reduce and rela-
Distributed data Processing Independent tasks Easy to handle partial failure Linear scaling in ideal cases Simple programming Model
Rich component sets Code conversion Connectivity with all the databases High-level design
– High complexity
– System becomes slow after Talend Open Studio installation – Small parallelism
tional algebra; thus, it is complex. Dryad performs many functions, including graph generation, performance metrics, process scheduling process, visualization, failure handling, fault tolerance, and re-execution. Despite many advantages of the Dryad, such as easier programming, compared with Map Reduce more flexible, allows multiple inputs and outputs, there are many disadvantages of the Dryad programming model such as unsuitable for the iterative and nesting program and conversion of irregular computing into data flow graph which is very difficult. Pentaho is utilized to generate reports from a large volume of structured and unstructured data (Russom, 2011). It provides business services in the form of integration, visualization, and exploration of data through a big data analytics platform. Pentaho helps business users make a wise decision. The techniques embedded in Pentaho have the following properties: security, scalability, and accessibility. Pentaho is also linked with other tools, such as MongoDB and Cassandra (Zaslavsky, Perera, & Georgakopoulos, 2013). With the easy wizard approach of Pentaho, business users can extract valuable information to arrive at an information-driven decision. The graphic programming interface developed through Pentaho provides powerful tools, such as Kettle and Pentaho data integration, to process large amounts of data. Despite many advantages of Pentaho, such as easy access to data, fast reporting due to in-memory caching techniques, detailed visualization, and seam-
I. Yaqoob et al. / International Journal of Information Management 36 (2016) 1231–1247
1237
Table 4 Comparison of stream-based processing tools. Stream-Based Processing Tools
Description
Strengths/Advantages
Weaknesses/Disadvantages
Storm
To perform real-time processing of massive amounts of data
– Easy to use – Works with any programming language – Scalable – Fault-tolerant
– Many disadvantages in terms of reliability, performance, efficiency, and manageability
Splunk
To capture indexes and correlates real-time data with the aim of generating reports, alerts, and visualizations from the repositories To process unbounded data streams efficiently
– Many advantages from the security to business analytics to infrastructure monitoring
– High setup costs in terms of money – High complexity
– Scalable – Fault-tolerant – Pluggable platform
– Lack of the dynamic load balancing support
S4
SAP Hana
To provide real-time analysis of business processes
– High-performance analytics – Fast processing – (In-memory processing)
– Lack of support for all the ERP products – High cost – Difficult maintenance of the SAP Hana database
SQLstream s-Server
To analyze a large volume of services and log files data in real-time
– Low cost – Scalable for high-volume and high-velocity data – Low latency – Rich analytics
– High complexity
Apache Kafka
To manage large amounts of streaming data through in-memory analytics for decision-making
– – – – –
less integration, there are many disadvantages of Pentaho, such as Pentaho suite are inconsistent in the manner in which they work and less advanced analytics as compared to Tableau. Tableau is utilized to process large amounts of datasets. It employs Tableau Desktop, Tableau Public, and Tableau Server to process large datasets (Goranko, Kyrilov, & Shkatov, 2010). Tableau Desktop is utilized to visualize data. Tableau Server provides browser-based analytics, and Tableau Public creates interactive visuals. Tableau is also employed in Hadoop for caching purposes to help reduce the latency of a Hadoop cluster. Despite many advantages of the Tableau, such as amazing data visualization, low-cost solutions to upgrade, and excellent mobile support, there are many disadvantages, such as lack of predictive capabilities, risky security, and change management issues. Karmasphere is utilized for business analysis through a Hadoopbased platform. It provides analytic services to Hadoop clusters in a fast and collaborative manner (Shang et al., 2013). It helps to process big data applications and present workflows. It can extract valuable information from a large volume of data without the degradation of performance. Despite many advantages of the Karmasphere, such as rapidly patterns discovery, parallel collaboration, and self-service, however, high complexity is one of the major limitations.
3.2. Technologies based on stream processing In order to process large amounts of data in real time the following tools are available, namely Storm, S4, SQL Stream, Splunk, Apache Kafka, and SAP Hana (Philip Chen & Zhang, 2014). The details of these tools are discussed in this section. Table 4 presents the comparison of these tools. The storm is a distributed real-time computation system mainly designed for real-time processing. It is utilized to process streaming data in a real-time environment. The Storm cluster is comprised of
High throughput High efficiency Stable Scalable Fault-tolerant
– High-level API
master and worker nodes. These nodes are implemented through two types of daemons, namely nimbus and supervisor (Philip Chen & Zhang, 2014). The nimbus detects a failure during the computations and re-executes these tasks, whereas supervisor compiles the tasks assigned by the nimbus. Despite many advantages of the Storm, such as easy to use, works with any programming language, scalable and fault-tolerant, there are many disadvantages of the Storm in terms of reliability, performance, efficiency, and manageability. Splunk captures indexes and correlates real-time data with the aim of generating reports, alerts, and visualizations from the repositories. Moreover, Splunk is a real-time platform used to analyze machine-generated big data. It is designed to diagnose IT infrastructure problems and provide intelligence for business operations. Many renowned companies, such as Amazon, Senthub, and Heroku, utilize Splunk. In order to process and analyze the large amounts of machine-generation data, Splunk uses cloud computing technologies (Carasso, 2012). Splunk presents the results in many ways (e.g., graphs and alerts). Log files are examples of Splunk application. Despite many advantages of the Splunk from security to business analytics to infrastructure monitoring, there are some disadvantages of the Splunk, such as high setup cost in terms of money and high complexity. S4 is a general-purpose and pluggable platform utilized to process unbounded data streams efficiently (Keim et al., 2008). S4 is distributed, scalable, and partially fault-tolerant (Beyond the PC, 2016 Lakshmi & Redd, 2010). Moreover, S4 minimizes latency by using local memory in each processing node instead of I/O bottleneck. In addition, S4 is based on decentralized architecture, where all the nodes have same functionalities and responsibilities. Yahoo employs S4 to process large search queries and it has shown good performance (Chauhan, Chowdhury, & Makaroff, 2012; Neumeyer et al., 2010). Despite many advantages of the S4, such as scal-
1238
I. Yaqoob et al. / International Journal of Information Management 36 (2016) 1231–1247
able, fault-tolerant, and pluggable platform, however, lack of the dynamic load balancing support is one of the limitations. SAP Hana is an in-memory, column-oriented relational database management platform (Färber et al., 2012). It was developed by SAP SE. and previously known as SAP High-Performance Analytic Appliance. The best feature of SAP Hana platform is its database systems which are fundamentally different from the other databases available in the market. SAP Hana is specialized in different types of real-time analytics of big data, namely, data warehousing, predictive analysis, and text analysis. Moreover, SAP Hana is also specialized in three categories of the real-time applications namely core process accelerators, planning optimization apps, and sense &response apps. Despite many advantages of the SAP Hana, such as high-performance analytics, and in-memory processing, there are many disadvantages of SAP Hana, such as lack of support for all the ERP products, high cost and difficult maintenance of the SAP Hana database. SQLstream s-Server is also a platform to analyze a large volume of services and log files data in real-time. The tool helps in performing real-time analytics on large amounts of unstructured data. Moreover, it performs real-time collection, aggregation, integration, enrichment on the streaming data. The platform employs SQL language for its underlying operations. SQLstream s-Server works fast because it uses no database technology. Data are not stored on the disks but are processed in memory through streaming SQL queries. Despite many advantages of the SQLstream s-Server, such as low cost, scalable for high-volume and high-velocity data, low latency, and rich analytics, however, high complexity is one of the disadvantages. Apache Kafka is used to manage large amounts of streaming data through in-memory analytics for decision-making (Kreps & Narkhede Rao, 2011). The tool has four characteristics, namely, persistent messaging, disk structures, distributed processing, and high throughput. The extraction of valuable information from the web and activity data has recently become important. Activity data help evaluate human actions by analyzing the web page content, click list, and searching keywords. Moreover, Apache Kafka provides ad hoc analytic solutions by combining offline and online processing. Despite many advantages of the Apache Kafka, such as high throughput, high efficiency, stability, scalable, and fault-tolerant, however, high-level API is one of the major concerns. 3.3. Big data processing methods Currently, individuals and enterprises focus on how to rapidly extract valuable information from large amounts of data. The pro-
cessing methods utilized for big data are discussed in the following subsections and a brief overview of all the processing methods are discussed in Table 5. 3.3.1. Hashing For a large database structure, retrieving the block through an index search is not always feasible because an index search performs the entire search on the disk to find the desired data; this condition also makes the process costly. Hashing is an effective technique to retrieve data on the disk without using the index structure. The technique employs the hash function to compute the location of the desired data on the disk. Hash function h is a mapping function that takes a value as an input and converts this value to a key (k). The value of k indicates where the data are placed. Hash files store the data in a bucket format. A bucket usually stores one disk block. Static and dynamic hashing are the two types of hashing. In static hashing, the hash function always computes the same address when a search key value is provided. The number of buckets remains the same for this type of hashing. Insertion, deletion, and search are performed in static hashing. A problem arises when data quickly increase and buckets do not dynamically shrink. In dynamic hashing, the buckets are dynamically added and removed on demand. Dynamic hashing performs querying, insertion, deletion, and update functions. One advantage of hashing is speedy data reading. However, hashing is unsuitable when the data are organized in a certain order. Hashing is also unsuitable for queries that require a range of data. A hash function performs best when data are discrete and random. Despite many advantages of the hashing, such as rapid reading and writing, and high-speed query, there are many disadvantages such as high complexity, overflow chaining, and linear probing are some of the disadvantages. 3.3.2. Indexing To quickly locate data from voluminous amounts of the complex dataset, indexing approaches are used. The manual exploration on such records is impractical and only high throughput indexing approaches can meet the performance requirements of big data storage (Gani et al., 2016). In this context, various indexing procedures such as semantic indexing based approaches, file indexing, r-tree indexing, compact steiner tree, and bitmap indexing have been proposed (Gani et al., 2016). The only problem with most of these indexing approaches is high retrieval cost (Funaki et al., 2015). The development of efficient indexing techniques is a very popular research area at present. Several new indexing schemes, such as VegaIndexer (Zhong, Fang, & Zhao, 2013), sksOpen (Lu et al., 2013), CINTIA (Mavlyutov & Cudre-Mauroux, 2015), IndexedFCP
Table 5 Comparison of big data processing methods. Processing Methods
Description
Strengths/Advantages
Weaknesses/Disadvantages
Bloom Filter (Song et al., 2005)
To store hash values instead of data itself by using a bit array
– High space efficiency – High-speed query
– Misrecognition – Deletion
Hashing (Odom and Massey, 2003)
To transform data into shorter fixed-length numerical values
– Rapid reading and – writing – High-speed query
– – – –
Indexing (Bertino et al., 2012)
To quickly locate data from voluminous amounts of dataset
– – – –
Speed-up SELECT query Guarantee uniquely identifiable records
– Additional disk space to store the indexes – INSERT, UPDATE, and DELETE becomes Slower
Parallel computing (Richtárik and Takáˇc, 2012)
To decompose a problem and assign them to several separate process to be independently completed
– – – –
Fast processing Division of complex task Less power consumption
– Frequency scaling
Hard to find a sound Hash function. High complexity Overflow chaining Linear probing
I. Yaqoob et al. / International Journal of Information Management 36 (2016) 1231–1247
1239
Table 6 Comparison of different data mining tools (Chen et al., 2014). Data Mining Tools
Description
Usage Percentage
Excel Rapid-I RapidMiner R KNIME Weka/Pentaho
It provides powerful data processing and statistical analysis capabilities It is used for data mining, machine learning, and predictive analysis It is used for data mining/analysis and visualization It is used for data integration, data processing, data analysis, and data mining It provides functions, such as data processing, feature selection, classification, regression, clustering, association rule, and visualization
29.8% 26.7% 30.7% 21.8% 14.8%
Table 7 Comparison of different data analysis techniques. Big Data Analysis Techniques
Description
Usage in Some multidisciplinary Applications
Algorithms/Techniques
Available Tools
Data Mining (Wu et al., 2014)
To find consistent patterns and/or systematic relationships among variables
– Biomedicine – Healthcare
– – – – –
K-Mean Fuzzy C-Mean CLARA CLARANS BIRCH
– – – – –
Excel Rapid-I Rapidminer-R KNMINE Weka/Pentaho
Social Network Analysis (Otte & Rousseau, 2002; Sabater, 2002)
To view social relationships in terms of network theory
– Antropology – Social media
– – – –
PCA LTSA LLE Autoencoder
– – – –
Cytoscape Gephi Cuttlefish MeerKat
Web Mining (Gupta, 2014)
To discover usage patterns from large web repositories
– E-learning – Digital libraries – E-government
– LOGML – Apriori
– KXEN – LIONsolver – Dataiku
Machine Learning (Philip Chen & Zhang, 2014)
To allow computers to evolve behaviors based on empirical data
– Healthcare – Customer service
– Pattern recognition – Artificial neural Networks
– – – –
Visualization Approaches (Keim, 2002; Shen, Ma, & Eliassi-Rad, 2006)
To represent knowledge through the use of graphs
– Banking – Manufacturing Utilities
– FLOT – GGPLOT2
– Data wrapper – Highcharts JS – MAPBox
Optimization Methods (Cao & Sun, 2012; Sahimi & Hamzehpour, 2010; Yao et al., 2012)
To solve quantitative problems
– Social network science – Computational biology
[–] reduction – Parallelization – Simulated annealing – Quantum annealing – Swarm optimization
– Matlab
(Devikarubi & Rubi Arockiam, 2014), and pLSM (Wang et al., 2013) have been proposed for big data storage. Although the new indexing schemes are helpful for big data storage, these schemes are in their infant stage. 3.3.3. Bloom filter A bloom filter allows for space-efficient dataset storage at the cost of the probability of a false positive based on membership queries (Bloom, 1970). A bloom filter helps in performing a set membership tests and determining whether an element is a member of a particular set or not. False positives are possible, whereas false negatives are not. That is, a query returns either ‘inside set’ (could be wrong) or “definitely not in the set.” The bit vector is utilized as the data structure of bloom filters. Independent hash functions, including murmur, fnv series of hashes, and Jenkins hashes, are employed in bloom filters. Cassandra, Hadoop, Python–bloom filter, Sdroege bloom filter, and Squid, are implemented in murmur hashes, Jenkins and murmur, cryptographic hashes, fnv, and MD5, respectively. Despite many advantages of Bloom Filter, such as high space efficiency, and high-speed query, however, misrecognition, and deletion are some of the limitations. 3.3.4. Parallel computing Parallel computing helps utilize several resources at a time to complete a task. For big data, Hadoop provides the infrastructure for
Weka Scikit-Learn PyMc Shogun
parallel computing in a distributed manner. Hadoop helps improve processing power by sharing the same data file among multiple servers. A complex problem is divided into multiple parts through parallel computing. Each part is then processed concurrently. The different forms of parallel computing include bit and instruction levels and task parallelism. Task parallelism helps achieve high performance for large-scale datasets. In parallel computing, multi-core and multiprocessor computers consist of multiple processing elements within a single machine. By contrast, clusters, MPPs, and grids use multiple computers to work on the same task. Despite many advantages of the parallel computing, such as fast processing, a division of complex task, and less power consumption, however, frequency scaling is one of the disadvantages.
3.4. Summary Due to the rapid rate of increase in data production, big data technologies have gained much attention from IT communities. In this context, state-of-the-art processing technologies based on stream and batch processing have been discussed in detail. In addition, big data processing methods have also been discussed. To analyze the strengths and weaknesses among batch and stream-based processing technologies a brief comparison has been presented in Tables 3 and 4.
1240
I. Yaqoob et al. / International Journal of Information Management 36 (2016) 1231–1247
We conclude from the comparison that batch based processing technologies can be very efficient where data is collected, stored, processed and results are produced in batches. However, batch processing technologies have limitations in terms of resource utilizations and ad-hoc capabilities. Moreover, changes during system runtime may require recalculation of all the batches. In contrast stream based technologies mostly focus on the velocity of data and help to process data in a very short period of time. Furthermore, these technologies provide decision makers with the ability to adjust the contingencies based on events and trends developing in real time. Therefore, the decision to select the best data processing technology depends on the requirements of users. Moreover, we determined from the comparison that processing methods namely bloom filter, hashing, indexing, and parallel computing are facing many problems, such as misrecognition, deletion, high complexity, overflow chaining, the high cost of storing index files and frequency scaling respectively. We also analyze from the discussion of big data processing technologies that mostly focus on fault tolerance, speed, infrastructure, distributed processing, real-time computation, concurrent processing, visualization, in-memory computation and secure computation. In recent years, most of the processing technologies have been optimized to adopt the changes that happened due to different characteristics of big data. To some extent existing processing, technologies can deal with big data but not completely and efficiently. Some of the important research areas which need to be explored in future are highlighted as follows:
• Graph processing. Processing large graphs remain a challenge. The graph processing helps visualize the information but how to enable graph processing for various types of complex data efficiently is a future research area that needs to be explored. • Heterogeneous computing. Variety is one of the characteristics of big data. To deal with diverse types of data existing processing technologies need to be optimized. Extensive research and field expertise are required to enable heterogeneity support in existing processing technology. • Hybrid computing. Different data sets require different processing technologies based on stream and batch computing. A hybrid architecture is required that can consider the characteristics of big data. A mixture of stream and batch based processing can be an efficient solution to process diverse types of data. • In memory processing. As the volume of data has increased so storing it on systems based on disk and relational databases and then load it in memory causes some delay in query response time. The processing of large amounts of data stored in an in-memory database is a future research area that needs to be explored.
4. Big data analysis techniques Extraordinary big data techniques are required to efficiently analyze large amounts of data within a limited time period. Currently, only a few techniques are applicable to be applied on analysis purposes. Wal-Mart, for example, employs a statistical method and machine learning techniques to explore hidden patterns in large amounts of data (Philip Chen & Zhang, 2014). The exploration of hidden patterns in data helps to increase competitiveness and generate pricing strategies. Taobao employs stream data mining techniques on its website. These techniques show its significance in decision making (Lin, 2005). The following subsections examine various important analysis techniques. Moreover, a comparison of big data analysis techniques is presented in Table 7.
4.1. Data mining Data mining techniques are used to summarizing data into meaningful information. The techniques include cluster analysis, association rule of learning, classification, and regression. Data mining employs machine learning and statistical methods to extract information. New big data mining techniques are required because the data rate is increasing rapidly. The existing method of information extraction from large amounts of data must be extended to utilize traditional data mining algorithms for big data (Bezdek, 1981; Chen, Chen, & Lu, 2011; Zhou et al., 2012). The algorithms (Kim, 2009) of hierarchical clustering, k-means, fuzzy c-means, clustering large applications, CLARANS, and balanced iterative reducing and clustering using hierarchies should be extended for the future use of big data clustering; otherwise, these algorithms would no longer be applicable in the future. The tools employed for data mining purposes, as suggested by KDNuggets (Chen et al., 2014), are discussed in Table 6.
4.2. Web mining Web mining is a technique employed to discover a pattern from large web repositories (Tracy, 2010). Web mining reveals unknown knowledge about a website and users to perform data analysis. The technique helps evaluate the effectiveness of a specific website. Web mining is classified into two different types as follows. • Web content mining https://en.wikipedia.org/wiki/Web mining: It helps to extract useful information from the web content. The content consists of audio, video, text, and images. “The heterogeneity and lack of structure that permits much of the everexpanding information sources on the World Wide Web, such as hypertext documents, make the automated discovery, organization, and search and indexing tools of the Internet and the World Wide Web (e.g., Lycos, Alta Vista, WebCrawler, ALIWEB, and MetaCrawler) provide comfort to users. However, these tools neither provide structural information nor categorize, filter, or interpret documents.” These factors have prompted researchers to develop more intelligent tools for information retrieval (e.g., intelligent web agents) and extend database and data mining techniques to provide a higher level of organization for semi-structured data available on the web (Khan, Ilyas, & Anwar, 2009). The agent-based approach to web mining involves the development of sophisticated AI systems that can act autonomously or semi-autonomously on the behalf of a particular user to discover and organize web-based information (Xu & Zhang Li, 2011). • Web structure mining: Web structure mining is employed to analyze the node and connection structure of a website through graph theory. Web structure mining is further divided into two categories: (1) pattern extraction from hyperlinks within a website and (2) analysis of a tree-like structure to describe HTML or XML tags (Baeza-Yates & Boldi, 2010). 4.3. Visualization methods Visualization methods are utilized to create tables and diagrams to understand data. Big data visualization is more difficult than traditional small data visualization because of the complexity of the four vs (Geng et al., 2012; Heer et al., 2008; Keim et al., 2008). For big data visualization, several researchers have applied a batch mode software to obtain the highest data resolution in a parallel manner (Ma & Parker, 2001). Data presentation is important in dealing with big data. In (Thompson et al., 2011), the authors efficiently visualized large-scale data.
I. Yaqoob et al. / International Journal of Information Management 36 (2016) 1231–1247
4.4. Machine learning Machine learning allows computers to evolve behaviors based on empirical data (Philip Chen & Zhang, 2014). Existing machine learning techniques, both supervised and unsupervised, are required to scale up to cope with big data. Frameworks, such as Map/Reduce and DryadLINQ, can scale up machine learning. The machine learning algorithms for big data are still in their infancy stage and suffer from scalability problems. Moreover, artificial neural network (ANN) is utilized in pattern recognition, adaptive control, analysis, and others (Hinton, Osindero, & Teh, 2006). ANN is based on statistical estimations and control theory (Liu et al., 2011). The complex learning process of ANN over big data is timeconsuming. ANN is often used to fulfill the needs of large-scale datasets but results in poor performance and extra time consumption (Shibata & Ikeda., 2009; Zhou et al., 2012). 4.5. Optimization methods Optimization methods are utilized to solve quantifiable problems. These method are used in multidisciplinary fields. In order to address global optimization problems different strategies, namely simulated annealing, quantum annealing, swarm optimization, and genetic algorithms are used (Li & Yao, 2012; Sahimi & Hamzehpour, 2010; Yang, Tang, & Yao, 2008). These strategies are highly efficient because they exhibit parallelism. These techniques provide optimization but have high complexity and are time-consuming. These strategies need to be scaled up in a real-time environment to process big data applications. 4.6. Social network analysis The social network analysis (SNA) technique is employed to view social relationships in social network theory. SNA has gained much significance in social and cloud computing. SNA exhibits good performance when the amounts of data are not extremely large. However, SNA exhibits poor performance when the data are dimensional. High-dimensional data are difficult to address in current research (Bingham & Mannila, 2001). Recent techniques attempt to deal with high dimensional data are discussed in Leavitt ´ (2013); Lu, Plataniotis, & Venetsanopoulos (2011); Radovanovic, Nanopoulos, & Ivanovic´ (2010). Some of the techniques that reduce data dimensionality are PCA, LTSA, LLE, and autoencoder (Hinton & Salakhutdinov, 2006; Lee & Verleysen, 2007). 4.7. Summary With the development of information technologies, data is being generated at a rapid rate. Consequently, this fast growth rate of data has created enormous challenges related to big data analysis. In this context, we discussed comprehensively state of the art big data analysis techniques, such as data mining, web mining, machine learning, social network analysis, visualization, and optimization methods. Moreover, we compared the analysis techniques as shown in Table 7 . The comparison highlights the available algorithms, tools and also demonstrates suitable analysis techniques for specific big data applications. In addition, we analyzed from the comparison that most of the current analysis techniques can work well for structured data, however, most of the today’s data are in unstructured and/or semi-structured formats which create different challenges. Moreover, compute intensive data or big data demands a high performance and scalable mining algorithms to perform analysis in a real-time environment. Although promising progress has been made in the area of big data analysis (structure), yet much remains to be done. The IDC survey indicates that unstructured data is growing at a tremen-
1241
dous rate and approximately 80% generated data is unstructured (Chakraborty, 2014). However, the available solutions do not have enough capability to analyze the unstructured data accurately and present the insights in an understandable manner. A lot of the challenges in this space rising due to the following reasons: most of the machine learning algorithms are designed to analyze the numerical data, flexibility of the natural language (the e.g. same sentence can be used to convey the different meanings) which gets very problematic. Moreover, unstructured data poses several problems, such as dialects, jargon, misspellings, short forms, acronyms, colloquialism, grammatical complexities, and mixing one or more languages in the same text, to name a few (Chakraborty, 2014). These problems hinder accurate analysis of unstructured data. Therefore, currently, researchers are focusing on optimization within existing techniques to handle big unstructured data analysis problems efficiently. Moreover, the complexity factor in big data motivates the researchers to develop several new powerful analysis techniques and tools that can provide insights into large-scale data or big data in an efficient way. Some of the important research areas which need to be explored in future are highlighted as follows: • Distributed mining. Most of the analysis techniques do not work in a parallel way. To make distributed versions of existing analysis methods requires a lot of research and practical experience. Distributed methods can help analyze large amounts of distributed data in an efficient way. • Scalable machine learning. To sift valuable information from the flood of data requires scalable machine learning algorithms. The existing machine learning algorithms were not designed to deal with huge amounts of data. Hence, scalable machine learning algorithms are required to cope with data scalability issues. • Time Variable data. Data is changing over time so it is important that big data analysis techniques, such as data mining, machine learning must be able to adopt and detect these changes. Stream mining field is an example of real-time data mining. • Mining from Sparse data. Sparse is one of the features of big data applications. To draw some reliable conclusion from sparse data is very difficult. This feature raises data dimension issues, in some scenarios where data is in dimensional space and does not show clear trends and distribution which makes difficult to apply mining techniques. Further research is required to fix this issue. 5. Case studies on big data technologies This section presents the credible case studies that are provided by the different companies. The aim is to show that how the deployment of different big data technologies facilitated the businesses to meet their objectives. Moreover, we summarize these case studies in Table 8. 5.1. AppNexus AppNexus has become a real-time Internet advertising company that provides a trading solution to a lot of inventive companies for being introduced efficiently and effectively. As estimated in 2012, it became a mostly accessed web source after Google as it dealt with 16 billion ads per day. In 2011, the servers were overburdened with a 2000% growth of data. From data generated for more than 17 billion received ad requests about 10 terabytes are processed by AppNexus data pipeline per day and analytical reports are generated. This scale is rapidly growing and creates challenges to handle and process such amounts of data so there was a need to horizontally scale the data management technology. AppNexus engineers preferably adopted Hadoop with HBase and Hive in their ecosystem to manage such volume and experienced high performance in
1242
I. Yaqoob et al. / International Journal of Information Management 36 (2016) 1231–1247
Table 8 Summary of organization case studies from different vendors. Case study
Business needs
Solution
Assessment
Reference
AppNexus
To manage the voluminous amounts of data Business intelligence
Hadoop
Success
Appnexus (2014)
BigQuery
Success
Peter (2016)
Safari Books Online
Table 9 Overview of big data opportunities (Mohanty, Jagadeesh, & Srivatsa, 2013). Organizations
Volume
Velocity
Variety
Dark Data
Big Data Value
Communication media Government Banking Transportation Utilities Healthcare Education Insurance Manufacturing Natural resources
High High High Medium Medium High High High High High
High Medium High Medium Medium Medium Medium Medium High High
High High Medium Medium Medium High High Medium High High
Medium High Medium High Medium Medium High Medium Medium Medium
High High High Medium Medium High High High High High
Table 10 List of emerging research technologies. Future Technologies
Potentially Marginalized Technologies
Brief Description
References
Cloud computing
– Virtualization – Software-defined networking
Provides on demand data storage service.
Granular computing
– Discretization – Type-2 fuzzy sets and systems
Software-defined storage
– Storage Virtualization – Storage resource Management
Rouse (2014) and Akhunzada et al. (2015)
Stream computing
– Object-oriented programming – Smalltalk library standard
Divides data into smaller modules, and aggregate all the modules after completion of the specific task. Separates the hardware from the software and makes flexible data processing. Delivers real-time analytic processing on constantly changing data in motion.
Hashem et al. (2015), Abolfazli et al. (2015), Yousafzai et al. (2016a,b) Pedrycz (2013)
Artificial intelligence
– – – –
Help to make intelligent devices.
Charniak et al. (2014)
Parallel computing
– Distributed computing
Makes process execution fast.
Darriba et al. (2012)
Bio-inspired computing
– Immune systems – Lindermayer systems – Membrane computers
Castillo and Melin (2012)
Fourth generation optical disks
– 3D optical data storage. – Holographic data storage
Provides high-efficiency by incorporating several new factors such as robustness, scalability and flexibility in the computational tools. Provides efficient data storage.
Quantum computing
– Electronic computing – Optical computing, – Quantum clock
Finch et al. (2014)
Smart grid computing
– Image processing
Optical computing
– Laser – Transistor
Quantum cryptography
– Public-key encryption – Signature schemes
Much faster computing, for some kinds of problems, chemical modeling, new materials with programmed properties, Hypothetical of high-temperature superconductivity and superfluidity. Provides access to resources (systems, data, applications, and services) via the Internet. Allows a higher bandwidth than the electrons used in conventional computers. Helps in performing cryptographic tasks.
Semantic web
– SPARQL – Notation3 – Web ontology language
Enables users to find, share and combine information more easily.
Berners-Lee and Hendler (2001)
Edge Computing
– Fog computing – Mobile edge computing – Cloudlet
Facilitates the users by bringing computation down towards the edge of the network.
Ahmed and Ahmed (2016), Jararweh et al. (2016) and Satyanarayanan et al. (2015)
Optimization Neural networks Big data mining IoT mining
Bayoumi et al. (2009)
Hamann et al. (2006)
Fang et al. (2012)
Woods and Naughton (2012)
Gilbert and Weinstein (2014)
I. Yaqoob et al. / International Journal of Information Management 36 (2016) 1231–1247
scalability and cost effectiveness. AppNexus is expecting to have 3 times more than existing 1.2 petabytes data clusters within a year and predicts their system capability for next two years. 5.2. Safari books online Safari Books Online has a large customer base that is increasingly accessed from mobile devices and desktop computers. The growing access of the library motivated the Safari Books Online to improve the service and get some profit by analyzing the massive amounts of data. With the aim of improving the service and increasing the profitability, Safari Online Book was required to know the trends, such as top users, top titles, and connecting the dots for sales inquiries. The usage data of safari books online was too massive (in the billions of records range). The analytics tools, such as Omniture were unable to query and explore record level data in real-time. Moreover, the SQL-like querying had to be done on smaller chunks of the data and was labor intensive and slow. Safari Books Online also played with Hadoop but due to a lot of resources maintenance problem, ended up to use it in future projects. The use of Google BigQuery enabled the Safari Books online to generate the meaningful knowledge out of vast amounts of data and helped in improving the service and getting more profit. 6. Big data opportunities and challenges Opportunities entail challenges. Big data has provided several opportunities in data analytics. These opportunities are discussed in this section. 6.1. Data analytics Big data analytics helps social media, private agencies, and government agencies explore the hidden behavioral patterns of people; it is predictive for healthcare departments (Raghupathi & Raghupathi, 2014). Data analytics helps acquire knowledge about market trends. Product recommendations are provided after analyzing seasonal variations. Analytics of data helps detect fraudulent cases. For promotion purposes, analytics can help in strategically placing advertisement (Aissi, Malu, & Srinivasan, 2002). Moreover, big data predictive analytics enables people to make a valuable decision with regard to the understanding of customers and products. In addition, data analytics helps identify potential risks and opportunities for a company. The health sector can expect an improvement by revealing hidden patterns from large amounts of healthcare data. The real time analysis of healthcare data can result in improving medical services to the patients. Moreover, a patient’s response to a drug therapy may also help pharmaceutical companies agree on drug development. In fact, a large data analysis has the power to help pharmaceutical companies personalize a medicine for each patient to ensure better and faster recovery. On the other hand, the web has generated an explosion of content, which consists of overflowing text, audio, images, and videos. Many possible processes can be implemented to optimize, classify, and organize content with the technologies for large amounts of data. These processes allow people to acquire relevant and contextual information through a unified access system. In online stock trading, thousands of transactions take place within a very short interval of time. These transactions occur through human intervention and by algorithmbased high-frequency trade resulting from automated transactions. A player in the stock market may be unable to identify the maximum activity in a particular stock at a particular time and situation. A simple software or hardware cannot handle or manage many tasks; hence, big data management systems are required. Big data management systems are of great value that can monitor and report
1243
the exact information a user wishes to analyze. City traffic is another area where data can be used positively. Traffic flow over time, season and other parameters that could help planners reduce congestion and provide routes for regular traffic flow can be analyzed in real time. In a broader perspective, data from GPS devices, cell phones, computers, and medical devices in developing countries could be comprehensively analyzed to provide better services to the people (Niyogi, 2004). Retailers can take advantage from large amounts of data through proper analysis to plan their product range, promotions, pricing, and interactions with consumers; consequently, improved customer experience can be achieved. Furthermore, banks and financial institutions can also get benefits in terms of managing liquidity risk effectively. One of the reasons many banks are unable to recognize the omens and perhaps suffering from huge losses is the lack of business intelligence in the analysis of the liquidity risk. McKinsey’s analysis (summarized in Table 9.) indicates that big data has the potential to add value across all industry segments. Companies that are likely to benefit the most from big data analytics include (Mohanty, Jagadeesh, & Srivatsa, 2013). 6.2. Open research challenges for big data Big data involves several open research challenges. Some of them are discussed as follows. 6.2.1. NoSql databases NoSQL is based on the concept that relational databases are not the right database solution for all problems (Khare, 2014). The traditional relational database management system (RDBMS) lacks expandability and scalability and does not meet the requirement of high-quality performance for large amounts of data. Although NoSQL databases have shown several advantages, such as, flexibility, open source, cost effective, and scalability, these databases are also suffering from many problems which arise because of large amounts of data. These problems are namely, lack of maturity and consistency related to performance. In addition, NoSQL databases also do not deal well with analytics. 6.2.2. High-performance computing systems In order to perform real-time data processing, it is necessary to combine the power of high-performance computing infrastructure with highly efficient systems to solve scientifically, engineering and data analysis problems regardless of large scale data. The highperformance computing solutions empower innovation at any scale, building on HP’s innovative purpose-built HPC systems and technologies. But the major problem that occurs while designing a high-performance technology is the complication of computational science and engineering codes. This complication provides many opportunities to the researcher to explore this area. 6.2.3. Big data indexing schemes The retrieval of required information on the time when large amounts of data are stored in a distributed manner has become very challenging. Several new indexing algorithms and techniques are required that can help in retrieving the required information on time. Existing algorithms were designed for retrieving data from limited amounts of stored data therefore, these algorithms are unable to retrieve the required information on time in case of big data storage. Although several research efforts have been carried out to address this problem, these efforts are in its infant stage (Chen, 2013; Funaki et al., 2015; Lu et al., 2013). Additional research is required to design efficient data retrieval algorithms from large amounts of data.
1244
I. Yaqoob et al. / International Journal of Information Management 36 (2016) 1231–1247
6.2.4. Analytics The discovery of meaningful data patterns can enable the enterprises to become smarter in terms of production and better at making a prediction. However, finding patterns of interests from vast amounts of data has become very challenging due to massiveness, complexity and dynamicity of the data. Although existing analytics tools have the capabilities to discover the meaningful patterns, less accuracy of results one of the key problems. Thus, in future several powerful analytics tools need to be designed with the aim of solving the challenges of analyzing massive, dynamic, and complex data (Shi et al., 2008). 6.2.5. Data quality Although data analysis can be performed and placed in the proper context for the audience that consumes the information, the value of data for decision-making purposes may be affected if data quality is inaccurate (Tracy, 2010). Maintaining the quality of data is a challenging task in all types of data analysis. Only data quality assurance is proven to be valuable for data visualization. Companies need proper data governance, which ensures clean data, to address the data quality issue. Further research on data quality management issues is required (Kwon, Lee, & Shin, 2014). 6.2.6. Visualization Visualization refers to represent knowledge by using graphs. Information abstracted in a schematic manner is valuable for data analysis and includes attributes for the units of information. Due to fast growth rate and complexity, conducting visualization has difficulties in most of the big data applications. The existing tools for big data visualization no longer exhibit ideal performance in functionality and quick response time (Wang, Wang, & Alexander, 2015). Most big data visualization tools exhibit poor performance in functionality, response time, and scalability. Instead of adopting obsolete visualization tools, rethinking how to visualize big data in a different manner is necessary. 6.2.7. Big data security To solve big data problems while strengthening the security is one of the key concerns for the enterprises. In some scenarios, where data is generated at tremendous speed, identification of the malicious data in a timely manner becomes very difficult. Most of existing security techniques are based on a static dataset while data is changing dynamically (Siddiqa et al., 2016; Sookhak et al., 2014). Therefore, traditional security mechanisms are required to incorporate the new characteristics of big data, such as data pattern, and variation of data with the aim of ensuring the real-time protection. Thus, it has become very challenging due to the complexity and real-time processing demands of streaming data to design and implement new security mechanisms that can protect the data without causing further delay in the processing. 7. Emerging technologies for big data management Big data technologies are still in their infancy. To date, many key research problems related to fields, namely cloud computing, grid computing, stream computing, parallel computing, granular computing, software-defined storage, Bio-inspired computing, quantum computing, semantic web, optical computing, smart grid computing, quantum cryptography, and edge computing, are not investigated completely. New technological fields help to solve many research challenges associated with Big Data. But these new fields are not established enough to completely deal with large amounts of data. A list of future technologies is presented in Table 10 . The discussed technologies in the following table are
highly practical and, successful deployment of these technologies can help to solve many big data problems. 8. Conclusions This paper has surveyed the domain of big data and examines the different techniques utilized for processing and analytics. It analyzes the origin of big data by using two paradigms namely, structuralism and functionalism. It highlights the deviations in applications on the basis of significant parameters and time span. It discusses the current trends for helping to understand the rapid increase in big data. It categorizes the management tools based on stream and batch data processing. Different parameters are used to compare the performance of the tools according to its category. It also discusses different processing methods and data analytic techniques. Some of the reported case studies on the deployment of big data technologies are also provided. Big data entails many significant challenges and benefits. Additional research on these sub-fields is necessary to solve these problems in the future. For this purpose, several open research challenges and opportunities brought about by big data are discussed. This study concludes that current tools and techniques accomplish data processing in a deficient way. Moreover, capabilities of most of the recent technologies in terms of big data processing and analytics services are very limited. The utilization of existing tools for big data processing results in efficiency loss and also raises many complications. Therefore, current technologies are unable to solve big data problems completely. New storage, processing, analytics, and efficient data-intensive technologies from the software to the hardware perspective are imminently required. The existing techniques recommend some new big data technologies as discussed in this paper. Conflict of interest The authors declare that they have no conflict of interest. Acknowledgments This work is fully funded by Bright Spark Unit, University of Malaya, Malaysia and partially funded by Malaysian Ministry of Higher Education under the University of Malaya High Impact Research Grant UM.C/625/1/HIR/MOE/FCSIT/03 and RP012C-13AFR. References Abolfazli, S., Sanaei, Z., Ahmed, E., Gani, A., & Buyya, R. (2014). Cloud-based augmentation for mobile devices: motivation, taxonomies, and open challenges. IEEE Communications Surveys & Tutorials, 16(1), 337–368. Abolfazli, Saeid, Zohreh, Sanaei, Gani, Abdullah, Xia, Feng, T. Yang, Laurence. (2014). Rich Mobile Applications: Genesis, taxonomy, and open issues, Journal of Network and Computer Applications,40, April 2014, Pages 345–362, ISSN 1084–8045, doi: 10.1016/j.jnca.2013.09.009. Abolfazli, S., Sanaei, Z., Alizadeh, M., Gani, A., Xia, F. (2014). An experimental analysis on cloud-based mobile augmentation in mobile cloud computing, in IEEE Transactions on Consumer Electronics, vol. 60, no. 1, pp. 146–154, February 2014. doi: 10.1109/TCE.2014.6780937. Abolfazli, S., Sanaei, Z., Tabassi, A., Rosen, S., Gani, A., & Khan, S. U. (2015). Cloud adoption in Malaysia: Trends, opportunities, and challenges Cloud Computing. IEEE, 1, 60–68. Ahmed, A., & Ahmed, E. (2016). A Survey on Mobile Edge Computing, in 10th international conference on intelligents systems and control. IEEE India, 1–8. Aissi, S., Malu, P., & Srinivasan, K. (2002). E-business process modeling: The next big step. Computer, 35(5), 55–62. Akhunzada, A., et al. (2015). Securing software defined networks: Taxonomy, requirements, and open issues. Communications Magazine, IEEE, 53(4), 36–44. Alacer. (2014). Case studies: Big data.. Available from: http://www.alacergroup. com/practice-category/big-data/casestudies/ Accessed 24.07.14 Amazon. (2014). AWS case study: SwiftKey.. Available from: http://aws.amazon. com/solutions/case-studies/big-data/ Accessed 3.08.14
I. Yaqoob et al. / International Journal of Information Management 36 (2016) 1231–1247 Apple. (2014). Usage statistics. Available from: http://www.statisticbrain.com/ apple-computer-company-statistics/ Accessed 21.04.14 Appnexus. (2014). Case study. Available from: http://techblog.appnexus.com/2012/ a-hadoop-success-story-horizontally-scaling-our-data-pipeline/ Accessed 23.08.14 Baeza-Yates, R., & Boldi, P. (2010). Web structure mining, in advanced techniques in web intelligence-I. pp. 113–142. Springer. Bayoumi, A., Chu, M., Hanafy, Y., Harrell, P., & Refai-Ahmed, G. (2009). Scientific and engineering computing using ati stream technology. Computing in Science & Engineering, 11(6), 92–97. Begoli, E., & Horey, J. (2012). Design principles for effective knowledge discovery from big data. Software architecture (WICSA) and european conference on software architecture (ECSA), 2012 joint working IEEE/IFIP conference on,. EEE Bello-Orgaz, G., Jung, J. J., & Camacho, D. (2016). Social big data: Recent achievements and new challenges. Information Fusion, 28, 45–59. Berners-Lee, T., & Hendler, J. (2001). Publishing on the semantic web. Nature, 410(6832), 1023–1024. Bertino, E., et al. (2012). Indexing techniques for advanced database systems. Springer Publishing Company, Incorporated. Beyond the PC. Special Report on Personal Technology. Bezdek, J. C. (1981). Pattern recognition with fuzzy objective function algorithms. Kluwer Academic Publishers. Bingham, E., & Mannila, H. (2001). Random projection in dimensionality reduction: Applications to image and text data. Proceedings of the seventh ACM SIGKDD international conference on Knowledge discovery and data mining,. ACM. Bloom, B. H. (1970). Space/time trade-offs in hash coding with allowable errors. Communications of the ACM, 13(7), 422–426. Bryant, R., Katz, R. H., & Lazowska, E. D. (2008). Big-data computing: Creating revolutionary breakthroughs in commerce, science and society. Burrell, G., & Morgan, G. (1997). . pp. 26. Sociological paradigms and organisational analysis (Vol. 248) London: Heinemann. Cao, Y., & Sun, D. (2012). A parallel computing framework for large-scale air traffic flow optimization. Intelligent Transportation Systems, IEEE Transactions on, 13(4), 1855–1864. Carasso, D. (2012). Exploring splunk. New York, NY: CITO Research. Castillo, O., & Melin, P. (2012). Optimization of type-2 fuzzy systems based on bio-inspired methods: A concise review. Information Sciences, 205, 1–19. Chakraborty, G. (2014). Analysis of unstructured data: Applications of text analytics and sentiment mining. SAS global forum. Charniak, E., Riesbeck, C. K., McDermott, D. V., & Meehan, J. R. (2014). Artificial intelligence programming. Psychology Press. Chauhan, J., Chowdhury, S. A., & Makaroff, D. (2012). Performance evaluation of yahoo! S4: a first look. P2P, parallel, grid, cloud and internet computing (3PGCIC), seventh international conference on,. IEEE. Chen, L., Chen, C. P., & Lu, M. (2011). A multiple-kernel fuzzy c-means algorithm for image segmentation. Systems, Man, and Cybernetics, Part B: Cybernetics, IEEE Transactions on, 41(5), 1263–1274. Chen, M., Mao, S., & Liu, Y. (2014). Big data: A survey. Mobile Networks and Applications, 19(2), 171–209. Chen, D. (2013). A real time index model for big data based on DC-Tree. Advanced cloud and big data (CBD), 2013 international conference on,. IEEE. Cloudera. (2014). Using big data to bridge the virtual & physical worlds.. Available from: http://www.cloudera.com/content/dam/cloudera/documents/ClouderaNokia-case-study-final.pdf Accessed 23.07.14 Cooper, A. (2012). What is analytics? Definition and essential characteristics. CETIS Analytics Series, 1(5), 1–10. Darriba, D., Taboada, G. L., Doallo, R., & Posada, D. (2012). jModelTest 2: more models, new heuristics and parallel computing. Nature Methods, 9(8), 772. Devikarubi, R., & Rubi Arockiam, R. D. L. (2014). IndexedFCP—An index based approach to identify frequent contiguous patterns (FCP) in big data. Intelligent computing applications (ICICA), 2014 international conference on,. IEEE. Färber, F., Cha, S. K., Primsch, J., Bornhövd, C., Sigg, S., & Lehner, W. (2012). SAP HANA database: data management for modern business applications. ACM Sigmod Record, 40(4), 45–51. Facebook. (2014). Statistics of Facebook data.. Available from: http://www. statisticbrain.com/facebook-statistics/ Accessed 28.04.14 Fang, X., Misra, S., Xue, G., & Yang, D. (2012). Smart grid—The new and improved power grid: A survey. IEEE communications surveys & tutorials, 14(4), 944–980. Finch, P. E., Frahm, H., Lewerenz, M., Milsted, A., & Osborne, T. J. (2014). Quantum phases of a chain of strongly interacting anyons. Physical Review B, 90(8), 081111. Flickr. (2014). Statistics of Flickr data.. Available from: https://www.quantcast.com/ flickr.com Accessed 21.03.14 Foursquare. (2014). Statistics of Foursquare data.. Available from: https://www. foursquare.org/about/stats Accessed 21.03.14 Funaki, K., Hochin, T., Nomiya, H., & Nakanishi, H. (2015). Evaluation of Parallel Indexing Scheme for Big Data. In Applied Computing and Information Technology/2nd International Conference on Computational Science and Intelligence (ACIT-CSI), 2015 3rd International Conference on (pp. 148–153). IEEE. Gandomi, A., & Haider, M. (2015). Beyond the hype: Big data concepts, methods, and analytics. International Journal of Information Management, 35(2), 137–144. Gani, A., Siddiqa, A., Shamshirband, S., & Hanum, F. (2016). A survey on indexing techniques for big data: taxonomy and performance evaluation. Knowledge and Information Systems, 46(2), 241–284. Gantz, J., & Reinsel, D. (2011). Extracting value from chaos. IDC iview, 1–12.
1245
Garlasu, D., Sandulescu, V., Halcu, I., Neculoiu, G., Grigoriu, O., Marinescu, M., et al. (2013). A big data implementation based on Grid computing. In Roedunet International Conference (RoEduNet), 2013 11th (pp. 1–4). IEEE. Geng, B., Li, Y., Tao, D., Wang, M., Zha, Z. J., & Xu, C. (2012). Parallel lasso for large-scale video concept detection. IEEE Transactions on Multimedia, 14(1), 55–65. Gilbert, G., & Weinstein, Y. S. (2014). Introduction to Special Issue on quantum cryptography. Quantum Information Processing, 13(1), 1–4. Google. (2014a). Statistics of Google data. Available from: http://www. statisticbrain.com/google-searches/ Accessed 17.03.14 Google. (2014b). Case study: How redBus uses BigQuery to master big data.. Available from: https://developers.google.com/bigquery/case-studies/ Accessed 22.07.14 Goranko, V., Kyrilov, A., & Shkatov, D. (2010). Tableau tool for testing satisfiability in ltl: Implementation and experimental analysis. Electronic Notes in Theoretical Computer Science, 262, 113–125. Gupta, R. (2014). Journey from Data Mining to Web Mining to Big Data. arXiv preprint arXiv:1404.4140. Hamann, H. F., et al. (2006). Ultra-high-density phase-change storage and memory. Nature Materials, 5(5), 383–387. Han, J., Haihong, E., Le, G., & Du, J. (2011). Survey on NoSQL database. In Pervasive computing and applications (ICPCA), 2011 6th international conference on (pp. 363-366). IEEE. Hashem, I. A. T., Yaqoob, I., Anuar, N. B., Mokhtar, S., Gani, A., & Khan, S. U. (2015). The rise of “big data” on cloud computing: Review and open research issues, Information Systems 47, 98–115. Hashem, I. A. T., Chang, V., Anuar, N. B., Adewole, K., Yaqoob, I., Gani, A., et al. (2016). The role of big data in smart city. International Journal of Information Management, 36(5), 748–758. Heer, J., Mackinlay, J., Stolte, C., & Agrawala, M. (2008). Graphical histories for visualization: Supporting analysis, communication, and evaluation. IEEE transactions on visualization and computer graphics, 14(6), 1189–1196. Hinton, G. E., & Salakhutdinov, R. R. (2006). Reducing the dimensionality of data with neural networks. Science, 313(5786), 504–507. Hinton, G., Osindero, S., & Teh, Y.-W. (2006). A fast learning algorithm for deep belief nets. Neural Computation, 18(7), 1527–1554. Instagram. (2014). Statistics of Instagram data.. Available from: http://nitrogr.am/ instagram-statistics/ Accessed 27.02.14 Jararweh, Y., Doulat, A., AlQudah, O., Ahmed, E., Al-Ayyoub, M., & Benkhelifa, E. The Future of Mobile Cloud Computing: Integrating Cloudlets and Mobile Edge Computing. ˙ Kacprzyk, J., & Zadrozny, S. (2001). Computing with words in intelligent database querying: Standalone and Internet-based applications. Information Sciences, 134(1), 71–109. Keim, D. A., Mansmann, F., Schneidewind, J., Thomas, J., & Ziegler, H. (2008). Visual analytics: Scope and challenges. In Visual data mining. pp. 76–90. Springer Berlin Heidelberg. Keim, D. A. (2002). Information visualization and visual data mining. Visualization and Computer Graphics. IEEE Transactions on, 8(1), 1–8. Khan, S., Ilyas, Q. M., & Anwar, W. (2009). Contextual advertising using keyword extraction through collocation. Proceedings of the 7th international conference on frontiers of information technology; FIT. Khan, N., et al. (2014). Big data: Survey, technologies, opportunities, and challenges. The Scientific World Journal, 2014, 18. Khare, Abhishek (2014). Big data: Magnification beyond the relational database and data mining exigency of cloud computing. IT in Business, Industry and Government (CSIBIG), Conference on. IEEE. Kim, W. (2009). Parallel clustering algorithms: survey. Parallel Algorithms, Spring. Kreps, J., & Narkhede Rao, N. J. (2011). Kafka: A distributed messaging system for log processing. Proceedings of the NetDB. Kwon, O., Lee, N., & Shin, B. (2014). Data quality management: Data usage experience and acquisition intention of big data analytics. International Journal of Information Management, 34(3), 387–394. Lakshmi, K. P., & Redd, C. (2010). A survey on different trends in data streams. Networking and information technology (ICNIT), international conference on 2010,. IEEE. Leavitt, N. (2013). Bringing big analytics to the masses. Computer, 46(1), 20–23. Lee, E., & Messerschmitt, D. G. (1987). Static scheduling of synchronous data flow programs for digital signal processing. Computers, IEEE Transactions on, 100(1), 24–35. Lee, J. A., & Verleysen, M. (2007). Nonlinear dimensionality reduction. Springer. Lee, D. C., Crowley, P. J., Baer, J. L., Anderson, T. E., & Bershad, B. N. (1998). Execution characteristics of desktop applications on Windows NT. In ACM SIGARCH Computer Architecture News (Vol. 26, No. 3, pp. 27–38). IEEE Computer Society. Li, X., & Yao, X. (2012). Cooperatively coevolving particle swarms for large scale optimization. Evolutionary Computation, IEEE Transactions on, 16(2), 210–224. Li, Y., Chen, W., Wang, Y., & Zhang, Z. L. (2013). Influence diffusion dynamics and influence maximization in social networks with friend and foe relationships. In Proceedings of the sixth ACM international conference on Web search and data mining (pp. 657–666). ACM. Lin, Z. (2005). The online auction market in China: A comparative study between Taobao and eBay. Proceedings of the 7th international conference on electronic commerce,. ACM. LinkedIn. (2014). Statistics of LinkedIn data.. Available from: http://www.statista. com/statistics/274050/quarterly-numbers-of-linkedin-members/ Accessed 23.03.14
1246
I. Yaqoob et al. / International Journal of Information Management 36 (2016) 1231–1247
Liu, Y. J., Chen, C. P., Wen, G. X., & Tong, S. (2011). Adaptive neural output feedback tracking control for a class of uncertain discrete-time nonlinear systems. IEEE Transactions on Neural Networks, 22(7), 1162–1167. Lu, H., Plataniotis, K. N., & Venetsanopoulos, A. N. (2011). A survey of multilinear subspace learning for tensor data. Pattern Recognition, 44(7), 1540–1551. Lu, Y., Zhang, M., Witherspoon, S., Yesha, Y., Yesha, Y., & Rishe, N. (2013). sksOpen: efficient indexing, querying, and visualization of geo-spatial big data. In Machine Learning and Applications (ICMLA), 2013 12th International Conference on (Vol. 2, pp. 495–500). IEEE. Ma, K.-L., & Parker, S. (2001). Massively parallel software rendering for visualizing large-scale data sets. Computer Graphics and Applications, IEEE, 21(4), 72–83. Mavlyutov, R., & Cudre-Mauroux, P. (2015). CINTIA: A distributed, low-latency index for big interval data. Big data (Big Data), IEEE international conference on,. IEEE. McAfee, A., et al. (2012). Big data: The management revolution. Harvard Bus Rev, 90(10), 61–67. Microsoft. (2014). 343 industries gets new user insights from big data in the cloud.. Available from: http://www.microsoft.com/casestudies/ Accessed 16.07.14 Mohanty, S., Jagadeesh, M., & Srivatsa, H. (2013). Big data imperatives: Enterprise ‘Big Data’ Warehouse, ‘BI’ implementations and analytics. Apress. Neumeyer, L., Robbins, B., Nair, A., & Kesari, A. (2010). S4: Distributed stream computing platform. In 2010 IEEE International Conference on Data Mining Workshops (pp. 170–177). IEEE. Niyogi, X. (2004). Locality preserving projections. Neural Information Processing Systems. O’Leary, D. E. (2015). Big data and privacy: Emerging issues. Intelligent Systems, IEEE, 30(6), 92–96. Odom, P. S., & Massey, M. J. (2003). Tiered hashing for data access. Google Patents. Otte, E., & Rousseau, R. (2002). Social network analysis: A powerful strategy, also for the information sciences. Journal of Information Science, 28(6), 441–453. Pedrycz, W. (2013). Granular computing: Analysis and design of intelligent systems. CRC Press. Peter, D. (2016). Google cloud platform.. Available from: https://cloud.google.com/ bigquery/case-studies/safari-books Accessed 8.03.16 Philip Chen, C., & Zhang, C.-Y. (2014). Data-intensive applications, challenges, techniques and technologies: A survey on Big Data. Information Sciences, 275, 314–347. Pinterest. (2014). Statistics of Pinterest data.. Available from: http://www.pinterest. com/craigpsmith/pinterest-resources/ Accessed 18.04.14 plus, G. (2014). Statistics of Google plus data.. Available from: http://www. socialbakers.com/google-plus-statistics/ Accessed 26.04.14 ´ M. (2010). Hubs in space: Popular ´ M., Nanopoulos, A., & Ivanovic, Radovanovic, nearest neighbors in high-dimensional data. The Journal of Machine Learning Research, 11, 2487–2531. Raghupathi, W., & Raghupathi, V. (2014). Big data analytics in healthcare: Promise and potential. Health Information Science and Systems, 2(1), 3. Reckoning, T. D. (2014). The six most fascinating technology statistics today.. Available from: http://www.dailyreckoning.com.au/the-six-most-fascinatingtechnology-statistics-today/2013/06/11/ Accessed 31.07.14 Richtárik, P., & Takáˇc, M. (2012). Parallel coordinate descent methods for big data optimization. arXiv preprint arXiv:1212.0873. Rodríguez-Mazahua, L., Rodríguez-Enríquez, C. A., Sánchez-Cervantes, J. L., Cervantes, J., García-Alcaraz, J. L., & Alor-Hernández, G. (2015). A general perspective of Big Data: applications, tools, challenges and trends. The Journal of Supercomputing, 1–41. Rouse, M. (2014). SDN technology. Available from: http://searchsdn.techtarget. com/definition/software-defined-storage Accessed 7.01.14 Russom, P. (2011). Big data analytics. In TDWI best practices report. Fourth Quarter. Sabater, J. (2002). Reputation and social network analysis in multi-agent systems. Proceedings of the first international joint conference on Autonomous agents and multiagent systems: Part 1,. ACM. Sagiroglu, S., & Sinanc, D. (2013). Big data: A review. Collaboration technologies and systems (CTS), 2013 international conference on,. EEE. Sahimi, M., & Hamzehpour, H. (2010). Efficient computational strategies for solving global optimization problems. Computing in Science & Engineering, 12(4), 0074–83. Sanaei, Z., Abolfazli, S., Gani, A., & Buyya, R. (2014). Heterogeneity in mobile cloud computing: taxonomy and open challenges. IEEE Communications Surveys & Tutorials, 16(1), 369–392. Satyanarayanan, M., Simoens, P., Xiao, Y., Pillai, P., Chen, Z., Ha, K., & Amos, B. (2015). Edge analytics in the internet of things. IEEE Pervasive Computing, 14(2), 24–31. ScienceDaily. (2016). Big Data, for better or worse: 90% of world’s data generated over last two years.. Available from: https://www.sciencedaily.com/releases/2013/ 05/130522085217.htm Acccessed 24.03.16 Shang, W., Jiang, Z. M., Hemmati, H., Adams, B., Hassan, A. E., & Martin, P. (2013). Assisting developers of big data analytics applications when deploying on hadoop clouds. In Proceedings of the 2013 International Conference on Software Engineering (pp. 402–411). IEEE Press. Shen, Z., Ma, K.-L., & Eliassi-Rad, T. (2006). Visual analysis of large heterogeneous social networks by semantic and structural abstraction. Visualization and Computer Graphics. IEEE Transactions on, 12(6), 1427–1439. Shi, W., Guo, Y. F., Jin, C., & Xue, X. (2008). An improved generalized discriminant analysis for large-scale data set. In Machine Learning and Applications, 2008. ICMLA’08. Seventh International Conference on (pp. 769–772). IEEE.
Shibata, K., Ikeda Y. (2009). Effect of number of hidden neurons on learning in large-scale layered neural networks ICCAS-SICE, 2009; IEEE. Siddiqa, Aisha, Hashem, Ibrahim Abaker Targio, Yaqoob, Ibrar, Marjani, Mohsen, Shamshirband, Shahabuddin, Gani, Abdullah, et al. (2016). A survey of big data management: Taxonomy and state-of-the-art, Journal of Network and Computer Applications, 71, 2016, (pp. 151–166), ISSN 1084-8045, http://dx.doi.org/10. 1016/j.jnca.2016.04.008. (http://www.sciencedirect.com/science/article/pii/ S1084804516300583). Song, H., Dharmapurikar, S., Turner, J., & Lockwood, J. (2005). Fast hash table lookup using extended bloom filter: an aid to network processing. ACM SIGCOMM Computer Communication Review, 35(4), 181–192. Sookhak, M., Talebian, H., Ahmed, E., Gani, A., & Khan, M. K. (2014). A review on remote data auditing in single cloud server: Taxonomy and open issues. Journal of Network and Computer Applications, 43, 121–141. Thompson, D., Levine, J. A., Bennett, J. C., Bremer, P. T., Gyulassy, A., Pascucci, V., et al. (2011). Analysis of large-scale scalar data using hixels. In Large Data Analysis and Visualization (LDAV), 2011 IEEE Symposium on (pp. 23–30). IEEE. Thusoo, A., Sarma, J. S., Jain, N., Shao, Z., Chakka, P., Anthony, S., et al. (2009). Hive: a warehousing solution over a map-reduce framework. Proceedings of the VLDB Endowment, 2(2), 1626–1629. Tracy, S. J. (2010). Qualitative quality: Eight big-tent criteria for excellent qualitative research. Qualitative Inquiry, 16(10), 837–851. Tumblr. (2014). Statistics of Tumblr data.. Available from: http://www. statisticbrain.com/top-us-websites-by-traffic Accessed 7.05.14 Twitter. (2014). Statistics of Twitter data.. Available from: http://www. statisticbrain.com/twitter-statistics/ Accessed 2.05.14 Waal-Montgomery, M. D. (2016). World’s data volume to grow 40% per year & 50 times by 2020: Aureus. Available from: https://e27.co/worlds-data-volume-togrow-40-per-year-50-times-by-2020-aureus-20150115-2/ Accessed 24.03.16 Wang, J., Zhang, Y., Gao, Y., & Xing, C. (2013). pLSM: A Highly Efficient LSM-Tree Index Supporting Real-Time Big Data Analysis. In Computer Software and Applications Conference (COMPSAC), 2013 IEEE 37th Annual (pp. 240–245). IEEE. Wang, L., Wang, G., & Alexander, C. A. (2015). Big data and visualization: Methods, challenges and technology progress. Digital Technologies, 1(1), 33–38. Wayner, P. (2012). 7 top tools for taming big data.. Available from:. http://www. networkworld.com/reviews/2012/041812-7-top-tools-for-taming-258398. html Woods, D., & Naughton, T. J. (2012). Optical computing: photonic neural networks. Nature Physics, 8(4), 257–259. Wordpress. (2014). Statistics of Wordpress data.. Available from: http://w3techs. com/technologies/details/cm-wordpress/all/all Accessed 29.03.14 Wu, X., Zhu, X., Wu, G. Q., & Ding, W. (2014). Data mining with big data. IEEE transactions on knowledge and data engineering, 26(1), 97–107. Xu, G., & Zhang Li, Y. L. (2011). Web content mining, in web mining and social networking. pp. 71–87. Springer. Yang, Z., Tang, K., & Yao, X. (2008). Large scale evolutionary optimization using cooperative coevolution. Information Sciences, 178(15), 2985–2999. Yao, W., Chen, X., Zhao, Y., & van Tooren, M. (2012). Concurrent subspace width optimization method for RBF neural network modeling. IEEE transactions on neural networks and learning systems, 23(2), 247–259. Yousafzai, Abdullah, et al. (2016) Multimedia augmented m-learning: Issues, trends and open challenges. International Journal of Information Management, 36.5: 784–792. Yousafzai, Abdullah, et al. (2016). Cloud resource allocation schemes: review, taxonomy, and opportunities. Knowledge and Information Systems, 1–35. Youtube. (2014). Statistics of youtube data.. Available from: http://www. statisticbrain.com/youtube-statistics/ Accessed 4.05.14 Zaslavsky, A., Perera, C., & Georgakopoulos, D. (2013) Sensing as a service and big data. arXiv preprint arXiv:1301.0159. Zhong, Y., Fang, J., & Zhao, X. (2013). VegaIndexer: A Distributed composite index scheme for big spatio-temporal sensor data on cloud. IGARSS. Zhou, Q., Shi, P., Liu, H., & Xu, S. (2012). Neural-network-based decentralized adaptive output-feedback control for large-scale stochastic nonlinear systems. IEEE Transactions on Systems, Man, and Cybernetics, Part B (Cybernetics), 42(6), 1608–1619.
Further reading Choudhary, S., Dincturk, M. E., Mirtaheri, S. M., Moosavi, A., Von Bochmann, G., & Jourdan, G. V., et al. (2012). Crawling rich internet applications: the state of the art. In Proceedings of the 2012 Conference of the Center for Advanced Studies on Collaborative Research (pp. 146–160). IBM Corp. Condie, T., Mineiro, P., Polyzotis, N., & Weimer, M. (2013). Machine learning for big data. In Proceedings of the 2013 ACM SIGMOD International Conference on Management of Data (pp. 939–942). ACM. Eric Savitz G. (2013). 10 critical tech trends for the next five years; Available from: http://www.forbes.com/sites/ ericsavitz/2012/10/22/gartner-10-critical-tech-trends-for-thenext-five-years/ Accessed 8.10.12.
I. Yaqoob et al. / International Journal of Information Management 36 (2016) 1231–1247
Ferguson, P., & Huston, G. (1998). Quality of service: Delivering QoS on the Internet and in corporate networks, John Wiley & Sons, Inc. Gillick, D., Faria, A., DeNero, J. (2006). Mapreduce: Distributed computing for machine learning, Berkley, Dec, 18. Hashem, I.A.T., Anuar, N.B., Gani, A., Yaqoob, I., Xia, F., & Khan, S.U. (2016). MapReduce: Review and open challenges Scientometrics, 1–34. Ibrar, Yaqoob, Victor, Chang, Abdullah, Gani, Salimah, Mokhtar, Ibrahim, Abaker Targio Hashem, Ejaz Ahmed, Nor Badrul Anuar, & Samee U. Khan (2016). Information fusion in social big data: Foundations, state-of-the-art, applications, challenges, and future research directions, International Journal of Information Management, Available online 5 May, ISSN 0268-4012, http://dx.doi.org/10.1016/j.ijinfomgt.2016.04.014. Isard, M., et al. (2007). Dryad: Distributed data-parallel programs from sequential building blocks ACM SIGOPS operating systems review; ACM. Khan, S., Shiraz, M., Abdul Wahab, A.W., Gani, A., Han, Q., & Bin Abdul Rahman, Z. (2014). A comprehensive review on adaptability of network forensics frameworks for mobile cloud computing. The Scientific World Journal. Khan, S., Shiraz, M., Abdul Wahab, A.W., Gani, A., Han, Q., & Bin Abdul Rahman, Z. (2014) A comprehensive review on adaptability of network forensics frameworks for mobile cloud computing. The Scientific World Journal. Konopnicki, D., & Shmueli, O. (1995). W3qs: A query system for the world-wide web VLDB. Kovalchuk, S.V., et al. (2014). A technology for BigData analysis task description using domain-specific languages. Procedia Computer Science, 29: 488–498. Masseglia, F., & Poncelet Cicchetti, P.R. (2000). An efficient algorithm for web usage mining. Networking and Information Systems Journal 2(5/6) 571–604.
1247
McCreadie, R., Macdonald, C., Ounis, I., Osborne, M., & Petrovic, S. (2013). Scalable distributed event detection for twitter. In Big Data, 2013, IEEE International Conference, on (pp. 543–549). IEEE. (2014). Databases Available from: NoSql https://infocus.emc.com/april reeve/big-data-and-nosql-theproblem-with-relational-databases/ Accessded 8.11.14. Park, H.W., Yeo, I.Y., Lee, J.R., & Jang, H. (2013). Study on big data center traffic management based on the separation of large-scale data stream. In Innovative Mobile and Internet Services in Ubiquitous Computing (IMIS), 2013 Seventh International Conference on (pp. 591–594). IEEE. Roweis, S.T., & Saul, L.K. (2000). Nonlinear dimensionality reduction by locally linear embedding. Science, 290: (5500) 2323–2326. Simoff S., & Böhlen Mazeika, M.H.A. (2008). Visual data mining: Theory, techniques and tools for visual analytics Vol. 4404 Springer. Wang, Q., Wang, C., Ren, K., Lou, W., & Li, J. (2011). Enabling public auditability and data dynamics for storage security in cloud computing. IEEE transactions on parallel and distributed systems, 22 (5) 847–859. Yu, Y., Isard, M., Fetterly, D., Budiu, M., Erlingsson, Ú., & Gunda, P.K., et al. (2008). DryadLINQ: A System for General-Purpose Distributed Data-Parallel Computing Using a High-Level Language. In OSDI (Vol. 8, pp.1–14). Yu, D., & Deng, L. (2011). Deep learning and its applications to signal and information processing [exploratory dsp]. Signal Processing Magazine, IEEE, 28(1) 145–154. Yu, Q., & Bouguettaya, A. (2013). Efficient service skyline computation for composite service selection. Knowledge and Data Engineering, IEEE Transactions on 2013, 25(4) 776–789. Zhou, J., Chen, C.P., Chen, L., & Li, H.X. (2014). A collaborative fuzzy clustering algorithm in distributed network environments. IEEE Transactions on Fuzzy Systems 22 (6) 1443–1456.


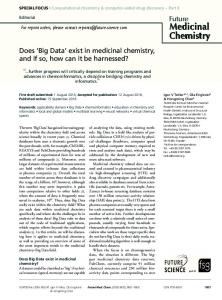
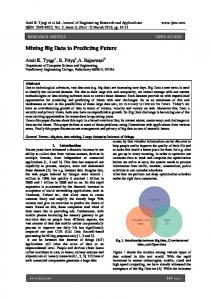


![[PDF] From Big Data to Big Profits - Google Sites](https://m.moam.info/img/260x300/pdf-from-big-data-to-big-profits-google-sites_6477e7eb097c474d228c8f91.jpg)
![[PDF BOOK] From Big Data to Big Profits - Google Sites](https://m.moam.info/img/260x300/pdf-book-from-big-data-to-big-profits-google-sites_64774004097c4796708b7e79.jpg)


