Available online at www.sciencedirect.com
ScienceDirect Procedia CIRP 44 (2016) 91 – 96
6th CIRP Conference on Assembly Technologies and Systems (CATS)
Big Data Methods for Precision Assembly Ricarda Schmitt*, Franz Dietricha, Klaus Drödera a
Chair of Production Technology and Process Automation, Institute of Machine Tools and Production Technology (IWF), Technische Universität Braunschweig, Langer Kamp 19b, 38106 Braunschweig, Germany * Corresponding author. Tel.: +49 531/391-8753; fax: +49 531/391-5842. E-mail address:
[email protected]
Abstract Industry 4.0 looks at increasing the availability of data, for example, that resulting from an assembly process. This article explores the application of these concepts to a precision assembly task to maximize the yield and machine uptime. Although traditional methods focus on data resulting from assembly, this paper will look at the full scope of available data. In conjunction with a discussion of this data, a model to describe a precision assembly process will be introduced. This model enables long term errors to be detected as well as the identification of trends enabling predictive maintenance. Elsevier B.V. B.V. This is an open access article under the CC BY-NC-ND license © 2016 The Authors. Published by Elsevier (http://creativecommons.org/licenses/by-nc-nd/4.0/). Peer-review under responsibility of the organizing committee of the 6th CIRP Conference on Assembly Technologies and Systems (CATS). Peer-review under responsibility of the organizing committee of the 6th CIRP Conference on Assembly Technologies and Systems (CATS) Keywords: Control methods in precision assembly; Industry 4.0 applications in assembly; Novel system integration approaches/techniques
1. Introduction 1.1. Data within a Generalized Precision Assembly Task Precisions assembly is a unique branch of assembly in which the tolerances between the assembled parts are on the range of less than 25 µm. Due to the extreme requirements of these tasks, the initial investment in machine and process development are very high. The tight process tolerances make the processes highly sensitive to change, where any slight deviation can result in unacceptable output. Common practice is to monitor the process output, making sure that the produced assemblies are acceptable. When something goes wrong with the process, additional defect parts need to be created to reproduce and ultimately find the error. Within this paper a method to find these disturbances well before they become a problem is presented. First a generalized precision assembly task, its components and a brief review of the data they produce is presented. This is followed by data mining techniques and a discussion of which methods are promising to analyze this data in such a manner that deviations can be found before they are a problem. Lastly, these methods are shown on a portion of an assembly task. The following article is organized as follows. First the available data will be introduced. Next related work and methods within data mining will be explained. This will be transferred to an assembly problem and used in an example process, to show that this approach is functional.
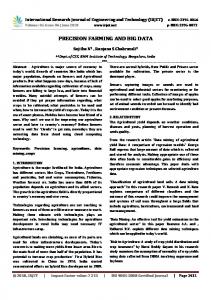
The data found in a precision assembly task can be broken down into four categories. This includes process data, machine data, environment data, and data about the assembled product. The different data sources are shown in Figure 1. Process covers data which is gathered during the production. An example could the force of setting a handled part on a substrate. One large source of data which should not be overlooked is the machine itself. These data can include the positioning error associated with the actuators, information resulting from selftests, as well as information resulting from subcomponents connected to the assembly robot. Information about the environment includes such things as the temperature and relative humidity. Last but not least are the assembly data (product), which includes measurements about the quality of the resulting parts or information about their quality before the assembly. Each of the presented data categories offers a large amount of data, most of which is of little to no use. Although data is becoming cheaper and cheaper to store, it is also important to consider which data do not need to be saved for long periods of time. Amongst this data there are useful elements and it is a matter of to find the useful elements amongst the rest.
2212-8271 © 2016 The Authors. Published by Elsevier B.V. This is an open access article under the CC BY-NC-ND license (http://creativecommons.org/licenses/by-nc-nd/4.0/). Peer-review under responsibility of the organizing committee of the 6th CIRP Conference on Assembly Technologies and Systems (CATS) doi:10.1016/j.procir.2016.02.141
92
Ricarda Schmitt et al. / Procedia CIRP 44 (2016) 91 – 96
2. Assembly Systems and Data In the previous section an introduction in available datasets to a precision assembly task was given. To get useable information out of this data, this is followed by an overview of data mining methods. Current methods are then presented, followed by an explanation of the functionality of data mining methods. 2.1. Application of Data Mining Methods Data mining represents a set of methods which enable the extraction of knowledge from a large dataset. Such methods are not new to assembly and production tasks. The following section presents a brief look at other methods and how they have been applied to assembly processes. An example of a data mining method is pattern recognition. This method enables trends to be found in large datasets. Based on these trends, it is possible to determine how a process is performing over a long period of time. Extending this to a precision assembly task, a substantial gain can be made if a combination of the correct data and methods can be found, which enable the health of a system to be determined. [6] The concept of data mining needs to handle two main aspects: which data need to be saved and how to convert the saved data into useful information. In addition to actually saving the data, it is important that the data be saved in a format so that it can be evaluated at a later date, when it for example came to a failure of the product. To understand current methods and their applicability a brief review of data mining methods is presented. An extensive review of data mining applications for quality improvement in manufacturing industries covering literature from 1997 to 2007 is presented in [9]. The review briefly describes the basic procedure of the knowledge discovery in databases (KDD) and data mining processes. The reviewed application studies are categorized into common quality improvement tasks, such as predicting quality, classification of quality, or parameter optimization. Different application studies refer to assembly processes in metal product manufacturing industries and electronic product manufacturing industries, respectively. Although some of the goals are the same, none have extended the concepts to a precision assembly task. Using process and product data to determine how well a production process is working is not a novel concept. Other examples include a condition-based maintenance (CBM) system [10] with the main steps: data acquisition, data processing and maintenance decision-making. This paper summarizes the recent research and developments in diagnostics and prognostics of mechanical systems implementing CBM. A log based predictive maintenance strategy build with multiple-instance learning is presented in [13]. This paper presents a predictive maintenance workflow and compares this to competing methods. Further research on knowledge discovery and data mining application is presented in [1]. This paper looks at data mining in a manufacturing environment. It focuses on points like characterization and
description, classification in manufacturing, prediction, clustering, and evolution analysis. Likewise detecting predictive failures can be done by observing systems status, which was shown by [5]. Using online learning methods, a failure forecast method is presented. Here a class of decision trees, where the one with the larges reward value is chosen to predict failures in production. A large training dataset was created to make the analysis functional. It was shown that good prediction accuracy for failures can be reached by such an online system. In the field of precision assembly, a multi-agent architecture for reconfiguration of precision modular assembly systems has been implemented. The paper developed a framework for reconfigurable and modular equipment modules [2]. This is done by creating sub-modules for each equipment part, where it is possible to combine different sub-modules to create a functional machine offset for a specified production task. Only the needed machine parts can be configured together. It is not a predictive tool but a tool to speed up system configurations in precision assembly by modelling the production process in subdivided modules. In summery there are already many different tools for data analytics and even for predictive processes in production. But what is still missing, is to consider a production process and a related method to explore data with tight tolerances, where even a measuring error is in the order of the measured production data. Such a precise process work with a very different tolerance range. Other authors started modeling of precision processes, but do not use these models for a forecast of machine failures or necessary maintenance [2]. Another aspect which sets precision assembly apart from other assembly tasks is the comparatively small batch sizes. Consequently, only a very small dataset is available and thus the main challenge here is to create a reliable model out this dataset. This paper explores existing DM methods which can be applied to precision assembly tasks to help predict when maintenance is required. 2.2. Data Mining Methods As shown in the last section, data mining methods have been applied to different manufacturing and assembly tasks. In addition to these methods, there are other data mining methods which are applicable to the task at hand. Following a presentation of these methods, a summary and discussion of their applicability to precision assembly is presented. The increasing role of big data has caused continual growth within data mining methods. Some general methods which enable the data to be converted into useful information are investigated here. Tools which enable this include: - Statistical methods such as linear regression to gain insight into trends within the data - Clustering methods, which structure big data sets, and finally - Expert knowledge to explicitly look for effects, for example using a lookup table.
Ricarda Schmitt et al. / Procedia CIRP 44 (2016) 91 – 96
Correlation and Regression A very important task within data analysis is to find correlations in a set of data. Processes of correlation analysis are often based on linear correlations or nonlinear correlations. In linear cases they can be mathematically described by covariance, Pearson's correlation, or multiple correlations. Nonlinear correlations are mathematically represented by chisquare tests. [6] Transferring the previously thoughts to the production process, correlations can for example be to detect trends in inaccuracies in axis caused by temperature development. Wherefore regressions can be useful to predict trends in an assembly processes accuracy, in consequence of bad image preceding. Classification and Clustering Another approach is to classify or group big datasets to handle them and get a useable structure. Classification and clustering strategies are divided by whether the separating feature is known or unknown. If the separating feature is known, classification techniques can be used and classes are created based on the second feature. Important approaches are Naiver Bayes-classifier, linear discrimination analysis, next neighbor classifier or decision trees. Naiver Bayes-classifier is based on likelihoods. [6] Otherwise if the separating feature is not known, for example in cases of big unspecified production datasets, clustering proceedings are recommended. Clustering methods analyze datasets by their structure. Strategies here are sequential clustering, prototype clustering, or fuzzy clustering. Classifications are interesting for a segmentation of joining members. Hence a forecast from the joining member category to the possible assembly accuracy is imaginable. Meanwhile clustering can be applied for large dataset analysis for example all set poses of mounted parts.Fehler! Verweisquelle konnte nicht gefunden werden. [6] For all introduced strategies trainings- and separate validation-datasets are required. In cases of small datasets this can be a problem, which can be solved by using expert knowledge stored in look-up tables or small sub-models. [5] Because expert knowledge is not dependent on a dataset, this method can be used for all type of assembly sub-modules. But certainly this method is only useable for known processes. The expert also needs time to generate his knowledge. 3. Methods for Predictive Maintenance In this topic introduced techniques are going to be verified in an experimental evaluation. Therefore, one of the introduced data mining methods is to be chosen. One big question within precision assembly is how to get enough information out of the small batch sizes. Most of the statistical methods for prediction need a considerable database to create reliable forecasts, as seen in the section 2.1. Here a multistep process, where the complex mounting process is broken down into smaller sub-steps, is proposed. Each of these sub-steps can be broken down into a manageable dataset. The
main challenge with this strategy is to outline the different subprocesses and their connection to each other and to ultimately generate a functional interlinkage to map the original process. As already mentioned in section 1.1, there are different data sources in a precision assembly process. Subsequently also the model can be broken down into similar model-blocks. Such a structured model is shown in Figure 1. As can be seen in the model for each data type (product, environment, process and machine) sub-system models can be build. This is done because it is easier to build up small models wherefore only small datasets are required. Further to structure the large amount of data a grouping into data from different data sources can be realized. These approach will be illustrated later. Describing the sub-model approach all data sources will be introduced separately. Starting with the product block, there are sub-models, such as describing the surface quality or the arising measuring errors or tolerances. In the case of the model block “product” it might be more useful to collect influencing variables on the product than creating real sub-models, because in most cases joining members cannot be changed. Within the next block, environmental aspects are handled. The environment has an impact on the main production process, but is not easy to be controlled (only by use of expensive clean rooms). Here we find functions like user disturbance, fluctuation in temperature during uptime (caused by machine) as well as changes in humidity while the process is running. The machine block can be depicted with functions like moving behavior, acceleration behavior or controller errors of the used robot or actuators. One of the most important blocks is the process. Here single production steps are described. Moreover, this block is individual to the process and has to be adapted for each production. Functions such as image processing or plane correction (IPLS measurement), picking or placing a part are basic functions which are often needed. How the single sub-models work together in the main function will be evaluated later. First, we consider the main function as a simple pass-through function which simply collect and forward sub-models answers. Later weighting factors which represent the impact of single sub-functions on the production and finally the reachable product tolerances, can be used in the main-function. 4. Experimental Evaluations In section 3 a method to break a production process into individual data groups is presented. Now one single process is chosen for demonstration and a set of data is recorded. Afterwards a system model with the collected data is created. To show that the model is functional some distortions are added to the experimental assembly and the arising results are compared to the ones of an undisturbed offset. 4.1. Data acquisition on a sample process This topic deals with one chosen process (sub-model) of the production model introduced in section 1.1 and will be used to show that the complex production process model is functional. Here the box "IPLS (in process laser scan) measurement" is selected. It is a closed-loop plane correction which uses a
93
94
Ricarda Schmitt et al. / Procedia CIRP 44 (2016) 91 – 96
confocal laser sensor and a tip-tilt-table. The aim of these measurements is to find the surface angle and adjust the component plane to the working plane of the robot. In a mounting process this is needed to enable the handling of
fragile parts. An example of IPLS application is presented by [11].
Figure 1: Model of the Production Process
Within the experimental setup, the laser is mounted onto a precision assembly robot with the repeatability of 1 µm in x-, y-, and z-axis. This laser has an accuracy of + 0,3 µm in zdirection of the robot. The robot realizes the scanning motion of the laser in x-y-plane while the subsequent angular correction of the substrate is realized by the tip-tilt-table, which enables motion around the x- and y-axis. In this process a defined surface will be scanned by the robot with a laser. Measured data are the robots pose (in X-, Y- and Z-direction) and of course the laser distance to the surface which is added to the respective robot axis. With this values a plane calculation with a least-squared-method is done. Here the output of the robot-function is an angle in X- and Y- direction, as well as a Z-distance of the plane to the robots coordinate system. As a next step the angle of the surface will be corrected by motion of a tip-tilt-table, on which the object to be gripped is placed. In the subsequent experiments, the angle of the tip-tilt-table (measured through the laser-sensor), as well as the raw lasersensor values, are logged.
possible axis. So an offset, simulation an oscillation is the first disturbance. Also soiling is just a kind of possible disturbance with effect on the output angle of the plane. Therefor soiling is chosen as the second disturbance. To simplify the problem, a black box approach is created for each of the table axes. Thus the first the x-axis will be modeled, followed by the y-axis. It must not be forgotten, that the correction movements of the single table-axis are not independent, so a correction in x-axis can evoke a motion in yaxis and conversely. Besides the correct plane is only reached if both angle values are within the tolerances.
4.2. Case Study In this section some experiments were considered to outline that an approach based on sub-models is working properly. As previously explained, the production process is broken down into smaller sub-models. Here the sub-model IPLS (plane measurement and correction) is selected and explored in more detail. To create this sub-model a dataset, as explained in the previous section is recorded. Subsequently two different kinds of disturbances are added. It is anticipated that the resulting angle is dependent on all kind of added distortions in every
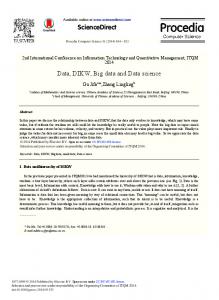
Figure 2: experimental data of an undisturbed plane correction, most corrections are successfully achieved after three iterations.
First a look on a normal undisturbed process will be done. Starting with logging all movements of the tip-tilt-table used
Ricarda Schmitt et al. / Procedia CIRP 44 (2016) 91 – 96
for the correction of the plane. In all done experiments the table starts in the same position. In Figure 2 the motion from a starting angle (start position, table not tilt) to a target angle is shown. The experiment is repeated for n = 20 times. After three corrections of the plane, the target angle is reached in most cases with the set limits of αrange = βrange = + 0,005° degree. Using a Monte Carlo analysis in combination with the plane calculation and the repeatability of the robot/laser, the expected tolerances of the plane are determined. Within this analysis, inaccuracies of assembly in a range of 0.01° degree (3σ) should be expected. This calculation leads to the set limits which are represented in the diagram with a dashed line. As seen in the diagram (Figure 3), the repeatability of the table is nearly in the same order as the limits of the tolerances, which makes it hard to clearly detect disturbances in the process. The measured values already spread about a wide range. For all experiments, the plane was reached within five tries. To confirm the first measurement a second measurement with different (double) target angle is done (Figure 4). It can be shown, that even if other target angles has to be reached, the recorded process data looks in the similar way. In order to test the black box model, the process is disturbed. Within these tests, two different distortions are considered. Within the first, the parts are intentionally soiled. In the second test, an inaccuracy of the robot axis is simulated.
than 7 µm. So in the diagram (Figure 6) the process to reach the claimed angles with a noise range of about 7 µm is shown. As can be seen Figure 7, the standard deviation is much larger than in the sets before. What although can be observed is that the correction cycles of the robot are not so target orientated as in the experiments before. The angle values show a kind of noise. There is not such a clear correction motion like shown before.
Figure 4: plane correction process with double target angles (experimental).
The experiments of the undisturbed system show that the plane correction process is reproducible and a stable process, which can be modeled by observing the tip table motion. Through the addition of a disturbance it is possible to change the behavior of the table. It is possible to detected oscillation and consequently essential maintenance in the z-axis. Moreover, disturbing objects can be found by analyzing the motion of the tip-tilt-table. In both disturbed processes it was found that correction motion failed much more often than in an undisturbed process. In a normal plane correction process the target plane was reached after about three corrections. The disturbed experiments need about five or even more correction cycles to reach the target or it failed completely. Also the standard deviation is much bigger in disturbed cases (Figure 7 in comparison to Figure 3).
Figure 3: recorded experimental data from an undisturbed process.
First a disturbing object is placed below the magazine of the die to simulate soiling. This soiling is kept constant. This leads to an instable positioning process. In the following diagram (Figure 5) can be seen that the standard deviation is much bigger than in a normal set. Also the starting value for the angle is completely different to the former experiments. The next disturbance looks at simulating the degradation of z-axis of the robot. This is achieved by adding noise to the zaxis of the robot. Within the experiment, the original dataset is taken and before the plane is calculated, a random value is added to the z-axis. The random values are normally distributed and chosen in a range of 7 µm. The resulting values are then used in the closed-loop correction to calculate the correction of the tip-tilt table. The correction process is not reliable possible in a range of 10 correction tries, if the rage of noise is bigger
Figure 5: experimental disturbed process of plane correction simulating soiling (obstacle; glass object).
95
96
Ricarda Schmitt et al. / Procedia CIRP 44 (2016) 91 – 96
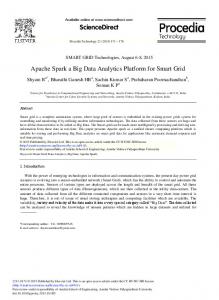
such a sub-model was successfully shown by the sample process “plane correction by a tip-tilt-table”. The next steps will look at the remaining sub-models and create a central main function which realizes the connection between these models. Furthermore, a strategy which enables a prediction of assembly accuracy is to be found. Therefore, a kind of grading system for errors and consequently a range of causing inaccuracies is intended. Another important topic is traceability. Traceability is a big question in which failures from parts within the field can be linked to their production data. The analysis of the process data enables the control loop to be closed. In this way patterns in data structure (even in the field) can be found and subsequently used for new pattern detection methods. Figure 6: experimental disturbed function of plane correction (adding a disturbance to model oscillations in z-axis; model aging of robot.
References [1] Choudhary, A. K.; Harding, J. A.; Tiwari, M. K. (2008): Data mining in manufacturing: a review based on the kind of knowledge. Journal of Intelligent Manufacturing October 2009, Volume 20, Issue 5, pp 501-521, S. 501–521.
angle in degree
[2] Ferreira, P.; Lohse, N.; Ratchev, S.: Multi-agent Architecture for Reconfiguration of Precision Modular Assembly Systems. In: IFIP Advances in Information and Communication Technology Volume 315: IPAS 2010, IFIP AICT 315,2010. [3] Qiang F.; Jian-Guang L.; Yi W.; Jiang L. (2009): Execution Anomaly Detection in Distributed Systems through Unstructured Log Analysis. In: International conference on Data Mining: IEEE. http://research.microsoft.com/apps/pubs/default.aspx?id=102365. [4] Fu, Z., Robles-Kelly, A., Zhou, J. (2011): Multiple instance learning with instance selection. Transactions on Pattern Analysis and Machine Intelligence. In: IEEE., DOI 10.1109/TPAMI.2010.155 [5] Gu, X., Papadimitriou, S., Yu, P.S., Chang, S.P (2008): Online failure forecast for fault-tolerant data stream processing. In: ICDE. DOI: 10.1109/ICDE.2008.4497565 Figure 7: comparing the standard deviations of conducted experiments.
Finally, there are three ways to detect an unstable process, thus give a forecast for failures in the accuracy of the final product. Abnormalities can be detected by the number of iterations required for a successful correction process or by observing intermediate angle values during the correction cycle. Here is the starting angle value of particular importance. Also the standard deviation can give a hint for a disturbed process. All is significant to determine and might be a sign that maintenance is required. In the conducted experiments a correlation between a disturbance of the plane correction process and the resulting table angles could be shown. So for the sub-model IPLS a correlation method is suitable. This can be transferred to the other sub-models, considering different data source might need another data mining strategy, what was explained in section 3. 5. Conclusion and Outlook This article contributes a method to find disturbances in a production process before they lead to a failure. Therefore, the strategy to break down the assembly process into small functional sub-models was presented. This model is able to detect abnormalities in production and give a perdition indication for next required maintenance. The functionality of
[6] Haag, S.; Pyschny, N.; Brecher, C. (2011): Flexible Assembly Robotics for Self-optimizing Production. In: Lecture Notes in Computer Science Volume 7102, pp. 189–198. DOI: 10.1007/978-3-642-25489-5_19 [7] Han, J.; Kamber M. (2006): Data Mining – Concepts and Techniques. Elsevier, Morgan Kaufmann Publisher San Francisco [8] Jardine, A.K.S.; Lin, D.; Banjevic, D. (2005): A review on machinery diagnostics and prognostics implementing condition-based maintenance. In: Mechanical Systems and Signal Processing, pp. 1483–1510. DOI: 10.1016/j.ymssp.2005.09.012 [9] Köksal, G.; Batmaz, İ.; Testik, M. (2011): A review of data mining applications for quality improvement in manufacturing industry. In: Expert Systems with Applications, pp. 13448–13467. DOI:10.1016/j.compind.2015.02.010 [10] Murray, J. F., Hughes, G. F., Kreutz-Delgado, K. (2005): Machine learning methods for predicting failures in hard drives: a multiple-instance application. In: Journal of Machine Learning Research 6. pp. 783–816. [11] Ponomareva, E. S.; Wang, K.; Lien, T. (2006): Predicting Assembly Quality of Complex Structures Using Data Mining. In: Intelligent Strategies in, pp. 263–268. DOI 10.1007/0-387-34403-9 [12] Rathmann, S.; Wrege, J.; Schöttler, K.; Raatz, A.; Hesselbach, J. (2006): Sensor guided micro assembly by using laser-scanning technology. In: Ratchev, S.: Precision Assembly Technologies for Mini and Micro Products. [13] Sipos, R.; Fradkin, D.; Moerchen, F.; Wang, Z. (2014): Log-based Predictive Maintenance. DOI 10.1145/2623330.2623340