ATMOSPHERIC SCIENCE LETTERS Atmos. Sci. Let. (2017) Published online in Wiley Online Library (wileyonlinelibrary.com) DOI: 10.1002/asl.749
Binary mesovortex structure associated with southwest vortex Kuo Zhou,1 Haiwen Liu,2,3* Liang Zhao,2 Yuxiang Zhu,4 Yihua Lin,2 Fuying Zhang5 and Ning Fu3 1 College
of Atmospheric Sciences, Chengdu University of Information Technology, China Institute of Atmospheric Physics, Chinese Academy of Sciences, Beijing, China 3 Department of Aviation Meteorology, Civil Aviation University of China, Tianjin, China 4 CMA Training Center, China Meteorological Administration, Beijing, China 5 College of Atmospheric Sciences, Nanjing University of Information Science and Technology, Nanjing, China 2 LASG,
*Correspondence to: H. Liu, Department of Aviation Meteorology, Civil Aviation University of China, 2898 Jinbei Road, Dongli District, Tianjin, 300300, China. E-mail:
[email protected]
Received: 25 September 2016 Revised: 8 February 2017 Accepted: 24 March 2017
Abstract Previous work has concluded that the southwest vortex (SWV) is a single mesoscale vortex. Applying the National Centers for Environmental Prediction Final Operational Global Analysis, the Interim European Centre for Medium-Range Weather Forecasts Re-Analysis, and the non-hydrostatic mesoscale Advanced Research Weather Research and Forecasting (WRF) model to a case study, we discovered a new type of SWV associated with another coexisting mesoscale warm and moist vortex. In the case study, meso-𝛽-scale vortex-A was generated at 1800 UTC 17 July, and dissipated around 0500 UTC 18 July 2013, with a lifespan of approximately 11 h. Vortex-B occurred at 0600 UTC 17 July and moved out of the Sichuan Basin at 0800 UTC 18 July 2013, remaining over the basin for approximately 26 h. Stronger atmospheric upward motion and two mesoscale rainbelts associated with each of the vortices further demonstrate the binary mesoscale vortex structure related to the SWV using the WRF model. The quasi-geostrophic balance of the two mesoscale cyclonic circulations is responsible for the generation and maintenance of the two closed mesoscale vortices. Keywords:
southwest vortex; WRF model; binary vortex structure; geostrophic adjustment
1. Introduction The Tibetan Plateau (TP) is the largest plateau in the world, with the Sichuan Basin located on its eastern flank. A mesoscale vortex, known as a southwest vortex (SWV) because of its location over southwest China (Tao and Ding, 1981), is commonly found at the eastern and southeastern flanks of the TP (Wang et al., 1993). Unlike the mesoscale convective vortex that is most evident between 500 and 600 hPa over the central United States (Davis and Trier, 2007), the SWV is normally most visible in the lower troposphere centered at 700 or 850 hPa (Lu, 1986; Fu et al., 2013, 2014b). The SWV has been studied extensively. Lu (1986), e.g. showed that in a SWV the lower troposphere and the middle troposphere were dominated by convergence, while the upper troposphere is controlled by divergence (Zhao and Fu, 2007). Huang (1986) found that ascending motion existed in the center and periphery of the SWV. A strong and well-developed SWV can stretch up to 100 hPa, which is extremely deep (Chen et al., 1998). In general, the SWV has complex temperature and humidity characteristics during its formation and development stages. Kuo et al. (1988) found that a high equivalent potential temperature (𝜃 e ) occurred in the center of the SWV. These characteristics have many similarities with the vortices found in the United States, as summarized by Menard and Fritsch (1989). Recently, Li et al. (2014) studied the SWV using ensemble-based analyses and forecasts methods, indicating that a more baroclinic environment facilitated the evolution of the
SWV. The mechanisms associated with the formation and development of the SWV are largely influenced by the unique thermo-dynamical and dynamical environments of the plateau, including topography (Wu and Chen, 1985; Jiang et al., 2012; Wang and Tan, 2014), latent heat release (Kuo et al., 1986; Wang and Orlanski, 1987; Kuo et al., 1988), and the interaction between SWV and other systems, such as the eastward movement of the plateau vortex (Wang, 1987; Yu et al., 2016). As a mesoscale vortex, SWV can comprise small-scale weather systems. Tao (1980) found that three mesoscale vortices that were lined up with one shear line were associated with the SWV. However, due to the lack of high spatial and temporal resolution datasets, it is difficult to find multiple mesoscale systems associated with the SWV. This paper identifies and studies a new binary vortex structure related to the SWV. The article is structured as follows: data and methods are described in Section 2; Section 3 presents the results, including the observed and simulated results of the binary mesoscale vortices, and an analysis of the potential mechanism for the formation and development of the binary mesoscale vortices; and Discussion and conclusion are presented in Section 4.
2. Data and methods Hourly gauged rainfall data, including the conventional meteorological observations and automated weather
© 2017 The Authors. Atmospheric Science Letters published by John Wiley & Sons Ltd on behalf of the Royal Meteorological Society. This is an open access article under the terms of the Creative Commons Attribution License, which permits use, distribution and reproduction in any medium, provided the original work is properly cited.
K. Zhou et al.
75°E
90°E
105°E
120°E
135°E
40°N
40°N
35°N
35°N
3500
30°N
30°N
2000
25°N
25°N
1000
20°N
20°N
200
15°N
15°N
10°N
10°N
4500 4000
3000
1500
500
75 25 0
80°E
90°E
100°E
110°E
120°E
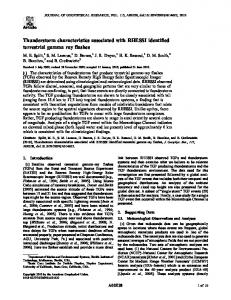
Figure 1. Model domains and topography.
stations from China, were provided by the Meteorological Information Center of China Meteorological Administration. The large-scale circulations associated with the SWV were analyzed based on the National Centers for Environmental Prediction (NCEP) Final (FNL) Operational Global Analysis with 1∘ × 1∘ latitude–longitude grids at 6-h intervals. The Interim European Centre for Medium-Range Weather Forecasts Re-Analysis (ERA-Interim) with a temporal resolution of 6 h and a spatial resolution of 0.5∘ × 0.5∘ was also used to analyze the weather circulation. To investigate the evolution of the SWV, version 3.4.1 of the non-hydrostatic mesoscale Advanced Research Weather Research and Forecasting (WRF) model was applied. A one-way nested run was performed in this simulation, and its initial and lateral conditions were derived from the NCEP FNL Operational Global Analysis. The WRF horizontal grid spacing is 30 km (200 × 150 grid points) in the domain, which has 28 vertical levels. The numerical simulation was initialized at 0000 UTC 17 July 2013 and the results were output hourly with a total simulation length of 36 h. The model parameterization schemes in the domain were as follows. The Rapid and Accurate Radiative Transfer Model scheme (Mlawer et al., 1997) was used for longwave radiation and the Dudhia scheme (Dudhia, 1989) for shortwave radiation. We used the Kain–Fritsch convective scheme (Kain, 2004) for cumulus convection. The Monin–Obukhov scheme (Janji´c, 2002) was used for the surface layer physics. The Noah land surface scheme (Ek et al., 2003) was applied along with the Yonsei University planetary boundary layer (PBL) scheme (Hong et al., 2006). The microphysics scheme was used by Thompson et al. (2008). The model grids are shown in Figure 1.
3. Results 3.1. Observations of the binary mesoscale vortices associated with the SWV A mesoscale SWV was observed over Sichuan Province and an isoline of 3055 gpm occurred in the vortex
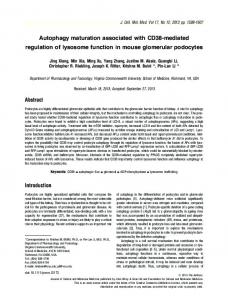
at 1200 UTC 17 July 2013 (Figure S1, Supporting information). The vortex had been generated in Sichuan Province at 0600 UTC 17 July 2013 (not shown). Following the criteria of Lu (1986), it was categorized as a typical SWV. In accordance with the SWV in the lower troposphere, a longwave trough was observed at the 500-hPa level behind the lower level SWV. This further demonstrates that the SWV is a shallow system and has baroclinic features. To study the detailed structure of the mesoscale SWV, the 700-hPa FNL analyses over the region are given in Figure 2. At 1800 UTC 17 July, the shape of the SWV began to change. Mesoscale cyclonic vortices appeared in the northeast (labeled ‘A’) and south (‘B’) of Sichuan Province, although the 3080 gpm isoline was not closed in mesoscale cyclonic vortex-A. Based on the criteria of Orlanski (1975), vortex-A was a meso-𝛽-scale vortex. Although vortex-A satisfied the criteria of meso-𝛽-scale, the temporal scale of vortex-B was 2 h beyond the guidelines of Orlanski (1975) on the meso-𝛽-scale; therefore, vortex-B was classified as a mesoscale vortex. The weather patterns presented in Figure 2(b) persisted until 0000 UTC 18 July 2013. The two mesoscale vortices were observed from 1800 UTC 17 July to 0600 UTC 18 July. Compared with the scope of SWV (Bao and Li, 1985), the location of vortex-A was only 1∘ N of SWV. Therefore, further study is required on whether vortex-A belonged to SWV. At 0600 UTC 18 July 2013, vortex-A began to move to the northeast, and vortex-B moved south. Similar weather patterns were also present in the ERA-Interim dataset.
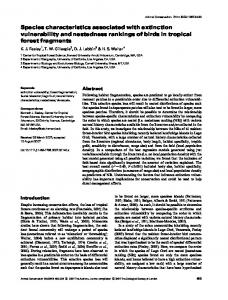
3.2. Simulation of the binary mesoscale vortex structure Many studies, including two major TP scientific field experiments in 1979 and 1998 (Xu and Chen, 2006), have examined the formation and development of SWVs (Li et al., 2014). Figure 3 shows the two mesoscale vortices simulated by WRF at 0600, 1800, and 2100 UTC 17 July, and at 0300, 0500, and 0800 UTC 18 July 2013. The WRF model configuration, initial and lateral boundary conditions, and physical parameterization schemes were introduced as described previously. At 0600 UTC 17 July 2013, a parent mesoscale vortex was produced by WRF (Figure 3(a)). Twelve hours later at 1800 UTC 17 July, the parent mesoscale vortex split into two mesoscale vortices (‘A’ and ‘B’). Meso-𝛽-scale vortex-A was located over the northeast of Sichuan Province, and mesoscale vortex-B was located over the south of the province. Vortex-A began to form from 1800 UTC 17 July 2013, and then merged to another low system (labeled ‘L’) at 0500 UTC 18 July 2013. The lifespan of vortex-A was about 11 h. Mesoscale vortex-B began to form at 0600 UTC 17 July 2013, then moved southward at 0800 UTC 18 July 2013, and lasted for 26 h. The two mesoscale vortices were most apparent at 2100 UTC 17 July 2013. As both mesoscale vortices had closed
© 2017 The Authors. Atmospheric Science Letters published by John Wiley & Sons Ltd on behalf of the Royal Meteorological Society.
Atmos. Sci. Let. (2017)
Binary mesovortex structure associated with SWV
(a)
(b)
38°N
38°N
36°N
5500
34°N
4500
32°N
3500
30°N
2500
28°N 26°N 24°N 94°E
97°E
100°E
103°E
106°E
109°E
36°N 34°N
28°N
500
26°N 24°N 94°E
(d)
38°N
38°N
5500
34°N
4500
32°N
3500
30°N
2500
28°N
1500
26°N 24°N 94°E
500
97°E
100°E
103°E
106°E
109°E
112°E
3500
30°N
(c)
36°N
4500
32°N
1500
112°E
5500
2500
1500
500
97°E
100°E
103°E
106°E
109°E
112°E
36°N
5500
34°N
4500
32°N
3500
30°N
2500
28°N
1500
26°N 24°N 94°E
500
97°E
100°E
103°E
106°E
109°E
112°E
Figure 2. Synoptic conditions of 700-hPa geopotential heights (blue contours, units: gpm) and flow field analyzed from FNL data at (a) 1200 UTC 17 July, (b) 1800 UTC 17 July, (c) 0000 UTC 18 July, and (d) 0600 UTC 18 July 2013. Shading shows the terrain of Sichuan Basin (units: m) and the value of 3080 gpm in black contour is used to highlight the binary vortex structure. The symbols ‘A’ and ‘B’ in panels (b) and (c) denote centers of the binary vortices, respectively.
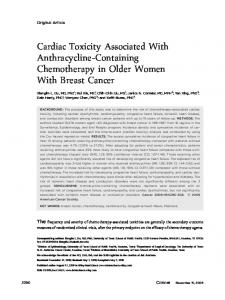
isolines, they should be considered as two mesoscale vortices associated with the developing SWV, as shown in Figure 3(c). Fu et al. (2014a) proposed that 88.5% of the detected SWVs caused rainfall. In heavy rainfall, an oblique meso-𝛽-scale vortex appears frequently in the interior of the SWV (Gu et al., 2008). Figure 4 shows the observed and WRF-simulated hourly precipitation. The two rainbelts (‘A’ and ‘B’) for the observed and WRF-simulated precipitation are separated in space (Figure 4). The differences between them, including the location and the strength, were beyond the scope of this study. Rainbelt-A was located roughly to the south of vortex-A, and rainbelt-B to the south of vortex-B, which further demonstrates that the two mesoscale vortices (Figure 3) were two separate features. To investigate the vertical structure of these binary vortices, Figure 5 shows the vertical cross-section of the WRF-simulated potential pseudo-equivalent temperature and vertical motion between the center points of A and B. At 0600 UTC 17 July 2013, there was a strong
upward motion center between the vortices; however, the two centers were observed in the typical time of the two mesoscale vortices. Furthermore, two warm and moist centers also existed above vortices A and B. These two warm and moisture centers lasted until 0800 UTC 18 July 2013, although vortices A and B had changed by this time.
3.3. Potential mechanism for the generation and maintenance of the binary mesoscale vortices Based on the geostrophic adjustment theory (Blumen, 1972), mesoscale mass fields tend to adjust to wind fields. At 0600 UTC 17 July 2013 (Figure 3(a)), an extensive area of positive relative vorticity was produced by WRF over Sichuan Province. After a few hours, two closed mesoscale vortices began to emerge as a result of geostrophic adjustment. This situation continued until 0500 UTC 18 July 2013 (Figure 3(e)). Following the movements of the relative vorticity centers, vortex-A merged with another low system, L, in the northeast of Sichuan Province, and vortex-B moved to
© 2017 The Authors. Atmospheric Science Letters published by John Wiley & Sons Ltd on behalf of the Royal Meteorological Society.
Atmos. Sci. Let. (2017)
K. Zhou et al.
(a)
(b)
38°N
38°N
36°N
25
34°N
20
32°N
15
30°N
10
28°N
5
26°N 24°N 94°E
0 97°E
36°N 34°N
38°N
30°N 28°N 26°N 24°N 94°E
97°E
50
36°N
40
34°N
30
32°N
20
30°N
10
28°N
0
26°N 24°N 94°E
100°E 103°E 106°E 109°E 112°E
(e)
(f)
38°N
38°N
36°N
30
34°N
24
32°N
18
30°N
12
28°N
6
26°N 24°N 94°E
0 97°E
100°E 103°E 106°E 109°E 112°E
8
26°N
38°N
32°N
16
28°N
(d)
34°N
24
30°N
(c) 36°N
32
32°N
24°N 94°E
100°E 103°E 106°E 109°E 112°E
40
0 97°E
100°E 103°E 106°E 109°E 112°E
40 32 24 16 8 0 97°E
100°E 103°E 106°E 109°E 112°E
36°N
25
34°N
20
32°N
15
30°N
10
28°N
5
26°N 24°N 94°E
0 97°E
100°E 103°E 106°E 109°E 112°E
Figure 3. Composite simulated relative vorticity (shadings, units: 10−5 s−1 ), 700-hPa geopotential heights (red contours, units: gpm), and wind field (blue barbs, units: m s−1 ) at (a) 0600 UTC 17 July, (b) 1800 UTC 17 July, (c) 2100 UTC 17 July, (d) 0300 UTC 18 July, (e) 0500 UTC 18 July, and (f) 0800 UTC 18 July 2013. The value of 3075 gpm in black contour is used to highlight the binary vortex structure. The symbols ‘A’ and ‘B’ denote centers of the binary vortices, whereas the symbol ‘L’ in panels (d) and (e) denotes the center of another low system. Blank area in the upper left denotes the topography over 3000 m.
the south of the province. The mesoscale cyclonic flows played an important role in the formation of the binary vortices associated with SWV.
4. Discussion and conclusion The SWV is often associated with extreme weather, especially with heavy rain. The severity of heavy
precipitation caused by SWV is second only to that caused by tropical cyclones in China (Wang et al., 1996). Due in part to the fact that their spatial and temporal scales are too small to be captured by the conventional observational network, the two mesoscale cyclonic vortices were difficult to observe in the relatively coarse data. However, the more distinguishable structures of the two mesoscale closed cyclonic vortices could be demonstrated with the
© 2017 The Authors. Atmospheric Science Letters published by John Wiley & Sons Ltd on behalf of the Royal Meteorological Society.
Atmos. Sci. Let. (2017)
Binary mesovortex structure associated with SWV
(a)
(b)
38°N
38°N
36°N
17
34°N
14
32°N
11
30°N
8
28°N
5
26°N 24°N 94°E
2
36°N 34°N
(d)
22
32°N
17
30°N
12
28°N
7
26°N 24°N 94°E
2
32°N
8
30°N
6
28°N
4
26°N 24°N 94°E
2 97°E 100°E 103°E 106°E 109°E 112°E
8 6
28°N
4
26°N
38°N
10
10
30°N
(e)
34°N
12
32°N
38°N 12
97°E 100°E 103°E 106°E 109°E 112°E
34°N
(f)
36°N
2
36°N
24°N 94°E
97°E 100°E 103°E 106°E 109°E 112°E
8
26°N
38°N
34°N
14
28°N
(c)
27
20
30°N
38°N 36°N
26
32°N
24°N 94°E
97°E 100°E 103°E 106°E 109°E 112°E
32
2 97°E 100°E 103°E 106°E 109°E 112°E
36°N
32
34°N
26
32°N
20
30°N
14
28°N
8
26°N 24°N 94°E
2 97°E 100°E 103°E 106°E 109°E 112°E
Figure 4. Composite observed precipitation (shadings, units: mm) and simulated precipitation (blue contours, units: mm) for 1 h ending at (a) 0600 UTC 17 July, (b) 1800 UTC 17 July, (c) 2100 UTC 17 July, (d) 0300 UTC 18 July, (e) 0500 UTC 18 July, and (f) 0800 UTC 18 July 2013. The symbols ‘A’ and ‘B’ in panels (b)–(e) denote centers of rainbelt.
WRF model. In this case, meso-𝛽-scale vortex-A began to form at 1800 UTC 17 July 2013, and was maintained until 0500 UTC 18 July 2013. Vortex-B occurred at 0600 UTC 17 July 2013, and ended at 0800 UTC 18 July 2013. The spatial scale of vortex-B was larger than that of vortex-A, and the lifespan of vortex-A was shorter than that of vortex-B. From generation to dissipation, vortex-A lasted approximately 11 h, whereas vortex-B persisted for about 26 h. The mesoscale cyclonic circulation makes an important
contribution to the formation of the binary vortices. To satisfy the quasi-geostrophic balance of the two mesoscale cyclonic circulations, the binary mesoscale vortex structure associated with SWV was generated and maintained. Questions still remaining for future work include whether vortex-A belongs to the SWV, whether vortex-B is responsible for the generation and maintenance of vortex-A, and how vortex-B and vortex-A interact with each other.
© 2017 The Authors. Atmospheric Science Letters published by John Wiley & Sons Ltd on behalf of the Royal Meteorological Society.
Atmos. Sci. Let. (2017)
K. Zhou et al.
(a)
(b)
(c)
(d)
(e)
(f)
Figure 5. Vertical profile of simulated potential pseudo-equivalent temperature (shadings, units: K), and vertical velocity (black contours, units: m s−1 ) along the connection line of A and B at (a) 0600 UTC 17 July, (b) 1800 UTC 17 July, (c) 2100 UTC 17 July, (d) 0300 UTC 18 July, (e) 0500 UTC 18 July, and (f) 0800 UTC 18 July 2013. The symbols ‘A’ and ‘B’ in panels (a)–(f) denote warm centers of the binary vortices. The location of the binary vortices is shown by the heavy lines at the bottom.
Acknowledgements This work was jointly supported by the State Key Program of National Natural Science of China (91337215, 41575059), the Applied Basic Research Programs of the Sichuan Provincial Department of Science and Technology (2015JY0109) the Opening Foundation of Chongqing Meteorological Bureau Grants KFJJ-201102 and YU-XM-2011030, the China Special Fund for Meteorological Research in the Public Interest (GYHY201406020), Special Fund for Climate change (CCSF201706), and Special Fond for Development of weather forecasting key technologies (YBGJXM(2017)03-13).
Supporting information The following supporting information is available: Figure S1. Synoptic conditions of 700-hPa geopotential heights (black contours, units: gpm), wind field (vectors, units: m s−1 ) and 500-hPa geopotential heights (green contours, units: gpm) analyzed from FNL data at (a) 1200 UTC 17 July, (b) 1800 UTC 17 July, (c) 0000 UTC 18 July, and (d) 0600 UTC 18 July 2013. The value of 3080 gpm in red contour at 700 hPa is used to highlight the binary vortex structure. The symbols ‘A’ and
© 2017 The Authors. Atmospheric Science Letters published by John Wiley & Sons Ltd on behalf of the Royal Meteorological Society.
Atmos. Sci. Let. (2017)
Binary mesovortex structure associated with SWV
‘B’ in panels (b) and (c) denote centers of the mesoscale vortices, respectively. Blue shading shows topography more than 3000 m.
References Bao CL, Li SC. 1985. Preliminary study on the formation of southwest vortex (in Chinese). Meteorological Monthly 11: 2–6. Blumen W. 1972. Geostrophic adjustment. Reviews of Geophysics and Space Physics 10: 485–528. Chen ZM, Miu Q, Min WB. 1998. A case analysis on mesoscale structure of severe southwest vortex (in Chinese). Journal of Applied Meteorological Science 9: 273–282. Davis CA, Trier SB. 2007. Mesoscale convective vortices observed during BAMEX. Part I: kinematic and thermodynamic structure. Monthly Weather Review 135: 2029–2049. Dudhia J. 1989. Numerical study of convection observed during the winter monsoon experiment using a mesoscale two-dimensional model. Journal of the Atmospheric Sciences 46: 3077–3107. Ek MB, Mitchell KE, Lin Y, Rogers E, Grunmann P, Koren V, Gayno G, Tarpley JD. 2003. Implementation of Noah land surface model advances in the National Centers for Environmental Prediction operational mesoscale Eta model. Journal of Geophysical Research: Atmospheres 108: 8851. Fu SM, Yu F, Wang DH, Xia RD. 2013. A comparison of two kinds of eastward-moving mesoscale vortices during the mei-yu period of 2010. Science China Earth Sciences 56: 282–300. Fu SM, Zhang JP, Sun JH, Shen XY. 2014a. A fourteen-year climatology of the southwest vortex in summer. Atmospheric and Oceanic Science Letters 7: 510–514. Fu SM, Li WL, Sun JH, Zhang JP, Zhang YC. 2014b. Universal evolution mechanisms and energy conversion characteristics of long-lived mesoscale vortices over the Sichuan Basin. Atmospheric Science Letters 16: 127–134. Gu QY, Zhou CH, Qing Q, Zhang J. 2008. Mesoscale characteristics analysis of severe torrential rain caused by a southwestern low vortex process (in Chinese). Meteorological Monthly 34: 39–47. Hong SY, Noh Y, Dudhia J. 2006. A new vertical diffusion package with an explicit treatment of entrainment process. Monthly Weather Review 134: 2318–2341. Huang FJ. 1986. A composite analysis of the southwest vortex (in Chinese). Chinese Journal of Atmospheric Sciences 10: 402–408. Janji´c ZI. 2002. Nonsingular implementation of the Mellor–Yamada level 2.5 scheme in the NCEP Meso model. NCEP Office Note No. 437; 61 pp. Jiang XW, Li YQ, Zhao XB, Koike T. 2012. Characteristics of the summertime boundary layer and atmospheric vertical structure over the Sichuan Basin. Journal of the Meteorological Society of Japan 90: 33–54. Kain JS. 2004. The Kain–Fritsch convective parameterization: an update. Journal of Applied Meteorology 43: 170–181. Kuo YH, Cheng LS, Anthes RA. 1986. Mesoscale analyses of the Sichuan flood catastrophe, 11–15 July 1981. Monthly Weather Review 114: 1984–2003.
Kuo YH, Cheng LS, Bao JW. 1988. Numerical simulation of the 1981 Sichuan flood. Part I: evolution of a mesoscale southwest vortex. Monthly Weather Review 116: 2481–2504. Li J, Du J, Zhang DL, Cui CG, Liao YS. 2014. Ensemble-based analysis and sensitivity of mesoscale forecasts of a vortex over southwest China. Quarterly Journal of the Royal Meteorological Society 140: 766–782. Lu JH. 1986. Introduction to the Southwest Vortices (in Chinese). China Meteorological Press: Beijing; 276 pp. Menard RD, Fritsch JM. 1989. A mesoscale convective complex-generated inertially stable warm core vortex. Monthly Weather Review 117: 1237–1261. Mlawer EJ, Taubman SJ, Brown PD, Iacono MJ, Clough SA. 1997. Radiative transfer for inhomogeneous atmospheres: RRTM, a validated correlated-k model for the longwave. Journal of Geophysical Research: Atmospheres 102: 16663–16682. Orlanski I. 1975. A rational subdivision of scales for atmospheric processes. Bulletin of the American Meteorological Society 56: 527–530. Tao SY. 1980. Rainstorms in China (in Chinese). Science Press: Beijing; 225 pp. Tao SY, Ding YH. 1981. Observational evidence of the influence of the Qinghai–Xizang (Tibet) Plateau on the occurrence of heavy rain and severe convective storms in China. Bulletin of the American Meteorological Society 62: 23–30. Thompson G, Field PR, Rasmussen RM, Hall WD. 2008. Explicit forecasts of winter precipitation using an improved bulk microphysics scheme. Part II: implementation of a new snow parameterization. Monthly Weather Review 136: 5095–5115. Wang B. 1987. The development mechanism for Tibetan Plateau warm vortices. Journal of the Atmospheric Sciences 44: 2978–2994. Wang B, Orlanski I. 1987. Study of a heavy rain vortex formed over the eastern flank of the Tibetan Plateau. Monthly Weather Review 115: 1370–1393. Wang QW, Tan ZM. 2014. A numerical simulation study of a heavy rain event induced by a southwest vortex. Journal of Geophysical Research: Atmospheres 119: 11543–11561. Wang W, Kuo YH, Warner TT. 1993. A diabatically driven mesoscale vortex in the lee of the Tibetan Plateau. Monthly Weather Review 121: 2542–2561. Wang ZS, Wang Y, Liang Y. 1996. A numerical simulation study of a heavy rain event induced by a southwest vortex (in Chinese). In Experimental, Synoptical and Dynamical Studies of Heavy Rain. China Meteorological Press: Beijing; 257–267. Wu GX, Chen SJ. 1985. The effect of mechanical forcing on the formation of a mesoscale vortex. Quarterly Journal of the Royal Meteorological Society 111: 1049–1070. Xu XD, Chen LS. 2006. Advances of the study on Tibetan Plateau experiment of atmospheric sciences (in Chinese). Journal of the Applied Meteorological Science 17: 754–772. Yu SH, Gao WL, Xiao DX, Peng J. 2016. Observational facts regarding the joint activities of the southwest vortex and plateau vortex after its departure from the Tibetan Plateau. Advances in Atmospheric Sciences 33: 34–46. Zhao SX, Fu SM. 2007. An analysis on the southwest vortex and its environment fields during heavy rainfall in eastern Sichuan Province and Chongqing in September 2004 (in Chinese). Chinese Journal of Atmospheric Sciences 31: 1059–1075.
© 2017 The Authors. Atmospheric Science Letters published by John Wiley & Sons Ltd on behalf of the Royal Meteorological Society.
Atmos. Sci. Let. (2017)


![Estrogen receptor-[alpha] is associated with the ... - Wiley Online Library](https://m.moam.info/img/260x300/estrogen-receptor-alpha-is-associated-with-the-wil_5ac9950c1723dd35614129c1.jpg)


