concentration and viability point sensors. Sylvie Buteau*a, Jean-Robert Simarda, Susan Rowsellb, Gilles Roya a Defence R&D Canada â Valcartier, 2459 boul.
Bioaerosol standoff detection and correlation assessment with concentration and viability point sensors Sylvie Buteau*a, Jean-Robert Simarda, Susan Rowsellb, Gilles Roya Defence R&D Canada – Valcartier, 2459 boul. Pie-XI Nord, Québec, Québec, G3J 1X5; b Defence R&D Canada – Suffield, PO Box 4000, Station Main, Medicine Hat, Alberta, T1A 8K6 a
ABSTRACT A standoff bioaerosol sensor based on intensified range-gated spectrometric detection of Laser Induced Fluorescence was used to spectrally characterize bioaerosol simulants during in-chamber and open-air releases at Suffield, Canada, in August 2008 from a standoff position. In total, 42 in-chamber Bacillus atrophaeus (formerly Bacillus subtilis var globigii; BG) cloud and 27 open-air releases of either BG, Pantoea agglomerans (formerly Erwinia herbicola; EH), MS2 and ovalbumin (OV) were generated. The clouds were refereed by different point sensors including Aerodynamic Particle Sizer (APS) and slit or impingers samplers. The APS monitored the particle size distribution and concentration and the samplers characterized the viable portion of the cloud. The extracted spectral signatures show robustness to different degree. The correlation assessment showed good results in most cases where the LIF signal to noise ratio was significant. The sensor 4σ sensitivity was evaluated to 1 300, 600, 100 and 30 ppl for BG, OV, MS2 and EH respectively. Correlation results are presented by plotting the SINBAHD metric versus the corresponding particle concentration, in which case, the obtained slope is proportional to the material fluorescence cross-section. The different acquired signal is hence compared in terms of their fluorescence cross-section additionally to their spectral characteristics. Keywords: Standoff detection, biological agent simulant, aerosol, Laser-Induced fluorescence, LIF, ppl, ACPLA.
1. INTRODUCTION The rising availability of bio-warfare materials and the considerable lethality of biological agents have led to an increasing biological threat and a growing concern for both military and civilian communities. Detection systems currently in use [1] have the ability to detect, and in some cases identify, biological agents in time to provide treatment. However, there is now emphasis to develop systems having the ability to provide early warning for the presence of such threats. Most biological detection technologies currently deployed in military operation theatres are point detection systems, which need to be located within the biological cloud to detect it, hence providing a detect-to-treat capability. This type of detector is most efficient in an indoor environment, for example, in building protection scenarios. Indeed, a given sensor will vary in performance depending on the scenario in which it is deployed. It is consequently important to select a biological detector based upon the most probable scenario. Standoff technologies are seen as the most appropriate to achieve a detect-to-warn capability in wide area monitoring scenarios. This type of capability would be an important asset for both civil and military communities. Techniques based on light detection and ranging (LIDAR) have demonstrated capabilities in detecting aerosolized biological agent simulants from a standoff distance [2]. Various approaches have been used such as spectrally resolved Ultraviolet Laser Induced Fluorescence (UV-LIF) at various wavelengths [3, 4, 5], Infrared Depolarization [6] and Long-Wave Infrared (LWIR) Differential Scattering (DISC) [7]. Defence R&D Canada (DRDC) developed, in the late 90s, a standoff bioaerosol sensor prototype based on spectrometric detection of laser-induced fluorescence (LIF). This project, called SINBAHD, demonstrated the capability of using spectral LIF to detect and characterize bioaerosols from a standoff position. In August 2008, SINBAHD was deployed for a two-week trial called Suffield BioSense Trial 2008 (SBT08) held at DRDC Suffield where different in-chamber and open-air wet releases of bioagent simulants were performed. This paper intends to report on the SINBAHD results obtained at that occasion.
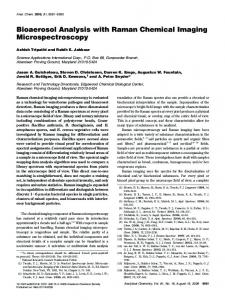
2. APPARATUS The Canadian stand-off sensor SINBAHD (Figure 1) and four different types of point sensors (Figure 2) were deployed, depending on the type of material released, during the Suffield BioSense Trial 2008. The point sensors were used for reference and correlation purposes. A Fluorescent Aerosol Particle Sensor (C-FLAPS) and an Aerodynamic Particle Sizer (APS) were collecting during all releases. Slit samplers and impingers were used for bacterial and virus/protein samples, respectively. Results from SINBAHD, the APS and the slit sampler/impingers will be presented herein. 2.1 Stand-off system: SINBAHD SINBAHD is a self-sufficient lidar system installed in a 12 m-long modified semi-trailer, complemented with a dieselpowered generator. The sensor is schematized in Figure 1. The laser source is a UV Xenon-Fluoride excimer laser (GSI Lumonix, model PM-848) emitting around 100 mJ per pulse at 351 nm and a pulse repetition frequency (PRF) of 125 Hz. A visual channel, including a beam splitter, zoom lens and CCD optically inserted in the LIDAR emitter channel, allows the precise pointing of the laser beam at the target of interest. After passing through the 3.65x beam expander, the emitter divergence (FWHM, including pointing stability) is approximately 147 μrad (width) x 308 μrad (height). An adjustable 45-degree folding square mirror (FM) is placed at the center of the telescope-collecting aperture to obtain a co-axial LIDAR transmitter. A 50 cm by 33 cm elliptical steering mirror controlled by motorized gimbals is used to select the line of sight of the LIDAR. A 30 cm diameter Newtonian telescope (Space Optics Research Labs) of 127 cm focal length collects the returned radiation and focuses it at the entrance slit of the imaging spectrometer (Oriel, model MS260i). A beam splitter (SBS) followed by a 10-nm band pass filter centered at 350 nm and a photo-multiplier tube (PM), allow sampling of the elastic scattering. This photo-multiplier is connected to a transient recorder and provides elastic scatter returns as a function of range. This information is used to configure the width and position of the intensified range-gate. This elastic scattered radiation is blocked by two UV high-pass filters before entering the spectrometer.
A)
C)
Figure 1. Schematic representation of SINBAHD prototype.
B)
D)
Figure 2. Reference sensors deployed during SBT08: A) CFLAPS, B) impingers, C) slit sampler array and D) APS.
The 300 line/mm grating in combination with the 200 μm wide entrance slit of the spectrometer would have confer a spectral resolution of 4.8 nm but was set by inadvertence to 2 mm. This larger slit yields a lower spectral resolution and a collecting FOV of 1.57 mrad. The span of 230 nm was optimized between 300 and 600 nm. The height of the slit, which has no impact on the spectral resolution but fixes the background contribution, can be adjusted from 1.2 cm down to 500 μm. An intensified CCD (ICCD) camera from AndorTM Technology detects the dispersed radiation at the exit window of the spectrometer. The 128×1024-pixels CCD array is binned vertically and from the 1024 horizontal pixels, 675 are in the intensified region. The intensifier gate is synchronized with each fired laser pulse with a delay defining the range of
the probed atmospheric cell. Between each laser pulse, the natural radiant contribution which is collected simultaneously with the fluorescence is sampled. The intensifier sensitivity combined with the 16-bit dynamic range of the camera and the spectral distribution of the collected signal over the CCD columns permit the detection of very low signal levels while retaining the spectral information. 2.2 Slit samplers The slit sampler array (Figure 2C) is used to measure the concentration of particles containing viable bacteria. The samplers draw ambient air through a slit orifice onto a rotating plate containing growth media. After the plates are incubated, bacterial colonies are counted and bioaerosol concentration is calculated as a function of time based on the plate rotation speed and intake airflow. The resulting bioaerosol viability is given in agent containing particles per litre of air (ACPLA). The high-resolution slit sampler array (SSA) consisted of 10 serially connected samplers (HF Research, custom-built), each with a rotation speed of 0.5 or 1 revolution/min providing a continuous 20- or 10-minute effective collecting period, respectively. Any biological particles present in the aerosol impact the surface of the nutrient agar plate, and after an incubation period, live particles can be counted as bacterial colonies by a plate scanner (Synbiosis Ltd., Frederick, MD). 2.3 Impingers The XMX/2L-102 (Dycor Technologies Ltd.) high-volume aerosol multi-sample collector (Figure 2B) was used to obtain impingement samples and measure the concentration of viruses or protein in the cloud. This system collects high volumes of air, strips away the large dust particles and the very small micro debris and concentrates the aerosols of interest: the respirable range. The particles are then impinged into a sample collection vial (centrifuge tube) containing customer specified liquid (sterile phosphate buffered saline). Once the samples are collected, they are transported to the lab for subsequent analysis (culturing or protein quantification). This system has the advantage of capturing high concentrations of particles from which a small aqueous aliquot is prepared for analysis with minimal dilution. 2.4 Aerodynamic Particle Sizer An aerodynamic particle sizer (APS), model 3321 (Figure 2D) from TSI was used to evaluate the particle concentration in particles per litre of air (ppl) and to extract the aerodynamic size profile of the probed particles. The APS sizes particles in the range from 0.5 to 20 micrometres using a sophisticated time-of-flight technique which measures aerodynamic diametere in real time. Because this latter parameter accounts for particle shape and is unaffected by the index of refraction or Mie scattering, it provides a better evaluation of the aerosol size distribution than other sensor based on light scattering like the C-FLAPS.
3. TRIAL METHODOLOGY SBT08 included two phases: 1) In-chamber wet releases of BG and 2) open-air crosswind releases of different types of biological agent simulants (Table 1). Both phases took place at the Colin Watson Aerosol Layout (CWAL) facility of Defence Research & Development Canada – Suffield. This section details the sample preparation, the main technical issues associated with the production of these releases and the particular trial methodology for the two trial phases. 3.1 Challenge preparation The BG used during SBT08 was obtained from Dugway Proving Ground (DPG) and is sometimes identified as “old” BG. This material was produced in 1963 and has been used historically in the testing of biological detectors. It is a dry powder that contains approximately 5% fluidizer to prevent clumping. The BG is stored dry at -20 ºC. For the chamber phase of the trial, BG was prepared in slurry with triple distilled water at a concentration of 4 mg per ml. For open air disseminations, BG was prepared as slurry with 2 or 4 grams in 20L of triple-distilled water. EH was grown in a nutrient broth fermentation system. Harvested material was unwashed. Batches averaged 2.3x10⁹ colony forming units per millilitre (cfu/ml). For dissemination, EH was either used full strength or prepared as a 1:1 dilution with triple-distilled water. The OV samples consisted of 2 grams in 20L of triple-distilled water. The MS2 consisted of 2L in 8 liters of triple-distilled water.
Table 1. Material released during Suffield BioSense Trial 2008 TYPE
MATERIAL
INFORMATION Bacillus atrophaeus (Bacillus subtilis var. niger or Bacillus globigii), powder, Batch 4, from Dugway Proving Ground (DPG), sometimes termed as ‘old BG’. Pantoea agglomerans (formerly Erwinia herbicola), wet unwashed EH in the spent media (nutrient broth), from ATCC 33243.
Bacteria spore
BG
Bacterial vegetative cells
EH
Representative of protein toxin
OV
Ovalbumin / albumin, chicken egg, Grade II A5253, powder form Sigma Chemical Co.
Representative of viral agent
MS2
Male-specific coliphage type 2 (1x10¹⁰ pfu/ml), wet
3.2 Chamber trial phase The chamber set-up is presented in Figure 3. Simulant material, a BG slurry, was placed in a syringe connected to an ultrasonic sprayer (Sono-Tek Broadband Ultrasonic Generator with ultrasonic nozzle) for dissemination within the 2m x 2m x 10m chamber. The spray is autonomously controlled by the chamber software based on a previously selected concentration level and the C-FLAPS measurement through a Proportional-Integral-Derivative (PID) control system. Once the target concentration is reached, the spray follows an on and off scheme producing an oscillatory pattern in the chamber aerosol concentration. Small fans distributed within the chamber ensure aerosol mixing and air curtains at both ends allow partial cloud confinement. The aerosol concentration within the chamber is influenced by the spray scheme (flow and duration) while the BG slurry concentration is constant. In total, 42 referenced BG releases were performed in the chamber, with concentrations ranging between 20 to 100 ACPLA; two additional high concentration (HC) releases were performed. The standoff system was located at either 205 or 994 m from the front end of the chamber, monitoring an atmospheric cell depth between 5 and 20 metres. Each acquisition was the result of 1000 integrated laser pulses and about 10 seconds were needed to perform the data acquisition cycle. For each release, SINBAHD data collection was initiated 5 to 10 minutes before the release started and ended at least 5 minutes after the release had stopped. Aerosol chamber
C-FLAPS
SINBAHD line of sight
Sono-Tek nozzle sprayer
SINBAHD
SSA or impinger APS Sprayer Wind direction
C-FAPS Weather station
Slit sampler array 100 m
APS
Figure 3. In-chamber release set-up during SBT08.
Figure 4. Open-air cross wind releases setup during SBT08.
3.3 Open-air trial phase Simulant materials were placed in an agricultural sprayer (model AU8110, MicronAir) for dissemination. The sprayer contained a reservoir with mixing capability and was operated at approximately 1 litre per minute. It should be noted that the reservoir outlet was located at the bottom, ensuring that no material was left over after the dissemination. Dedicated sprayers were used for each type of material disseminated. The sprayer was mounted on a mobile platform that moved along the circumference of a circle centered on the CWAL grid (Figure 4). This platform was moved as a function of wind direction in order to position the aerosol cloud on the grid where the reference equipment was located (Figure 2). Dissemination distances from the grid varied between 30 and 100 m in order to increase cloud concentration on the grid or simply to ensure that the cloud hit the grid under highly fluctuating wind conditions. A total of 27 (7BG, 7EH, 8OV, 5MS2) crosswind releases were performed and slit sampler or impinger reference data were obtained for all bacterial and virus/protein releases, respectively. The reference equipment was located on an elevated platform about 2 metres above the ground; the C-FLAPS was slightly lower. The close proximity of these devices was important in order to generate good spatially correlated results. The SSA and C-FLAPS were switched-on remotely. The APS acquired data continuously during the entire trial period. SINBAHD was located at ranges of about 700, and 1010 metres, monitoring an atmospheric cell depth between 5 and 20 metres. Each acquisition was the result of either 500 or 1000 integrated laser pulses and about 7/10 seconds were needed to perform the data acquisition cycle. For each release, SINBAHD data collection was initiated about 10 minutes before the release started and ended 10 minutes after the release had stopped.
4.
SPECTRAL DATA PROCESSING
A spectral signature was extracted from each releases having significant signal to noise ratio (SNR). A principal component analysis (PCA) was performed on these extracted spectral signatures to visualize the robustness and specificity of the different simulants spectral characteristics. It was followed by a multivariate analysis to extract the energetic contributions of the different released materials based on their spectral signatures. The output metric of this latter process was used to determine whether a specific material was detected or not using a detection limit criteria of four times the standard deviation (4σ) of the metric while no cloud is present. The energetic contribution metric was finally compared to the reference data from point sensors to evaluate the correlation with SINBAHD and obtain its sensitivity in concentration (ppl) or viability (ACPLA) units. The correlation results are presented by plotting the SINBAHD metric versus the corresponding particles concentration, in which case, the obtained slope is proportional to the material fluorescence cross-section. The different acquired signal can then be compared in terms of their fluorescence cross-section in addition to their spectral characteristics. 4.1 Spectral signature extraction The LIF emitted by the different species studied and the background aerosols were spectrally characterized. Each SINBAHD acquisition consisted of LIF collection from a selected window from which the ambient radiance was subtracted. The background LIF was characterized since this fluorescent component is present in all acquisitions and must be included in the multivariate analysis. The background spectral signature was obtained by filtering and normalizing the spectral average of many background LIF acquisitions, from which the naturally occurring radiance signal was subtracted. For the spectral signature of a specific released material, the naturally occurring fluorescence (obtained while the laser is not firing) was first subtracted from each LIF acquisition. The mean background LIF while no specific material is present was then calculated and subtracted from all other spectra considered to have a significant fluorescent signal originating from the released material. The resulting signals were then averaged, smoothed, and normalized in energy over a predetermined spectral range to extract a representative LIF spectrum of the aerosol cloud being probed. Even though the obtained signature extended from 375 to 597 nm, the energy normalization spectral range was limited to 425–597 nm due to the residue of the intense Raman peaks in the shorter wavelength region. For the present study, the mean signature having the highest signal to noise ratio (SNR) from all the releases for a given material was used in the multivariate analysis to optimize the detection procedure. 4.2 Multivariate analysis A model was developed [8] based on the fluorescence lidar equation [9] for representing the signal acquired by a standoff lidar sensor: dE A (λ , λ0 , r ) = n pu E 0 (λ 0 ) ⋅ ξ ( r ) 20 ⋅ toe (λ 0 ) toc (λ ) ⋅ tae (λ 0 , r ) tac (λ , r ) ⋅ ΔrN ba ( r ) σ baF (λ 0 , λ ) . dλ ba r
(1)
In Equation (1), dE/dλba is the radiated energy per unit wavelength interval, collected at wavelength λ, from a single type of bioaerosol, ba, located at a range r, when excited by npu laser pulses, each of energy E0, at a wavelength λ0. ξ is the geometrical factor; A0 is the aperture of the telescope; toe and toc are the overall spectral transmissions of the emitter and collector optics respectively; tae and tac are the atmospheric spectral transmissions over the emission and collection paths respectively; Δr is the depth of the atmospheric probed cell; Nba is the averaged density of the bioaerosol ba in that cell. Finally, assuming isotropic fluorescence, the differential fluorescent cross-section of bioaerosol can be expressed as [8]:
σ baF (λ 0 , λ ) ≡
d 2 σ baF Ψ (λ ) A ba (λ 0 , λ ) = ba 0 Pba (λ 0 , λ ) dΩdλ 4π
(2)
where Ψba(λ0) is the effective quantum yield and Aba, the effective projected area of the bioaerosol ba. Pba is the spectral probability distribution of the inelastic induced photons, which provides the classification capability. A multivariate analysis (MA) allowing to separate signals associated with the different inelastic scatters present in the collected spectra, is used to process the data [10]. This technique represents the collected inelastic spectra Eλ as a linear combination of normalized spectral signatures sisλ , which can be associated with known sources of inelastic scatters, is, and is expressed as follows:
E λ = E ba1 s baλ 1 + E ba 2 s baλ 2 + ... + E N 2 s Nλ2 + E H 2O s Hλ 2O + ... where (sisλ ) = 1
(3)
λ
λ , which are sensor-dependent, can be obtained during well-controlled short-range The bioaerosol spectral signatures, sba
releases of the bioaerosol of interest. The energetic contribution Eis included in the linear combination are adjusted to best fit, in a least-square sense the acquire signal. This process was performed using an algorithm implemented within the dedicated processing software called SINBAHD virtual [10]. 4.3 Correlation evaluation The correlation evaluation between SINBAHD metric, the energetic contribution of a given material, and reference equipments outputs was performed numerically but judged, in many cases, not statistically valid due to the nonsignificant standoff sensor signal (too low SNR) or to the limited spatial and/or temporal correlation of the released cloud sampled simultaneously by different sensors. Consequently, a visual inspection of each automatic correlation was also performed. From these correlations, SINBAHD sensitivities in ACPLA and ppl were derived. In most cases, the obtained sensitivities represent an optimum evaluation since the releases were pure, the material signatures were known a priori and used in the MA, and the background was properly characterized. The correlation results are presented by plotting SINBAHD metric, which is proportional to the collected energy (left term in Equation 1) versus the corresponding particle concentration Nba. The slope from this later graph is proportional to the material fluorescence cross-section, σF (Equation 1). Once properly normalized by the laser pulse numbers (npu), gate width (Δr) and range (r), and assuming fairly constant laser pulse energy, atmospheric transmission and geometrical factor, the different extracted slopes were compared in terms of sample fluorescence cross-section.
5.
RESULTS AND ANALYSIS
The normalized spectral signatures extracted from the data collected during SBT08 are presented in this section (5.1). Example of SINBAHD MA result correlated with a reference point sensor is then presented (5.2) followed by overall sensitivity results (5.3) and relative comparison of the different material fluorescence cross-sections (5.4). Finally the correlation between ppl and ACPLA data are presented (5.5). 5.1 Normalized spectral signatures All representative signatures that could be extracted from the releases performed during SBT08 are presented in Figure 5. From the 44 in-chamber and 7 open-air BG releases, only 18 in-chamber releases showed sufficient signal to extract a signature (yellow curves). Seven EH, seven OV and 4 MS2 signatures were also extracted and included in Figure 5, in blue, red and green respectively. It must be emphasized that SBT08 was the first trial with the new Suffield aerosol chamber and this opportunity was used to characterize the chamber behaviour under various concentration levels (around 20 up to 100 ACPLA) without considering the standoff signal level obtained. A PCA was performed on all of these extracted signatures and the 2D result version is presented in Figure 6 with the same color code. Those two later figures
show the extent and limit of the signatures robustness and specificity. The PCA result (Figure 6) illustrates the ability to classify bioaerosol clouds from their spectral LIF characteristics. The signature robustness, represented by the spreading of a material sub-set in the PCA result, is highly dependant on the SNR of the collected LIF signal, as seen in the BG case. The sample characteristics, such as origin, storage conditions, growth and preparation methods, state, dissemination process, influence to various extents the spectral characteristics and also impact on the robustness of the signature [11].
Figure 5. Normalized LIF spectral signatures of different simulants obtained by SINBAHD during SBT08.
Figure 6. Principal component analysis (2D) on the extracted signatures from numerous releases of BG, EH, MS2 and OV.
5.2 Bioaerosol cloud detection and correlation assessment Figure 7 and 8 present the visual and automatic correlation results for a chamber wet BG release (trial #06), collected with a 10-m gate at a range of 203 m. The ACPLA concentration ranged from about 70 to 90 during this release. Figure 7 also presents schematically the 4σ detection limit or sensitivity criteria which is the threshold for the binary detection operator.
Figure 7. SINBAHD MA result: amplitude of BG (solid blue) and APS data (dashed green) for release #06: 10-m BG cloud at a range of 203 m in the chamber.
Figure 8. Correlation between SINBAHD and APS during background (red) and material release (blue) for release #06: 10-m BG cloud at a range of 203 m in the chamber.
In this particular case, the standard deviation, σ, of SINBAHD metric during background was 456 and 4 times this value converted in ppl with an extracted correlation slope value of 7.33 SINBAHD unit/ppl, gives 250 ppl. This sensitivity and consequently its relative error are directly related to the background level, σ, in addition to the correlation process efficiency. Indeed, the MA results will be highly influenced by the background stability, the spectral specificity of the material versus background and by the material versus background signal level. These later aspects bring out the importance of the background characterization. Detection will indubitably always be highly dependant on the background clutter [12]. The background must hence be precisely characterized (spatially, temporally and spectrally) in order to optimize the MA results. The correlation process may also incorporate significant uncertainty on the sensitivity evaluation, especially when the SNR of both or either one sensor are low. Figure 8 presents a good correlation example for a BG release. For the three other simulant types, the correlation evaluation have higher degree of confidence with higher R-squared statistical parameter ranging from 0.5 to 0.8 following their higher SNR. From the 44 BG chamber releases, 24 had positive detection and one file was lost following software problem; 18 of 19 non-detected had concentrations level around 30 ACPLA. For the open-air releases, one file was lost (OV release) and only six releases (five BG and one MS2) were not detected over the 26 trials. The un-detected MS2 release was neither seen by the C-FLAPS and the impingers. Indeed, an additional difficulty for the open-air releases is to generate a cloud that will effectively reach the grid when confronted to variable wind speed and direction. In addition, the correlation between sensors for open-air releases will be affected by the possible non-homogeneity of the cloud in space and in time, which will increase correlation uncertainties. 5.3 Standoff sensor sensitivity Figure 9 presents the extracted sensitivities in 1-10 μm particles concentration, for all open-air releases that could be properly correlated with the APS reference sensor. A gate width and range and a pulse number normalization process based on the model presented in section 4.2 (Equation 1) was applied in order to compare the different sensitivities. Additionally, it was assumed that SINBAHD output metric follows a Poisson noise distribution (shot noise). This latter hypothesis is not rigorous but is a good approximation even for very small signal. Assuming Poisson statistics, the standard deviation of the output signal is the square root of the mean signal as well as the SNR, consequently the standard deviation of the signal, σ. The signal is however not corrected for the other parameters in Equation 1, such as the pulse laser energy, the atmospheric transmission or the transmitter alignment. It must be underlined that when comparing the 1-10 μm particles concentration sensitivities of the lidar sensor, the result is affected by the material particle size distribution since the lidar return is proportional to the aerosol projected area (Equation 2). This aspect must especially be taken into account when a non-negligible proportion of the released material is higher than 10 μm in diameter. A way to overcome this distribution dependence is to correlate the LIF signal with the projected area weighted particle concentration in μm2/l, which is not a straight forward unit such as ppl. Figure 9 shows the within group and between group variability. The sensitivity comes from the evaluation of two quantities: the standard deviation of the detection metric and the correlation factor (slope) of the sensor output with the reference. As mentioned in the previous sub-section, the correlation evaluation is not always straightforward especially when the LIF SNR is weak explaining at least partially the intra-class variability. Figure 9 shows important sensitivity differences between groups, which is related to the differences in the material cross sections and their particles sizes distribution. Figure 10 presents graphically all extracted BG sensitivities in ACPLA once normalized for a 10 second acquisition (1000 laser pulses) of a 10-m cloud located at 1 km. From the 49 referenced BG releases (42 in-chamber and 7 open-air), 40 sensitivities were extracted. In some cases, theses later were obtained from poorly correlated SINBAHD to slit sampler data. In fact, the correlation evaluation with the slit samplers was much less effective than with the APS, especially with the chamber releases and hence the extracted sensitivity values have a much higher uncertainty, which was not quantified in the present work. It must also be underlined that this overall BG sensitivity graph includes both, the chamber and open-air results, characterized by two distinct types of sprayer: the Sono-Tek and the Micronair, respectively. Even though the two sprayers have specific particle size distribution and ACPLA to ppl ratio [12], which will be presented in sub-section 5.5, no significant difference (factor 2) is observed between the two sub-groups. Sensitivities ranging from 160 to 840 ACPLA were extracted from Sono-Tek releases and 80 to 400 ACPLA from Micronair releases for a 10-m BG cloud at 1 km range and for a 10 sec acquisition. These later sensitivities are higher than previously reported values [12], which can be partially attributed to the degradation of the laser (lower laser pulse energy) that was not included in normalization process since it is not recorded in the acquisition file. The SINBAHD excimer laser was particularly unstable during SBT08. An additional aspect that can significantly influence the results is the geometrical factor, which was neither included in the normalization process. And lastly, the correlation process was
tedious in many cases, following the fairly low SNR of the collected LIF signal. Even though the background is more stable in chamber releases, the corresponding sensitivities are not better (lower), probably because of the higher uncertainties in the correlation factor evaluation.
Figure 9. SINBAHD sensitivities for various open-air releases of different simulants, SBT08 (10-m cloud at 1 km).
Figure 10. SINBAHD BG sensitivities normalized for a 10-m cloud at 1 km and 10 sec acquisition extrapolated from releases performed at different ranges with either the Sono-Tek (chamber) or Micronair (open-air) sprayer.
5.4 Relative comparison of fluorescence cross-section Figure 11 presents the correlation evaluation with the 1-10 μm particles concentration reference parameter for a few releases of each four types of simulants. Once the LIF metric is properly normalized, the correlation factor, meaning the slope, is directly proportional to the material fluorescence cross-section as expressed by the model (Equation 1).
Figure 11. Correlation evaluation between SINBAHD metric and APS data for the 4 types of simulants (BGyellow, EH-blue, OV- -red, MS2-green) tested during SBT08 (10 sec acquisition of a 10-m cloud at 1 km range).
This figure gives an appreciation of the correlation evaluation efficiency and indirect information on the SNR during these releases. For example, it can be observed that the MS2 releases did not produce a significant amount of 1 to 10 μm particles and that BG produced the weaker LIF signal for a given particle concentration, consequently BG has the lower fluorescent cross-section. Most of the slope variability comes from the S/N of the standoff system, which depends on the LIF signal level and on the background noise, including the one associated with the ambient visible radiation and the one from the background aerosol. Moreover, the correlation evaluation also adds uncertainty and increases the variability of the slope. As mentioned previously, these correlation factors are dependant on the specific particles size distribution of each material as seen by Equation 2. Therefore, a careful attention should be given to the generated particles size distribution when fluorescence cross-section or any related quantity such as the correlation slope in the present case are reported. An alternative would be to perform the correlation with the projected area weighted concentration, which would now give a slope proportional to the effective quantum yield, a scalar value independent of the particles size distribution. Based on 1-10μm particles concentration correlation, EH, MS2, OV and BG have a decreasing cross-section value. This relative order matches with the one of the USA study [13], which however did not include data on OV samples. 5.5 The correlation between ACPLA and ppl data The evaluation of the correlation between the slit samplers and the APS data was performed for each BG release that had significant concentration signal levels. The obtained ACPLA/ppl averaged ratios consisting of the ACPLA reading versus particles concentration integrated between 1 to 10 μm (ppl) (ACPLA/ppl × 100), are presented in Figure 12. Two regression results are included in Figure 12: with (filled symbols) and without (empty) a background match constrain. Indeed, since the slit samplers were only recording during the release period, no background data was collected by this particular reference sensor. For most open-air releases performed with the Micronair sprayer, there is no significant difference between the two regressions (solid versus empty circle in Figure 12) and the results range between 4 and 8%. These results are in the same order of magnitude than previous ones [11]. However, for the Sono-Tek releases (Chamber phase), the background match constrain incorporates a substantial increase: from a mean ratio of 5% without constrain to around 35% with it. Some results obtained without the background match constrain had negative ratio values (gray region) which is not theoretically possible, but were still included in Figure 12.
Figure 12. ACPLA to ppl ratios derived from correlation with either background match constrain (solid symbols) or not (empty symbols) for chamber (diamonds) and open-air (circles) BG releases performed during SBT08.
Figure 13. Correlation evaluation between ACPLA and ppl concentrations for a BG chamber release (#21) with (dashed line) and without (solid line) a background match constrain.
An example of a correlation evaluation for a Sono-Tek BG release with (dashed) and without (solid line) background match constrain is presented in Figure 13. This later figure shows that ACPLA and ppl data are correlated but their background levels are not. The ACPLA background (bck) level was set to zero based on a few slit sampler readings
during the chamber phase. This behaviour might be related to a non-linearity in the ACPLA/ppl ratio with the concentration level generated by the Sono-Tek sprayer. Specific measurements will be required to clarify this behaviour. The correlation between ACPLA and ppl data are specific to the sprayer used to perform the dissemination and also probably on the environmental conditions during which these correlation were derived. Indeed, the ACPLA output readings are highly influenced by the clumping and the agglomeration of particles, since this unit counts the number of particles that contain viable agent regardless of the number of agents present in that particle. This means that the same slurry bacterial mixture will produce higher ACPLA readings under aerosolizing conditions that minimize particle size and clumping. It must also be considered that the derived ACPLA/ppl ratios during the chamber trial phase were obtained from a few hundreds 1-10 μm ppl releases (Figure 13), providing low SNR for the APS data. These low APS SNRs generated higher uncertainty on the correlation evaluation and consequently a greater spreading in the ACPLA/ppl ratio (Figure 12), even though the chamber releases are more homogeneous and less affected by background fluctuation.
6.
CONCLUSION
During Suffield BioSense Trial 2008, SINBAHD collected the spectral characteristics of four different simulants: BG, EH, OV and MS2. In total, 44 BG chamber releases and 27 cross-wind open-air releases (7 BG, 7 EH, 8 OB and 5 MS2) were performed. The four simulants showed specificities in their spectral signatures, characterized by particular robustness. A Principal Component Analysis was performed on the extracted signatures and illustrated the classification potential of the spectral LIF for bioaerosol clouds. The extracted signatures were then used to perform a multivariate analysis (MA) on SINBAHD data to extract the bioaerosol energetic contributions based on least-squares best fit analyses. A correlation assessment was performed between this extracted SINBAHD metric and the referee point sensors outputs, allowing the evaluation of the standoff sensor 4σ sensitivity in concentration units. For releases performed with the Micronair sprayer, the 4σ sensitivity for a 10-sec acquisition of a 10-m cloud located at 1 km was evaluated to 1300, 30, 600 and 100 ppl for BG, EH, OV and MS2, respectively. The corresponding viability sensitivities are around 220 and few ACPLA for BG and EH, respectively. The extracted ACPLA sensitivities for BG releases were highly variable due to the low SNR of the standoff sensor output and the high uncertainty on the correlation factor evaluation. The correlation results were presented by plotting the SINBAHD metric versus the corresponding particles concentrations, which provide slopes proportional to the material fluorescence cross-section. The four different types of biological agent simulants had cross-section in the following increasing order: BG, OV, MS2 and EH. Finally, correlation between ACPLA and ppl sensors data with the background levels match constrain, has given ACPLA/ppl ratios around 7% and 35% for BG releases performed with Micronair and Sono-Tek sprayers respectively. In the case of EH released with the Micronair, ACPLA/ppl ratio ranged between 1 and 8%. Each release characterized by a significant SNR from both APS and slit samplers, clearly showed a correlation between the two readings. These observed correlations open the possibility of referencing biological aerosol cloud in ppl and estimating the corresponding ACPLA concentration. These estimations would however need previously characterized ACPLA/ppl ratio specific to a given material and a dissemination methodology.
7.
ACKNOWLEDGMENTS
SINBAHD has been made possible with funding originating from the Technological Investment Funds (TIF-16qd13), a Defence Research and Development Canada (DRDC) program initiated to support scientific investigation of high risk concepts but with strong potential for the Canadian defence communities. SINBAHD participation to the Suffield 2008 trial was made possible with funding originating from the BioSense Technology Demonstration Project. Furthermore, the data acquisition campaign for this article would not have been possible without the valuable trial participation of Denis Nadeau and Laurie Stadnyk.
REFERENCES [1] National Research Council, [Sensor systems for biological agent attacks], the national academies press, Washington, chap. 4 (2005). [2] Buteau, S., Lahaie, P., Rowsell, S., Rustad, G., Baxter, K., Castle, M., Foot, V., Vanderbeek, R. and Warren, R., [Final Report for NATO RTO SET098 RTG-55 on Laser based stand-off detection of biological agents], NATO Research and Technology Organisation, Belgium, 82p. (2010).
[3] Simard, J.-R., Buteau, S., Lahaie, P., Mathieu, P., Roy, G., Larochelle, V., Déry, B., McFee, J and Ho, J., " Wide area spectrometric bioaerosol monitoring in Canada: from SINBAHD to BioSense," International Journal of High Speed Electronics and Systems, (IJHSES), Vol. 18(3), 493-504 (2008). [4] Hopkins, J.R., Barrington, J.S., Castle, J.M., Baxter, L.K., Felton, V.N., Jones, J., Griffiths, C., Foot, V. and Risbey, K., "UV-LIF lidar for standoff BW aerosol detection," Proc. SPIE 7484, 748409.1-748409.11 (2009). [5] Farsund, O., Rustard, G., Kasen, I., Haavardsholm, V.T., "Required spectral resolution for bioaerosol detection algorithms using standoff laser-induced fluorescence measurements," IEEE Sensors Journal, 10 (3), 655-661 (2010). [6] Jee, H.S., Hwang, I.H., Lee, S., Li, G., Serino, R.M. and Prasad, C.R., "Depolarization standoff lidar for discrimination of biological warfare aerosols," Proc. 23rd Int. Laser Radar Conf., ICLAS, 4p (2006). [7] Warren, R. E. and Vanderbeek, R., "Estimation of multiple-aerosol concentration and backscatter using multiwavelength range-resolved lidar," Proc. SPIE 6756, 67560D.1-67560D.12 (2007). [8] Simard, J.R., Roy, G., Mathieu, P., Larochelle, V., McFee, J. and Ho, J., "Standoff sensing of bioaerosols using intensified range-gated spectral analysis of laser-induced fluorescence," IEEE Trans. on Geoscience and Remote Sensing, 42(4), 865-874 (2004). [9] Measures, R. M., [Laser Remote Sensing: Fundamentals and Applications], John Wiley & Sons, Inc., Chap. 7.4 (1984). [10] Simard, J.-R., Roy, G., Mathieu, P., Larochelle, V., McFee, J. E. and Ho, J., [Standoff Integrated Bioaerosol Active Hyperspectral Detection (SINBAHD): Final report], DREV TR 2002-125, 118 pp. (2003). [11] Buteau, S, Simard, J.R. and Rowsell, S., "Bioaerosols standoff detection simultaneously refereed with particle concentration (ppl) and viability units (ACPLA), " Proc. SPIE 7484, 748408.1-748408.12 (2009) [12] Carrano, J., [Chemical and Biological Sensor Standards Study], Defense Advanced Research Projects Agency, Arlington VA, 34 pp. (2005). [13] Strawbridge, J., Joint biological Standoff detection System (JBSDS): program update for the 8th SBWG meeting, presentation during the 8th Standoff Biological working Group meeting under the CANAUSUKUS MOU, July 12, 2005.