In the second stage, 0.5ml of 10% sodium tungstate was pipette into each test tube ... The ammonia then reacts with Salicylate (or phenol) nitroferricyanide and ...
Available online at www.pelagiaresearchlibrary.com
Pelagia Research Library European Journal of Experimental Biology, 2016, 6(2):43-52
ISSN: 2248 –9215 CODEN (USA): EJEBAU
Biochemical, histopathological and morphological alterations in the kidneys of wistar rats following exposure to X-ray film developer solutions Daniel C. Ugwuanyi1, Hyacienth U. Chiegwu1, Sylvester O. I. Ogbu2 and Uchenna E. Anaekwe1 1
Department of Radiography and Radiological Sciences, Nnamdi Azikiwe University, Nnewi Campus, Nnewi, Anambra State, Nigeria 2 Department of Medical Radiography, University of Nigeria, Enugu Campus, Enugu State, Nigeria _____________________________________________________________________________________________ ABSTRACT Radiographers and darkroom staff in developing countries engaged in darkroom radiography are often exposed to x-ray film processing chemicals including the developer. The possible effects of the developer have not been investigated to the best of our knowledge. This study was aimed at investigating the effects of x-ray film developer on the kidneys of wistar rats by assessing the alterations in serum urea and serum creatinine levels and the histological features. The study covered a period of 30 days and utilized 18 apparently healthy wistar rats of 16-20 weeks and weighing between 200 and 210g. The rats were randomly divided into three (3) groups-A-C, of 6 rats each. Groups A and B were the experimental groups exposed to varying concentrations of developer solutions for periods ranging from 15-30 days. Group C served as the control group exposed to no developer solution. At each desired period of time, two rats were randomly selected from each group, painlessly sacrificed, the kidneys harvested and blood sample collected and examine/analyzed at the Nnamdi Azikiwe University Teaching Hospital, Nnewi Anambra State. Results showed raised serum urea and creatinine levels which were independent of the concentration of the developer solution in the first 15 days but concentration dependent at longer exposures. Varying histological changes were also observed, including distortion of tissue interstitial architecture, hypertrophy of the Bowman’s capsule, infiltrating cell oedema and signs of necrosis. These changes point to the risks radiology workers face in the discharge of their professional duties. Key words: Kidney, Wistar rats, X-ray film developer, Serum Urea, Serum Creatinine. _____________________________________________________________________________________________ INTRODUCTION The usefulness of x-ray film developer solutions is well-known to radiology departments but the biochemistry of its exposure is almost unknown. Every darkroom- based radiology department appreciates the fact that after the x-ray exposure of the film emulsion and the formation of latent/hidden images, the next process to yield the required permanent/diagnostic images is the processing of the radiographic films which involves the development and fixing of the films. Studies showed that the developer contains many component substances which, even at low concentrations, have serious pulmonary, cardiac, gastrointestinal and also hepatic effects on animals exposed to the chemical [1-7].
43
Pelagia Research Library
Daniel C. Ugwuanyi et al Euro. J. Exp. Bio., 2016, 6(2):43-52 _____________________________________________________________________________ This study was aimed at investigating the effects of x-ray film developer solution on the kidneys of wistar rats exposed to varying concentrations of the chemical for varying periods of times and conditions. This is important in view of the fact that the kidney is one of the primary sites of drug toxicity [8]. Acute renal failure is a common disease and is associated with high morbidity and mortality rates [8, 9-10]. Investigations revealed increasing prevalence and severity of renal dysfunctions in recent times with an increase of 115% noted in the number of dialysis patients in Brazil between 2000 and 2010, and a total of about 91,314 patients in 2011 with more than 77,000 patients undergoing hemodialysis as replacement therapy for kidney function in 2009[11]. The situation could be the same or even worse in some other countries especially in developing countries where lack of medical facilities precludes early diagnosis and /or treatment of many diseases. Researches are usually carried out using animals and are very important in understanding the pathophysiology of several diseases yielding results that can be extrapolated to humans and has the advantages of avoiding risks associated with direct experimentation with humans. Although there are many other waste products that can be used to evaluate kidney diseases, urea(Blood Ureaa Nitrogen, BUN/ Serum Urea Nitrogen, SUN) and creatinine are the most convenient to track [12]. Urea and creatinine are used to evaluate kidney functions in a wide range of circumstances to diagnose renal diseases and to monitor people with acute or chronic renal dysfunction or renal failure. Urea is a waste product formed in the liver when protein is metabolized. It is carried to the kidneys from where it is filtered out of the blood into urine. Urea level in blood rises when there is kidney disease or damage which prevents the kidneys from filtering urea out of the blood. The functional unit of the kidney is the nephron. It contains numerous glomeruli (singular,glomerulu). The glomerulus is a microscopic cluster of looping blood vessels contained in each nephron of the kidney through which blood is filtered. It allows passage of water and small molecules but retains blood cells and larger molecules. Attached to each glomerulus is a tubule that collects the fluid and molecules that pass through the glomerulus and then reabsorb any that can be used by the body but pass out the rest as waste in urine. Increased level of serum urea is suggestive of impaired renal function, which could be due to acute or chronic kidney disease, damage or failure, or due to conditions that result in decreased blood flow to the kidney such as congestive cardiac failure, shock, stress, recent heart attack or severe burns or due to conditions that cause obstruction of urine flow or due to dehydration [13]. Elevation of urea level can also occur due to increased dietary protein or gastrointestinal bleeding [13]. Serum creatinine is a waste product from breakdown of dietary protein and muscle protein from muscle injury. Increase in serum creatinine level is also indicative of kidney injury. A more precise measure of the kidney function can be estimated by calculating how much creatinine is cleared from the body by the kidneys. This is referred to as creatinine clearance and it estimates the rate of filtration by kidneys (glomerular filtration rate, GFR) [14]. It compares the creatinine levels in blood and urine(normal values being about 97-137ml per minutes, for adult male and about 88-128ml per minutes for female). Creatinine clearance (CrC) can be measured either directly by comparing the creatinine levels in blood to the creatinine level in a 24 hour urine sample, or by using the formular: Male:
Female:
CrC
CrC
=
=
140 - A x Wt 72 x SCr
140 - A x 0.85 x Wt 72 x SCr
Where, CrC = Creatinine clearance (mg/dL) A = Patient’s age (years) Wt = Patient’s weight (Kg) SCr = Serum creatinine 140, 72 and 0.85 are constants [14].
44
Pelagia Research Library
Daniel C. Ugwuanyi et al Euro. J. Exp. Bio., 2016, 6(2):43-52 _____________________________________________________________________________ Recent discovery revealed that elevated creatinine levels in infants were associated with bacteremia while elevated levels in adult males have been linked to increased risk of prostate cancer [14]. This study investigated the physiological and morphological renal changes in wistar rats exposed to different concentrations of freshly prepared x-ray film developer solutions for various periods of time and under different conditions of exposure. The result obtained will provide an idea of the possible renal risks to which radiology staff and darkroom personnel are exposed in the course of carrying out their professional duties. MATERIALS AND METHODS The experimental research design was used for this study. The research was carried out between 15th June and 15th July, 2014. Before commencing the study, ethical approval was obtained from the Research and Ethical Approval Committee of the Faculty of Health Sciences and Technology, Nnamdi Azikiwe University, Nnewi Campus, Nnewi, Anambra State, Nigeria. Eighteen (18) apparently healthy wistar rats (Rattus norvegicus) of 20-24 weeks and weighing between 200g and 210g were obtained from the animal farm of Nnamdi Azikiwe University, Nnewi Campus and used for the study. These rats were randomly divided into three groups (A, B and C) of six rats each. Rats in group A were the experimental groups exposed to full concentration of the developer solution. Rats in group B were the experimental group exposed to half concentration of the developer solution while the rats in group C, served as the control group that were not exposed to developer solution. Each group of rats was put in a labeled metal cage and observed for seven days to acclimatize in their new environment before the start of the study. Materials used for the study included 3metal cages, bell jar, weighing balance, dissecting set, an electron microscope, 5ml syringes, palletized vital feed growers produced by Grand Cereals Limited, water, feeding and water troughs, 10% formalin, cotton gauze, surgical gloves, chloroform, plain sample bottles, 500g weight developer powder, 10litre water tank, 50ml measuring jug, 3 small(3litre) plastic bowels. Experimental Procedure A full concentration of the developer solution (0.05g per cm3 was prepared by dissolving the 500g packet of developer powder in 10litres (10,000cm3) of water. 5000cm3 of the prepared developer solution was then diluted by equal volume of water to obtain a developer solution with half the concentration of the original solution(0.025g per cm3). Wistar rats in the experimental group A were exposed to the fumes from the full concentration developer solution contained in a plastic bowel placed close to the cage harbouring them. By the same method, the rats in the experimental group B were exposed to the fumes from the developer solution of half concentration. The rats in the control group, C were not exposed to any developer solution fumes. The cages harbouring the rats were kept in different rooms of a house. The rats were fed with water and Vital Feeds Growers palletized for feeding the rats as recommended by the manager of the animal house from where they were obtained. The rats were made to experience 12:12 hour light: darkness. On the 15th day of the experiment, two rats were randomly selected from each group for dissection. Before dissecting the rats, each was weighed and their weights noted. Each of the rats was then anesthetized by placing it in a plastic bell jar with a wire mesh floor over gauze moistened with chloroform and observed for signs of decreased motility and unsteady gait for about 20seconds. Each rat was then taken out of the bell jar and painlessly sacrificed. Using aseptic technique, each rat was dissected by making a midline incision on the ventral aspect from the thoracic region to the abdomen. The kidneys of each rat were then harvested, preserved in 10% formalin in a plain sample bottle. Using a 5ml syringe blood samples were also collected from each sacrificed rat by cardiac puncture and discharged into plain sample bottles and centrifuged to obtain the serum. The kidney specimen and blood samples were properly identified and sent for examination and analysis at the Medical Laboratory Sciences department of the Nnamdi Azikiwe University Teaching Hospital Nnewi. On that same 15th day, two rats were randomly selected from each of the experimental groups (A and B) for pharyngeal aspiration with the respective developer solutions. Before aspirating the rats with the developer solutions, the rats were weighed and labeled A1, A2, B1, and B2. To aspirate the rats with the developer solutions, each rat was anesthetized using the same procedure described earlier for the rats sacrificed above. Each rat was then brought out of the bell jar. Using a 5ml syringe each rat was aspirated with 0.5ml of the solution: rats A1 and A2, with the full strength developer solution and rats B1 and B2, with the half strength developer solution. To instill the
45
Pelagia Research Library
Daniel C. Ugwuanyi et al Euro. J. Exp. Bio., 2016, 6(2):43-52 _____________________________________________________________________________ solution, the mouth of the rat was opened. The tongue was pulled to a side using a swap stick and the solution was introduced to pass down through the pharynx. The aspirated rats were then kept on a slab and observed to recover from the effects of the anesthesia and were put back into their respective cages where they stayed and continued with the non-aspirated rats in the group to the end of the experiment. On the 30th day (end of the experiment) all the rats in each group were painlessly sacrificed after anesthetizing with chloroform as described earlier for the rats sacrificed on the 15th day. Using the same procedure as on the 15th day, all the rats were dissected, blood samples collected and the kidneys harvested for examination and analysis. The blood and kidney specimen were properly labeled according to their groups and mode of exposure to the developer solutions (ie inhalation only or inhalation plus aspiration) and then sent to the Medical Laboratory Sciences department of Nnamdi Azikiwe University Teaching Hospital for examination and analysis of the biochemical changes in the blood and the histological and morphological changes in the kidney tissues. Tissue Preparation and Processing The kidney tissues were cut into thin slices of 3-5mm thick and 1cm long and studied under an electron microscope. The microscopic appearance was first observed for irregularities in shape, consistency, colour, firmness and presence of lesions and ulcers. The tissues were also measured (length x breadth x height), weighed. After microscopic examination, the small pieces of tissues (3-5mm thick and 1cm long) were cut and put into labeled tissue cassettes and preserved in 10% formalin before processing. Manual tissue processing was done by immersing the tissues into a 10% formalin bath for 1hour after which they were passed through 70%, 90% and 95% absolute alcohol I, II and III for 2hours each and absolute alcohol IV overnight to dehydrate the tissues completely. On removing the tissues from the absolute alcohol, the tissues were passed through three changes of xylene (I, II, III) for 1hour 30minutes each to remove the alcohol. The tissues were then impregnated with paraffin wax by passing them through two wax baths (I and II) for 2hours and 1hour respectively. This was followed by the tissues being embedded in molten paraffin wax in a mould. This was achieved by using a heated forceps to orient the tissue in the mould until it lay in the desired plane. The corresponding labels (I and II) were transferred from the paraffin wax bath and placed against the side of the mould adjacent to the tissue. The mould was then transferred to ice block to solidify. On solidification, the tissue block was removed from the mould and attached to a wooden block using a heated knife. Sectioning the tissue block Prior to sectioning the tissue block, the tissue block was trimmed to expose the surface of the tissue by adjusting the microtome knife to 10µm. The wooden block to which the tissue block was attached was then placed in the block holder in the microtome parallel to the microtome knife. Sections were then cut with the rotary microtome and the ribbons were placed onto 20% alcohol on a large (5cm x 7.5cm) slices to remove minor folds and creases from the sections. The ribbon was gently placed on a water bath preheated to about 45oC so as to float out the tissue. Using a clean slide, the tissue was collected, allowed to dry and then labeled using diamond pencil. The slide was then placed on a hot plate at 5oC for the tissue to adhere to the slide. Staining the tissue sections Erhlich’s haematoxylin and Eosin staining technique [15] was used to stain the sectioned tissue for demonstration of the general tissue structure. The slides were taken to water and stained for 20minutes in Erhlich’s haematoxylin. The stained slides were then washed in distilled water with agitation for 10minutes after which they were differentiated in 1% acid alcohol for few seconds and then blued in Scott’s tap water for 2minutes. This was followed immediately by counter staining in 1% aqueous eosin for 2minutes. The stained slides were rinsed in water for 30seconds, then dehydrated in ascending grades of alcohol (70%, 90% and 95% absolute I and II) for 2minutes each. The stained slides were then cleared in xylene and mounted in dibutylphthalate polystene xylene (DPX). Microscopy and photomicrography Microscopic examination of the cut sections was carried out using Swift binocular microscope with in-built lighting system. Sections with striking features were selected for photomicrography using Olympus photomicroscope with coloured films. Results were expressed in terms of observed physical/behavioural changes in the rats, biochemical and histological/morphological changes in the kidney tissues.
46
Pelagia Research Library
Daniel C. Ugwuanyi et al Euro. J. Exp. Bio., 2016, 6(2):43-52 _____________________________________________________________________________ BIOCHEMICAL ANALYSIS Serum Creatinine Serum creatinine is estimated using Jaffe Slot’s Akaline Pictrate method [16] Principle: In an alkaline medium (and the creatininase enzyme) serum creatinine reacts with picric acid to produce creatinine pictrate with orange/red colour which can be measured spectrophotometrically and the intensity of the colour is directly proportional to the concentration of creatinine in the serum sample. The procedure is in two stages. In the first stage, two test tubes labeled ‘TEST’ and ‘BLANK’ were set up. About 500µl serum sample was pipetted into the TEST test tube. Then 1.5ml distilled water was added to the TEST test tube and 2.0ml distilled water to the BLANK test tube. This was followed by 0.5ml of 2/3NH2SO4 and 0.5ml of 10% sodium tungstate added to each of the test tubes. The tubes were then centrifuged for 5minutes and the supernatant solution in each tube was collected. In the second stage, 0.5ml of 10% sodium tungstate was pipette into each test tube followed by 0.5ml picric acid. Then 0.5ml of 0.7N NaOH was added and the set up was incubated for 20minutes at room temperature after which the result was read at 520nm. The concentration of the TEST was then calculated using the formula: TEST conc . = TEST absorb. x STD conc . STD absorb where TEST conc, = Concentration of the Test TEST absorb.=Absorbance of the Test STD conc. = Concentration of the Standard STD absorb = Absorbance of the Standard. Serum Urea Serum urea is estimated using the Berthelot Reaction [17-18] Principle: Serum urea, in the presence of urease enzyme is hydrolyzed to ammonia and carbamic acid with the carbamic acid spontaneously decomposing to ammonia and carbon dioxide. Urease Urea + H2O
NH3
+
CO2
The ammonia then reacts with Salicylate (or phenol) nitroferricyanide and alkaline solution of hypochlorite to yield a blue-green chromophore (indophenols) which absorbance can be measured photometrically and is directly proportional to the concentration of urea in the serum sample. Nitroprusside NH3 + Salicylate
2-2-Dicarboxyl Indophenol (blue-green). Hypochlorite
In the procedure, three test tubes labeled: TEST, STANDARD and BLANK were set up with 10µl of serum sample added to each. Distilled water was then pipette to each test tube. Reagent 1 (phenol) (50µl) was pipette into each test tube, mixed and incubated for 10minutes at 37oC. Then reagent2 (1.5ml) urease enzyme was pipette into each test tube, followed by 1.5ml of reagent 3(sodium hydroxide/sodium hypochlorite solution). They were then properly mixed and incubated for 15minutes at 37oC. The absorbance was then read at 540nm against the blank. The concentrate of the TEST was calculated using the same formula used earlier for calculating the concentration of the creatinine but substituting urea for creatinine.
47
Pelagia Research Library
Daniel C. Ugwuanyi et al Euro. J. Exp. Bio., 2016, 6(2):43-52 _____________________________________________________________________________ TEST conc. = TEST absorb. x STD conc. STD absorb where TEST conc, = Concentration of the Test TEST absorb. =Absorbance of the Test STD conc. = Concentration of the Standard STD absorb. = Absorbance of the Standard. Data Analysis Statistical analysis was done using a computer package – statistical package for social sciences version 20 (SPSS version20). Analysis of variance (ANOVA) test was used to test for differences in the urea and creatinine levels among the groups of rats. Where significant difference exists, Scheffe’s test was used to find the source(s) of the difference. P-values of < 0.05 were considered statistically significant. RESULTS Towards the end of the experiment the rats in the experimental groups were observed to show alteration in physical behavior-non-significant weight loss, poor response to feeds and water, and decreased social activities. A
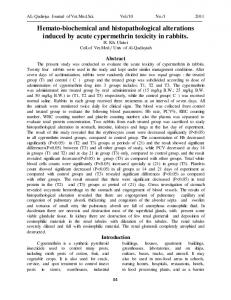
B
Plate 1. Photomicrographs of the kidney of rats showing normal tissue architecture(Mag. X200). (A-Control group, B - Experimental group)
48
Pelagia Research Library
Daniel C. Ugwuanyi et al Euro. J. Exp. Bio., 2016, 6(2):43-52 _____________________________________________________________________________
Plate 2. Photomicrograph of the kidney of wistar rats that inhaled fumes from half concentration of x-ray developer solution for 30days showing distortion of interstitial tissue architecture, hypertrophy of Bowman’s capsule, infiltrates of inflammatory cells and severe loss of tubules (Mag. X200)
Plate 3. Photomicrograph of the kidney of wistar rats that inhaled fumes from full concentration of x-ray developer solution for 30days showing distortion of interstitial tissue architecture, signs of necrosis, infiltrates of inflammatory cells and oedema(Mag. X200)
Plate 4. Photomicrograph of the renal tissue of rats in the experimental group which inhaled fumes from the half concentration of the developer solution for 30 days and also was aspirated with 0.5ml of the solution on the 15 day of the experiment, showing signs of necrosis, distorted interstitial tissue architecture and infiltrates of inflammatory oedema(Mag. X200)
Histological Photomicrographs of the renal tissue of wistar rats in the control group and the experimental group that inhaled fumes from the full concentration of developer for 15 days showed normal tissue architecture (Plate 1A and 1B).
49
Pelagia Research Library
Daniel C. Ugwuanyi et al Euro. J. Exp. Bio., 2016, 6(2):43-52 _____________________________________________________________________________ Photomicrograph of the renal tissues of the rats in the experimental groups showed histological changes such as distortion of interstitial tissue architecture, hypertrophy of the Bowman’s capsule, loss of tubules, infiltrates of inflammatory cells, oedema, thickening of basement membrane and necrosis (Plates 2, 3 and 4). Biochemical Analysis At the 15th day of the experiment, Scheffe’s test showed no significant difference (P= 0.054) in the mean serum urea levels of the kidneys of the rats exposed to the fumes from the full strength developer solution and those exposed to the half strength solution. But there was significant difference (P = 0.000) between the urea levels of rats exposed to the full strength solution and the rats in the control group and also between urea levels of rats exposed to the half strength solution and the rats in the control group(Table 2). Significant difference (P = 0.000) exists in the serum cratinine between the rats exposed to full concentration of the developer and rats exposed to half concentration of developer solution and the rats in the control group and also between rats exposed to the half concentration of developer solution and the rats in the control group(Table 2) . Table 1. Serum urea and creatinine levels of the wistar rats at varying concentrations of the developer solution and different exposure conditions Serum urea Serum creatinine (mmol/L) (mmol/L) SURK SULK SCr RK SCr LK 1 9.9 9.9 106 106 Full 2 9.8 9.9 106 106 1 10.1 10.1 108 108 15days inhalation Half 2 10.2 10.0 108 107.8 1 3.9 4.0 78 78 Control 2 4.0 4.0 78 78 1 4.3 4.2 108 108 Full 2 4.3 4.3 108 108 1 2.5 2.6 93 94 30days inhalation without aspiration Half 2 2.5 2.5 93 93 1 3.9 4.0 78 78 Control 2 4.0 4.0 78.2 78 1 4.0 4.0 78 78 Full 2 4.0 4.0 78 78 1 4.3 4.4 62.2 62.2 30days inhalation plus aspiration Half 2 4.3 4.3 62.2 63 1 4.0 4.0 78 78 Control 2 4.0 4.0 78 78 SURK=Serum urea right kidney; SULK=Serum urea left kidney SCr RK =Serum creatinine right kidney; SCr LK =Serum creatinine left kidney. Period/condition of exposure
Table 2. Period/condition of exposure
Concentration (g/cm3)
Rat no
Mean serum urea and creatinine levels and their Scheffe’s p-values
Mean serum urea Scheffe Mean serum (mmol/L) p-value creatinine (mmol/L) RK LK RK LK 0.054* Full (group A) 9.85 9.9 106 106 0.000 15 days inhalation Half (groupB) 10.15 10.05 108 107.9 (0.000)+ Control (group C) 3.95 4.0 78 78 Full 4.3 4.25 108 108 0.000 30 days inhalation without aspiration Half 2.5 2.55 0.008 93 93.5 (0.000)+ Control 3.95 4.0 78 78 Full 4.0 4.0 78 78 0.037 30 days inhalation plus aspiration Half 4.3 4.35 0.002 62.2 62.6 (0.008)+ Control 4.0 4.0 78 78 *Statistically non-significant at the 0.05 level ( )+ Scheffe’s p-value between rats exposed to half concentration of developer and the control. Concentration
Scheffe p-value 0.000 0.000 (0.000)+ .000 0.000 (0.000)+ 0.000 0.544* (0.000)+
Table 2 above also showed that there was significant difference (P < 0.05) in serum urea and serum creatinine levels between the rats that inhaled the full strength developer solution for 30 days and those that inhaled the half strength developer solution for 30days. Also there was significant difference in serum urea and serum creatinine levels of rats in the control group and rats in the experimental groups.
50
Pelagia Research Library
Daniel C. Ugwuanyi et al Euro. J. Exp. Bio., 2016, 6(2):43-52 _____________________________________________________________________________ For the aspirated rats that also inhaled fumes from the respective developer solutions for 30days, significant difference occurred in the urea levels between rats in experimental groups A and B and between urea levels in each experimental group and the control group. No difference( P= 0.544) existed in creatinine levels between rats in group A and group B. Significant difference was however, noted in creatinine levels between rats in group A and rats in group C (control) and rats in group B and rats in the control group (Table 2). DISCUSSION Our study revealed that compared to the rats in the control group, there was marked rise in the serum urea and creatinine levels (by a factor of 2.5 and 1.4 respectively) in the rats in the experimental groups within the first 15 days of exposure to the developer solutions. This is suggestive of acute toxic effects with acute renal damage/injury and impaired renal function. This is in agreement with reports in literature [8, 13]. The fall in the urea level seen with further exposure to the developer (in the 30 days periods) could possibly be due to re-absorption in the proximal renal tubules enhanced by sodium and water transport [11] or due to liver injury that might have also occurred [13]. The implication of this to radiology workers in developing countries where most radiology facilities employ darkroom procedure is the possible high level of renal problems with possible attendant fatalities worsened by lack of renal centres (and poverty which prevents seeking medical treatment from the developed countries). The problem can even be compounded by the observed fall in the urea and creatinine levels (almost of same value with the control) in the aspirated rats. This, possibly, is suggestive of either ‘false’ adaptation to the toxic situation-which means dying without knowing it or acquired immunity. When the biochemical findings are related to the histological findings, the almost normal values found in the aspirated rats that also inhaled developer fumes for 30days seem to agree to the report that urea and creatinine levels show significant rise in level after a substantial kidney injuries occurred [8] and 2/3 to 3/4 of the glomeruli have been lost[12 ]. The results from this study gives insight to the possible risks to which radiographers and darkroom staff are exposed. This becomes more worrisome when we remember that such personnel are not exposed to only the developer but also the fixer which may itself have some harmful effects on health. CONCLUSION Wistar rats exposed to developer solutions experienced alteration in physical, biochemical and morphological status which were not concentration dependent at short exposures but become so with longer exposure. Acknowledgement Authors acknowledge with thanks the staff and management of the department of Medical Laboratory Sciences of Nnamdi Azikiwe University Teaching Hospital, Nnewi, Anambra State who helped in the tissue processing and histological and biochemical analysis. REFERENCES [1] US Department of Health and Human Services (USDHHS); Medical Encyclopedia: Chemical pneumonitis. 2004 National Centre for Biotechnology Information. US National Library of Medicine 8600 Rockville Pike, Bethesda, MD 20894 USA. Accessed 12th Sept.2015. [2] National Institute of Health, NIH: A Service of the U.S National Library of Medicine, Sodium Hydroxide Poisoning. Available from www.nlm.gov/. Accessed 8th June 2014. [3] Sherwood P. Burge, British Medical Journal, 1989, Aug 5, 299-342. [4] Neelam B, Uppal V. and Pathak D. Toxicol Indust Health. 2011, 27, 6, 563–569. [5] Liss GM, Tarlo SM, Doherty J, Purdham J, Greene J, McCaskell L., Kerr M; Occup Environ Med, 2003, 60, 4, 254-261. [6] Chiegwu HU, Ugwuanyi DC, Chinazo UA et al. Int J Health Sci Res. 2015, 5, 12, 106-114. [7] Chiegwu HU, Ugwuanyi DC, Ogenyi SI, Chuks HC, Mbakwe KL Scholars Journal of Applied Medical Sciences, 2016, 4,1B, 112-123. [8] Vishal S. Vaidya, Victoria Ramirez, Takaharu Ichimura, Norma A. Bobadilla, Joseph V. Bonventre. American Journal of Physiology - Renal Physiology, 2006 February 1, 290, 2, 517-529, DOI: 10.1152/ajprenal.00291.2005.
51
Pelagia Research Library
Daniel C. Ugwuanyi et al Euro. J. Exp. Bio., 2016, 6(2):43-52 _____________________________________________________________________________ [9] Bonventre V Joseph and Weinberg M Joel Journal of the American Society of Nephrology, 2003, 14, 2199– 2210. [10] Tolkoff-Rubin NE, Rubin RH, and Bonventre JV. Clin Lab Med, 1988, 8, 507–526. [11] Bárbara Bruna Abreu de Castro, Fernando Antonio Basile Colugnati, Marcos Antonio Cenedeze, Paulo Giovanni de Albuquerque Suassuna, Hélady Sanders Pinheiro. Standardize assessment of renal function in rats from in the Center for Reproductive Biology of Federal University of Juiz de Fora's colony. Jornal Brasileiro de Nefrologia, 2014, Apr. /June, 36, 2. São Paulo http://dx.doi.org/10.5935/0101-2800.20140023 [12] Ron Hines DVM Chronic Kidney Disease In Your Pet Rat - What It Is, And What You Can Do About It. http://www.2ndchance.info/ in. [13] American Association for Clinical Chemistry (AACC).Blood Urea Nitrogen. LabTests Online, 2001-2016, Reviewed 31st Aug. and modified 29 Oct. 2015. Accessed 6th Dec. 2015 [14] Charles Patrick Davis, William C. Shiel Jr. Creatinine Blood Test. Medicine Net.com Reviewed on 1/13/2015, Accessed 6th Jan. 2016. [15] Avwioro Godwin, Journal of Pharmacy and Clinical Sciences, 2011, 1, 24-34. [16] Michael Peake and Malcolm Whiting Clin Biochem Rev. 2006 Nov, 27, 4, 173–184. [17] Urea Nitrogen (BUN) (Berthelot/Colorimetric). Pointe Scientific, Inc, 5449 Research Drive. Canton MI 48188. USA. www.pointescientific.com [18] Prem Raj Shakya Digital Home 2013.Biochemistry Class notes. Urea estimation: Principle, Methodology and clinical significance. Posted Saturday, November 10, 2012. Reposteted Dec 21, 2015. Accessed 15th Jan. 2016.
52
Pelagia Research Library