1. Biodegradation of DDT by Stenotrophomonas sp. DDT-1: Characterization and genome functional analysis. Xiong Pan. 1. , Dunli Lin. 1. , Yuan Zheng. 1.
Biodegradation of DDT by Stenotrophomonas sp. DDT-1: Characterization and genome functional analysis
Xiong Pan1, Dunli Lin1, Yuan Zheng1, Qian Zhang1, Yuanming Yin1, Lin Cai2, Hua Fang1,* & Yunlong Yu1,*
Extraction and determination of DDT metabolites. After incubation for 14 d under conditions of 30 ℃ and 150 rpm, the metabolites DDD, DDE, DDMS, and DDOH in MSM were extracted according to the method described by Fang et al.1, which was the same extraction method with parent compound DDT. For the extraction of the metabolite DDA, the culture was firstly adjusted to pH 1-2 by 1 mol/l HCl, and then was extracted three times with 50, 40, and 30 ml ethyl acetate, respectively. The organic phase was dried through anhydrous sodium sulfate and collected in a 250-mL flat-bottom flask. It was subsequently concentrated to about 1 ml on a vacuum rotary evaporator and immediately concentrated to almost dryness under a gentle nitrogen flow. n-Hexane was added to dissolve DDA and the volume was made up to 10 ml and was filtered through a 0.22 µm syringe filter membrane. DDT metabolites were determined using a GC-MS-QP2010 Plus equipped with electron impact (EI) ionization (Shimadzu Corporation, Kyoto, Japan) and a VF-1701MS silica capillary column (30 m × 0.25 mm × 0.25 µm, Agilent Technologies, USA)1. The extraction and determination methods of DDT metabolites DDD, DDE, DDMS, DDOH, and DDA have been added in revised manuscript (please see lines 317-323 and Supplementary Information). Reference: 1. Fang, H., Dong, B., Yan, H., Tang, F. F. & Yu, Y. L. Characterization of a bacterial strain 1
capable of degrading DDT congeners and its use in bioremediation of contaminated soil. J. Hazard. Mater. 184, 281-289 (2010).
Buffer preparation. The medium was prepared with pH 5.0 buffer (KHP, 10.21 g; NaOH, 0.09 g; H 2 O, 1000 ml), pH 7.0 buffer (MSM), and pH 9.0 buffer (KCl, 3.73 g; H 3 BO 3 , 0.93 g; NaOH, 0.83 g; H 2 O, 1000 ml), respectively.
Statistical analysis. Mean and standard deviations of all data were processed using Microsoft Excel 2010 (Microsoft, Redmond, Washington, USA). The difference of DDT degradation by the isolate DDT-1 in MSM at different substrate concentration, pH, and temperature were analyzed by one-way ANOVA using SPSS version 15.0 (SPSS Inc., Chicago, Illinois, USA).
Inoculum preparation. The isolate DDT-1 was cultured in 250 ml Erlenmeyer flasks containing 150 ml LB medium (beef extract, 10 g; peptone, 5 g; sodium chloride, 5 g; distilled water, 1000 ml; pH 7.0) supplemented with DDT of 1 mg/l at 30 ℃ and 150 rpm on a rotary shaker.. At the exponential phase, the microorganisms were harvested by centrifugation (8000×g, 10 min). The bacterial sediment was washed three times with 20 ml of NaH2PO4-Na2HPO4 buffer (0.1 mol/l, pH 7.0), and then suspended in the same buffer and used to inoculate the degradation cultures.
2
Figure captions
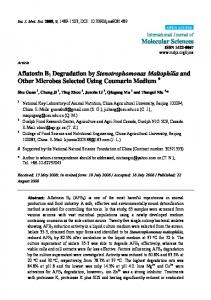
Fig. S1 Growth curve of the strain DDT-1 in mineral salts medium (pH 7.0) supplemented with 1.0 mg/l of DDT at 30 ℃.
Tables Table S1 16S rDNA sequence of the isolate DDT-1 Table S2 Functional annotation of strain DDT-6 genome against the Clusters of Orthologous Groups (COG) database Table S3 Functional classification of strain DDT-6 genome against Gene Ontology (GO) database Table S4 Metabolic annotation of strain DDT-6 genome against Kyoto Encyclopedia of Genes and Genomes (KEGG) pathway database Table S5 Information on the assembled contigs from clean reads by SOAPdenovo Table S6 DDGs-like genes found in strain DDT-1 genome using BLASTx Table S7 Molecular weight and characteristic peak of DDT and its metabolites Table S8 Composition of DDT degradation genes (DDGs) database
3
Fig. S1
100
1.0 Degradation(%) Growth
0.8
60
0.6
40
0.4
20 0.2 0 0.0 0
7
14
Time after treatment (d)
4
21
Growth(OD600)
Degradation(%)
80
Table S1 16S rDNA sequence of the isolate DDT-1 16S rDNA size (bp)
1422
Similarity
99%
Accession number
KP729429
Putive genus
Stenotrophomonas GGCAGCGCCCTCCCGAAGGTTAAGCTACCTGCTTCTGGTGCAACAAACTCCCATGGTG TGACGGGCGGTGTGTACAAGGCCCGGGAACGTATTCACCGCAGCAATGCTGATCTGC GATTACTAGCGATTCCGACTTCATGGAGTCGAGTTGCAGACTCCAATCCGGACTGAG ATAGGGTTTCTGGGATTGGCTTACCGTCGCCGGCTTGCAGCCCTCTGTCCCTACCATT GTAGTACGTGTGTAGCCCTGGCCGTAAGGGCCATGATGACTTGACGTCATCCCCACCT TCCTCCGGTTTGTCACCGGCGGTCTCCTTAGAGTTCCCACCATTACGTGCTGGCAACT AAGGACAAGGGTTGCGCTCGTTGCGGGACTTAACCCAACATCTCACGACACGAGCTG ACGACAGCCATGCAGCACCTGTGTTCGAGTTCCCGAAGGCACCCATCCATCTCTGGA AAGTTCTCGACATGTCAAGGCCAGGTAAGGTTCTTCGCGTTGCATCGAATTAAACCAC ATACTCCACCGCTTGTGCGGGCCCCCGTCAATTCCTTTGAGTTTCAGTCTTGCGACCGT ACTCCCCAGGCGGCGAACTTAACGCGTTAGCTTCGATACTGCGTGCCAAATTGCACCC
16S rDNA sequence (bp)
AACATCCAGTTCGCATCGTTTAGGGCGTGGACTACCAGGGTATCTAATCCTGTTTGCT CCCCACGCTTTCGTGCCTCAGTGTCAATGTTGGTCCAGGTAGCTGCCTTCGCCATGGA TGTTCCTCCTGATCTCTACGCATTTCACTGCTACACCAGGAATTCCGCTACCCTCTACC ACATTCTAGTCGTCCAGTATCCACTGCAGTTCCCAGGTTGAGCCCAGGGCTTTCACAA CGGACTTAAATGACCACCTACGCACGCTTTACGCCCAGTAATTCCGAGTAACGCTTGC ACCCTTCGTATTACCGCGGCTGCTGGCACGAAGTTAGCCGGTGCTTATTCTTTGGGTA CCGTCATCCCAACCAGGTATTAGCCGGCTGGATTTCTTTCCCAACAAAAGGGCTTTAC AACCCGAAGGCCTTCTTCACCCACGCGGTATGGCTGGATCAGGCTTGCGCCCATTGTC CAATATTCCCCACTGCTGCCTCCCGTAGGAGTCTGGACCGTGTCTCAGTTCCAGTGTG GCTGATCATCCTCTCAGACCAGCTACGGATCGTCGCCTTGGTGGGCCTTTACCCCGCC AACTAGCTAATCCGACATCGGCTCATTCAATCGCGCAAGGCCCGAAGATCCCCTGCTT TCACCCGTAGGTCGTATGCGGTATTAGCGTAAGTTTCCCTACGTTATCCCCCACGACA GAGTAGATTCCGATGTATTCCTCACCCGTCCGCCACTCGCCACCCAGAGAGCAAGCTC TCCTGTGCTGCCGTTCGACttGCATGtGttAG
5
Table S2 Functional annotation of strain DDT-6 genome against the Clusters of Orthologous Groups (COG) database No.
A B C D E F G H I J K L M N O P Q R S T U V
Class description
RNA processing and modification Chromatin structure and dynamics Energy production and conversion Cell cycle control, cell division, chromosome partitioning Amino acid transport and metabolism Nucleotide transport and metabolism Carbohydrate transport and metabolism Coenzyme transport and metabolism Lipid transport and metabolism Translation, ribosomal structure and biogenesis Transcription Replication, recombination and repair Cell wall/membrane/envelope biogenesis Cell motility Posttranslational modification, protein turnover, chaperones Inorganic ion transport and metabolism Secondary metabolites biosynthesis, transport and catabolism General function prediction only Function unknown Signal transduction mechanisms Intracellular trafficking, secretion, and vesicular transport Defense mechanisms
6
Gene number
1 1 178 28 218 56 131 104 107 167 203 111 158 89 124 168 72 360 242 147 100 42
Table S3 Functional classification of strain DDT-6 genome against Gene Ontology (GO) database Ontology biological process Biological process Biological process Biological process Biological process Biological process Biological process Biological process Biological process Biological process Biological process Biological process Biological process Biological process Biological process Biological process Biological process Biological process Biological process Biological process Biological process Cellular component Cellular component Cellular component Cellular component Cellular component Cellular component Cellular component Molecular function Molecular_function Molecular function Molecular function Molecular function Molecular function Molecular function Molecular function Molecular function
Class
biological adhesion biological regulation cellular component organization or biogenesis cellular process death developmental process establishment of localization localization locomotion metabolic process multi-organism process multicellular organismal process negative regulation of biological process nitrogen utilization positive regulation of biological process regulation of biological process reproduction reproductive process response to stimulus signaling viral reproduction cell cell part macromolecular complex organelle organelle part virion virion part antioxidant activity binding catalytic activity enzyme regulator activity molecular transducer activity nucleic acid binding transcription factor activity protein binding transcription factor activity structural molecule activity transporter activity
7
Number
10 428 113 1513 2 26 410 435 43 1560 14 2 9 2 4 419 9 4 292 175 4 1448 1447 126 117 35 3 3 28 1178 1582 4 214 153 21 52 206
Table S4 Metabolic annotation of strain DDT-6 genome against Kyoto Encyclopedia of Genes and Genomes (KEGG) pathway database No. map00010 map00020 map00030 map00040 map00051 map00052 map00053 map00061 map00071 map00072 map00100 map00120 map00121 map00130 map00190 map00195 map00230 map00240 map00250 map00253 map00260 map00270 map00280 map00281 map00290 map00300 map00310 map00311 map00312 map00330 map00340 map00350 map00360 map00361 map00362 map00363 map00364 map00380 map00400
KEGG description
Glycolysis/Gluconeogenesis Citrate cycle (TCA cycle) Pentose phosphate pathway Pentose and glucuronate interconversions Fructose and mannose metabolism Galactose metabolism Ascorbate and aldarate metabolism Fatty acid biosynthesis Fatty acid metabolism Synthesis and degradation of ketone bodies Steroid biosynthesis Primary bile acid biosynthesis Secondary bile acid biosynthesis Ubiquinone and other terpenoid-quinone biosynthesis Oxidative phosphorylation Photosynthesis Purine metabolism Pyrimidine metabolism Alanine, aspartate and glutamate metabolism Tetracycline biosynthesis Glycine, serine and threonine metabolism Cysteine and methionine metabolism Valine, leucine and isoleucine degradation Geraniol degradation Valine, leucine and isoleucine biosynthesis Lysine biosynthesis Lysine degradation Penicillin and cephalosporin biosynthesis beta-Lactam resistance Arginine and proline metabolism Histidine metabolism Tyrosine metabolism Phenylalanine metabolism Chlorocyclohexane and chlorobenzene degradation Benzoate degradation Bisphenol degradation Fluorobenzoate degradation Tryptophan metabolism Phenylalanine, tyrosine and tryptophan biosynthesis 8
Number
30 22 20 9 19 10 4 17 14 6 1 1 1 9 47 8 61 45 23 3 26 28 23 8 20 14 14 5 4 34 21 20 9 5 11 8 2 17 23
map00401 map00410 map00430 map00440 map00450 map00460 map00471 map00473 map00480 map00500 map00510 map00511 map00520 map00521 map00523 map00524 map00540 map00550 map00561 map00562 map00564 map00565 map00590 map00591 map00592 map00620 map00621 map00623 map00624 map00625 map00626 map00627 map00630 map00633 map00640 map00642 map00643 map00650 map00660 map00670 map00680 map00710 map00720
Novobiocin biosynthesis beta-Alanine metabolism Taurine and hypotaurine metabolism Phosphonate and phosphinate metabolism Selenocompound metabolism Cyanoamino acid metabolism D-Glutamine and D-glutamate metabolism D-Alanine metabolism Glutathione metabolism Starch and sucrose metabolism N-Glycan biosynthesis Other glycan degradation Amino sugar and nucleotide sugar metabolism Streptomycin biosynthesis Polyketide sugar unit biosynthesis Butirosin and neomycin biosynthesis Lipopolysaccharide biosynthesis Peptidoglycan biosynthesis Glycerolipid metabolism Inositol phosphate metabolism Glycerophospholipid metabolism Ether lipid metabolism Arachidonic acid metabolism Linoleic acid metabolism alpha-Linolenic acid metabolism Pyruvate metabolism Dioxin degradation Toluene degradation Polycyclic aromatic hydrocarbon degradation Chloroalkane and chloroalkene degradation Naphthalene degradation Aminobenzoate degradation Glyoxylate and dicarboxylate metabolism Nitrotoluene degradation Propanoate metabolism Ethylbenzene degradation Styrene degradation Butanoate metabolism C5-Branched dibasic acid metabolism One carbon pool by folate Methane metabolism Carbon fixation in photosynthetic organisms Carbon fixation pathways in prokaryotes 9
4 7 2 4 11 9 2 4 25 21 2 2 31 9 4 3 12 17 9 5 22 1 5 6 2 39 1 5 7 12 13 16 25 2 19 5 3 28 7 16 26 11 25
map00730 map00740 map00750 map00760 map00770 map00780 map00785 map00790 map00791 map00830 map00860 map00900 map00903 map00908 map00910 map00920 map00930 map00940 map00950 map00960 map00970 map00980 map00982 map00983 map01040 map01051 map01053 map01055 map02010 map02020 map02030 map02040 map02060 map03008 map03013 map03018 map03020 map03030 map03060 map03320 map03410 map03420 map03430
Thiamine metabolism Riboflavin metabolism Vitamin B6 metabolism Nicotinate and nicotinamide metabolism Pantothenate and CoA biosynthesis Biotin metabolism Lipoic acid metabolism Folate biosynthesis Atrazine degradation Retinol metabolism Porphyrin and chlorophyll metabolism Terpenoid backbone biosynthesis Limonene and pinene degradation Zeatin biosynthesis Nitrogen metabolism Sulfur metabolism Caprolactam degradation Phenylpropanoid biosynthesis Isoquinoline alkaloid biosynthesis Tropane, piperidine and pyridine alkaloid biosynthesis Aminoacyl-tRNA biosynthesis Metabolism of xenobiotics by cytochrome P450 Drug metabolism - cytochrome P450 Drug metabolism - other enzymes Biosynthesis of unsaturated fatty acids Biosynthesis of ansamycins Biosynthesis of siderophore group nonribosomal peptides Biosynthesis of vancomycin group antibiotics ABC transporters Two-component system Bacterial chemotaxis Flagellar assembly Phosphotransferase system (PTS) Ribosome biogenesis in eukaryotes RNA transport RNA degradation RNA polymerase DNA replication Protein export PPAR signaling pathway Base excision repair Nucleotide excision repair Mismatch repair 10
5 10 7 16 15 9 2 13 1 3 15 12 12 1 17 8 3 5 1 4 25 14 14 8 13 1 7 1 11 42 7 1 5 2 1 12 4 14 3 4 16 7 17
map03440 map04011 map04070 map04112 map04113 map04122 map04142 map04146 map04260 map04614 map04626 map04724 map04910 map04920 map04930 map04974 map05010 map05012 map05014 map05016 map05020 map05133 map05142 map05143 map05146 map05150 map05152 map05211 map05340 map05410
Homologous recombination MAPK signaling pathway - yeast Phosphatidylinositol signaling system Cell cycle - Caulobacter Meiosis - yeast Sulfur relay system Lysosome Peroxisome Cardiac muscle contraction Renin-angiotensin system Plant-pathogen interaction Glutamatergic synapse Insulin signaling pathway Adipocytokine signaling pathway Type II diabetes mellitus Protein digestion and absorption Alzheimer's disease Parkinson's disease Amyotrophic lateral sclerosis (ALS) Huntington's disease Prion diseases Pertussis Chagas disease (American trypanosomiasis) African trypanosomiasis Amoebiasis Staphylococcus aureus infection Tuberculosis Renal cell carcinoma Primary immunodeficiency Hypertrophic cardiomyopathy (HCM)
11
15 6 5 6 1 4 2 10 3 1 1 2 1 1 1 1 5 3 3 8 2 2 2 1 1 1 1 1 1 1
Table S5 Information on the assembled contigs from clean dataset by SOAPdenovo Scaffold No. Scaffold1 Scaffold2 Scaffold3 Scaffold4 Scaffold5 Scaffold6 Scaffold7 Scaffold8 Scaffold9 Scaffold10 Scaffold11 Scaffold12 Scaffold13 Scaffold14 Scaffold15 Scaffold16 Scaffold17 Scaffold18 Scaffold19 Scaffold20 Scaffold21 Scaffold22 Scaffold23 Scaffold24 Scaffold25 Scaffold26 Scaffold27 Scaffold28 Scaffold29 Scaffold30 Scaffold31 Scaffold32 Scaffold33 Scaffold34 Scaffold35 Scaffold36 Scaffold37 Scaffold38 Scaffold39 Scaffold40 Scaffold41
Number
Length (bp)
GC content
1 1 1 1 1 1 1 1 1 1 1 1 1 1 1 1 1 1 1 1 1 1 1 1 1 1 1 1 1 1 1 1 1 1 1 1 1 1 1 1 1
236154 204983 180975 173132 161570 151904 139431 128156 127164 125000 114231 111642 105178 94470 87475 84278 80532 79442 78162 76871 67002 65275 64187 62687 57491 54888 54550 54394 53271 53266 53165 51986 51608 50290 49599 48191 46771 46636 44950 43301 39070
66.47% 66.66% 67.34% 64.57% 67.53% 66.76% 65.93% 66.68% 66.51% 67.14% 62.78% 68.05% 66.67% 65.40% 67.07% 66.81% 66.77% 67.64% 68.15% 61.09% 67.38% 67.08% 67.24% 67.16% 67.01% 64.09% 67.32% 67.26% 67.01% 65.57% 68.17% 66.20% 66.38% 66.93% 66.36% 65.98% 67.43% 66.30% 67.41% 64.62% 67.53%
12
Scaffold42 Scaffold43 Scaffold44 Scaffold45 Scaffold46 Scaffold47 Scaffold48 Scaffold49 Scaffold50 Scaffold51 Scaffold52 Scaffold53 Scaffold54 Scaffold55 Scaffold56 Scaffold57 Scaffold58 Scaffold59 Scaffold60 Scaffold61 Scaffold62 Scaffold63 Scaffold64 Scaffold65 Scaffold66 Scaffold67 Scaffold68 Scaffold69 Scaffold70 Scaffold71 Scaffold72 Scaffold73 Scaffold74 Scaffold75 Scaffold76 Scaffold77 Scaffold78 Scaffold79 Scaffold80 Scaffold81 Scaffold82 Scaffold83 Scaffold84
1 1 1 1 1 1 1 1 1 1 1 1 1 1 1 1 1 1 1 1 1 1 1 1 1 1 1 1 1 1 1 1 1 1 1 1 1 1 1 1 1 1 1
37313 37308 35123 34954 34107 33543 33370 33154 33122 31936 31246 29834 29764 29309 27979 23952 22718 20945 18807 17418 17125 16941 16547 16088 15574 14109 13246 13194 13172 11817 11517 11426 11033 10210 9248 8799 8790 8168 7537 5712 5692 4799 2430 13
67.41% 66.94% 66.43% 67.69% 66.89% 66.60% 67.19% 66.05% 66.35% 66.99% 67.09% 67.11% 67.61% 67.90% 64.39% 67.20% 65.19% 66.72% 68.09% 68.13% 68.99% 59.47% 63.49% 67.88% 66.70% 68.17% 66.23% 65.36% 61.49% 68.82% 59.89% 68.93% 68.34% 67.77% 67.58% 69.20% 68.78% 67.64% 57.77% 66.84% 66.69% 68.26% 53.05%
Scaffold85 Scaffold86 Scaffold87 Scaffold88 Scaffold89 Scaffold90 Scaffold91 Scaffold92 Scaffold93 Scaffold94 Scaffold95 Scaffold96 Scaffold97
1 1 1 1 1 1 1 1 1 1 1 1 1
2264 1773 1522 1170 768 697 685 603 580 555 523 515 510
14
54.24% 57.08% 58.41% 64.62% 55.08% 54.95% 60.44% 67.33% 61.03% 53.15% 60.61% 56.12% 61.37%
Table S6 DDGs-like genes found in strain DDT-1 genome using BLASTx Query ID
Scaffold 1
Scaffold 2
Scaffold 3
Scaffold 9
Scaffold 10
Scaffold 17
Scaffold 18
Scaffold 31
Scaffold 52
Subject id
CBW76073.1
CBW75398.1
CAQ47690.1
CAQ43870.1
CBW76470.1
CBW76142.1
CAQ43814.1
CAQ43710.1
CBW76219.1
Identity (%)
90.52
95.20
99.62
88.87
81.00
92.75
98.31
97.72
97.32
Alignment length
462
504
264
265
579
218
296
219
328
Mismatches
3
3
1
3
11
9
5
5
4
Gap openings
0
0
0
0
0
0
0
0
0
Query start
122407
27132
166404
122710
40748
19490
9018
45845
11948
Query end
123780
25627
165613
121916
39012
20131
8131
45189
10965
Subject start
1
1
1
1
1
11
1
1
114
Subject end
460
504
264
265
571
222
296
219
441
E-value
2e-156
0
2e-148
9e-125
0
9e-51
9e-168
7e-119
2e-99
Bit score
551
696
524
445
932
198
587
424
359
Metabolite pathway
DDNU ↓ DDOH
DDNU ↓ DDOH
DDA ↓ DDM
DDT ↓ DDE
DDT ↓ DDD
OHCTT ↓ CDP
DDMU ↓ DDOH
DDA ↓ DDM
OHCTT ↓ CDP
DDGs gene
hdt
hdt
dcl
dhc
rdh
hdl
sds、dhg
dcl
hdl
DDD: 1,1-dichloro-2,2-bis(p-chlorophenyl)ethane; DDE: 2,2-bis(p-chlorophenyl)-1,1-dichlorethylene; DDMU: 1-chloro-2,2-bis(4'-chlorophenyl)ethylene; DDOH: 2,2-bis(4'-chlorophenyl)ethanol; DDNU: unsym-bis(4'-chlorophenyl)ethylene; CDP: 2-(4'-chlorophenyl)-3,3-dichloropropenoate; DDA: bis(4'-chlorophenyl)acetate; DDM: bis(4'-chlorophenyl)methane; OHCTT: 6-Oxo-2-hydroxy-7-(4'-chlorophenyl)-3,8,8-trichloroocta-2E,4E,7E-trienoate.
15
Table S7 Molecular weight and characteristic peak of DDT and its metabolites Compound
Molecular weight
Characteristic peak
DDT DDD DDE DDMS DDOH DDA
354.5 320 318 266 266 282
235, 165 235, 165 246, 176 212, 176 235, 165 235, 165
16
Table S8 Composition of DDT degradation genes (DDGs) database No.
Gene
Degradation pathway
Enzyme
1
dhc
DDT→DDE
dehydrochlorinase
10
2
rrat
DDE→DDMU
ribonucleotide reductase activating transmembrane protein
2
3
sds
DDMU→DDMS
reductase
25
4
cpo
dhdDDT→dhDDT
coproporphyrinogen III oxidase
45
5
doa
DDT→dhdDDT
2,3-dioxygenase
35
6
dcl
DDA→DDM
decarboxylase
253
7
ort
dhDDT→OHCTD
oxidoreductase
83
8
ort
DDCCE→OHCTT
oxidoreductase
83
9
hdl
OHCTT→CDP
hydrolase
168
10
ods
CBA→CB
oxidase
1
11
rdh
DDT→DDD
reductive dehalogenase
2
12
dhc
DDD→DDMU
dehydrochlorinase
10
13
dhg
DDMS→DDOH
dehalogenase
45
14
dhc
DDMS→DDNU
dehydrochlorinase
10
15
hdt
DDNU→DDOH
hydratase
210
DDT: 1,1,1-trichloro-2,2-bis(p-chlorophenyl)ethane; DDD: 1,1-dichloro-2,2-bis(p-chlorophenyl)ethane; DDE: 2,2-bis(p-chlorophenyl)-1,1-dichlorethylene; DDMU: 1-chloro-2,2-bis(4'-chlorophenyl)ethylene; DDMS: 1-chloro-2,2-bis(4'-chlorophenyl)ethane; DDOH: 2,2-bis(4'-chlorophenyl)ethanol; DDNU: unsym-bis(4'-chlorophenyl)ethylene; CB: 4-chlorobenzoate; CBA: 4-chlorobenzaldehyde; CDP: 2-(4'-chlorophenyl)-3,3-dichloropropenoate; DDA: bis(4'-chlorophenyl)acetate; DDM: bis(4'-chlorophenyl)methane; dhdDDT: cis-2,3-dihydrodiol-DDT; dhDDT: 2,3-dihydroxy-DDT; OHCTT: 6-Oxo-2-hydroxy-7-(4'-chlorophenyl)-3,8,8-trichloroocta-2E,4E,7E-trienoate; OHCTD: 6-Oxo-2-hydroxy-7-(4’-chlorophenyl)-3,8,8,8-tetrachloroocta-2E,4E-dienoate; DDCCE: 1,1-dichloro-2-(dihydroxy-4'-chlorophenyl)-2-(4'-chlorophenyl)ethylene.
17
Protein number