BIOINFORMATICS
REVIEW
Vol. 25 no. 4 2009, pages 421–428 doi:10.1093/bioinformatics/btn659
Data and text mining
Biodiversity informatics: automated approaches for documenting global biodiversity patterns and processes Robert Guralnick1,2,∗ and Andrew Hill2 1 University
of Colorado Museum of Natural History and 2 Department of Ecology and Evolutionary Biology, University of Colorado Boulder, Boulder, CO 80309-0265, USA
Received on November 23, 2008; revised on December 16, 2008; accepted on December 18, 2008 Advance Access publication January 6, 2009 Associate Editor: Jonathan Wren
ABSTRACT Motivation: Data about biodiversity have been scattered in different formats in natural history collections, survey reports and the literature. A central challenge for the biodiversity informatics community is to provide the means to share and rapidly synthesize these data and the knowledge they provide us to build an easily accessible, unified global map of biodiversity. Such a map would provide raw and summary data and information on biodiversity and its change across the world at multiple scales. Results: We discuss a series of steps required to create a unified global map of biodiversity. These steps include: building biodiversity repositories; creating scalable species distribution maps; creating flexible, user-programmable pipelines which enable biodiversity assessment; and integrating phylogenetic approaches into biodiversity assessment. We show two case studies that combine phyloinformatic and biodiversity informatic approaches to document large scale biodiversity patterns. The first case study uses data available from the Barcode of Life initiative in order to make species conservation assessment of North American birds taking into account evolutionary uniqueness. The second case study uses full genomes of influenza A available from Genbank to provide an autoupdating documentation of the evolution and geographic spread of these viruses. Availability: Both the website for tracking evolution and spread of influenza A and the website for applying phyloinformatics analysis to Barcode of Life data are available as outcomes of case studies (http://biodiversity.colorado.edu). Contact:
[email protected]
1
INTRODUCTION
Biodiversity is in crisis (Heywood and Watson, 1995; Jenkins, 2003; Loreau et al., 2006; Pimm et al., 1995; Wilson, 1998). With the predicted loss of genetic and species diversity as great as past mass extinction events (Novacek and Cleland, 2001), a pressing challenge in environmental sciences will be to understand the factors causing this decline (National Academy of Sciences, 2001). One of the first steps towards meeting this challenge will be to document global patterns of biodiversity and note how those patterns change over time and space. Such an endeavor will result in ∗ To
whom correspondence should be addressed.
what Wilson (2000) called the global biodiversity map, stretching from pole to pole and including the tens of millions of species, their genes, proteins, behavior and morphology. This daunting task might seem impossible to achieve in time to make a difference given the pace and scope of biodiversity loss. However, many points on the map are nascent, already existing within the body of biodiversity literature and natural history collections, representing different views of past and present biodiversity. Thus, a central challenge for biodiversity informaticians is to provide the means to share and rapidly synthesize these data and the knowledge they provide us to build a unified global map of biodiversity (Bisby, 2000; Canhos et al., 2004). We are in a renaissance with regards to mapping natural and man-made environments, aided in part by remote sensing data and new, easy to use computer-aided mapping tools that show these data (Butler, 2006). Extending global mapping to biodiversity is within reach, such that in the near future anyone will be able to see and explore our knowledge of the distribution of all biological diversity. Scientists, managers, educators and the general public will simply load biodiversity layers into a virtual globe like Google Earth™ or World Wind™ and explore biodiversity change over time, developing ever increasing resolution as more reports of biodiversity presences and absences, growth and loss are reported. The map layers are not limited to showing raw data, but could also present compiled information, such as estimated species richness, behavioral and morphological characteristics, or proliferation of lineages containing unique phenotypes or genotypes. Analyses can be constantly run in the background to update this ever changing map by accessing existing and evolving species data resources (e.g. the Global Biodiversity Information Facility; http://gbif.org) or genetic resources (e.g. GenBank, http://www.ncbi.nlm.nih.gov; Barcode of Life, http://barcodinglife.org). This system would allow users to follow the biodiversity changes happening within the scope of their own queries for taxa, genes, populations, ecosystems, geographic regions and times of interest. The global biodiversity map will also be designed as an active agent, alerting users when the diversity of species or ecosystems changes in unusual ways (Collins et al., 2006). This map is therefore not static, but continues to grow as new data are made available from continuing exploration of the globe. The goal of this review article is to discuss how we might build systems that allow us to first improve and then analyze and visualize heterogeneous global biodiversity data and their change over space and time.
© The Author 2009. Published by Oxford University Press. All rights reserved. For Permissions, please email:
[email protected]
421
R.Guralnick and A.Hill
Fig. 1. Diagram showing the flow of data and tools necessary to create the evolving global biodiversity map. Distributed biodiversity data sources, including observational data, digital archival data such as photographs, sounds or published literature data and natural history collections data, are published to a biodiversity data portal in a common format encouraging aggregation and exchange. New data are constantly being fed into the portals. Georeferenced biodiversity data can then be presented on the global biodiversity map. External analysis services may accumulate raw biodiversity data from the portal, and associated genetic, phenotypic and environmental data, in order to create new views and new biodiversity knowledge, itself representable back on the map. Each of these layers is available to interested users, who may develop their own workflows in order to track regions and taxa of interest.
2
BUILDING BIODIVERSITY REPOSITORIES
Before one can begin to summarize information and knowledge about biodiversity into maps, or perform any analyses, we must first make all legacy and current data about when and where species occur available and easy to use. A crucial, but well known challenge for biodiversity informaticians is to efficiently curate and distribute these data; an effort that will lay the foundations of a global biodiversity infrastructure (Guralnick et al., 2007). A fundamental unit of biodiversity data, the point on the map, is the species occurrence record. Primary occurrence data— observations or vouchers of the units of biodiversity at specific places and times—may seem to be a deceptively simple type of record. However, such records have their complexities, especially with regards to taxonomy and location. The natural history collections community has invested significant effort to create widely adopted minimum information standards (e.g. DarwinCore) and transmission protocols (e.g. DiGIR and TAPIR) to standardize and share species occurrence records (Graham et al., 2004). We expect that in the next decade, at least a billion species occurrences records will be made available through portals like the GBIF data site (http://data.gbif.org) which as of now contains nearly 7500 collections representing more than 150 million occurrence records
422
(Edwards, 2004; Lane, 2006). Many of those records will have high quality and up-to-date taxonomic data, standardized dates of collection and computer-readable geographic coordinates and associated spatial uncertainty measurements. These records will be unlocked not only from natural history collections from around the world, but also past and current surveys, from old and new photographs documenting organisms and extracted records from the soon to be completely scanned biodiversity heritage literature (see Fig. 1; Sarkar, 2007; http://www.biodiversityheritagelibrary.org). Data quality issues in regards to taxonomy, location and date of collection remain. These data quality issues are a major impediment to the wide-scale use of such records by scientists and other decisionmakers (Guralnick et al., 2007; Robertson, 2008; Yesson et al., 2007). A major challenge in biodiversity informatics is to develop methods and tools that can help increase data quality, thus making records more usable for biodiversity research and in conservation decision-making (Chapman, 2005). It is unreasonable to expect data providers to deal in a timely manner with data quality issues on their own. Manually cleaning data and improving data quality can be a slow process, especially when each provider must learn the current standards and best practices employed in the field. As well, many of the data vetting operations are repetitive in nature, so it is inefficient
Biodiversity informatics
for each data provider to independently perform tasks necessary to improve data quality. One of the key operations for increasing the quality of data available in our repositories and for ultimately building the biodiversity map is converting locality descriptions that have been recorded in multiple different formats (e.g. text descriptions such as 5 km west of Boulder, CO) into standardized, computerreadable latitude–longitude-geographic uncertainty measurement triplets (Guralnick, 2006). Uncertainty, in particular, is essential because it provides a basis for deciding the scale at which an occurrence record can be used. If the uncertainty of a georeference is 20 km may only be usable at continental or larger scales (Guo et al., 2008). The first step towards efficiently georeferencing occurrence records is to adopt a process that will always return the same latitude–longitude-coordinate uncertainty triplet for the same textual string. The BioGeomancer service (http://www.biogeomancer.org/; Guralnick et al., 2006) has done just this and is particularly useful in conjunction with other georeferencing tools (e.g. GeoLocate, Metacarta and Yahoo’s GeoPlanet). Users with minimal knowledge of georeferencing process can quickly generate standardized georeferences of high quality. They do not have to start from scratch developing idiosyncratic methodologies that do not reflect community developed best practices. However, even with automated or semi-automated workbenches, the task of georeferencing over 1 billion biodiversity records in a reasonable amount of time is an immense and daunting undertaking. A partial solution to this challenge of large-scale georeferencing and potentially other data quality challenges will be to not only provide automation for one step of the process (e.g. conversion process of textual or other locality formats to geographic coordinates) but to create pipelines where those tools are constantly operating on the growing set of biodiversity occurrence records as they become available. This pipeline can be developed to automatically feed digital occurrence data from providers to the Biogeomancer service for georeferencing. The results of the process are stored for providers to review and fold back into their original records. In coordination with GBIF and BioGeomancer, this pipeline is already being developed (http://biodiversity.colorado.edu/bgb/). In its finished state, tools such as really simple syndication (RSS) for human users and web services (e.g. REST or SOAP) for programmatic access will provide automatic notification of progress. By utilizing such a system, both the georeferencing rate and number of adequately processed records of the world’s biodiversity data will increase exponentially, thus allowing much faster use of more data in biodiversity research. Similar systems may be used in the future for different sets of problems. The growing set of knowledge being assembled by the Catalogue of Life (http://www.catalogueoflife.org/search. php) and others (e.g. World Register of Marine Species, http:// www.marinespecies.org/) may be plugged in to similar pipelines to provide valid taxonomic names to records spanning centuries made available from data providers spanning the globe. Systems like iSpecies (http://ispecies.org/) may automate linking primary data with much of the existing web-based metadata, whereas projects like EOL Encyclopedia of Life (Wilson, 2003; http://www. eol.org/) may become the source of more detailed information regarding species. By linking these projects, the points on the global
biodiversity map become rich with information and supplemented by existing analyses and knowledge. Figure 1 summarizes how digital biodiversity resources, repositories and analysis tools are linked together.
3
DETERMINING SPECIES DISTRIBUTIONS
Species occurrences are the raw data used to generate many different summary views on biodiversity. One essential product generated from species occurrences are species distribution maps. These maps document where species are present and absent across their full range and are often used as input themselves for further biodiversity measurements. Documenting the current geographic distributions of taxa at a global scale is a demanding task (Whittaker et al., 2005) and ultimately, the confidence in distributional knowledge is a direct function of the chosen grain size (Hurlbert and Jetz, 2007). At a spatial resolution of a continent or the whole world, the quality of our distribution data for many taxa is quite good. At the resolution of 10 × 10 km, the accuracy of distribution data remains poor for all but the most well-studied regions and taxa (Soberón et al., 2007). Furthering knowledge about species distributions to finer resolutions will help maximize global biological knowledge, improve the scientific basis for conservation support and allow us to more accurately model changes in species or population distributions that may occur under environmental change scenarios. Generating predictions of distributions can be accomplished using a mix of presence–absence occurrence data, expert opinion and GIS-modeling approaches. Occurrence data provides the outline of species distributions but in almost all cases, there is ‘observer bias’ in terms of sampling (Graham et al., 2004) and this is especially true in regions such as the tropics where sampling has been limited. Thus there is a significant role for refining ranges based on expert opinion of biologists familiar with the species and environments in question, at least in some cases (Ferrier et al., 2002; Pearce et al., 2001). Until now, such opinions were either codified in the literature or derived directly from the experts themselves. The rise of social networks provides a third option for storage of expert opinion distribution knowledge. Such knowledge can be compiled in social networking applications like Scratchpads (http://scratchpads.eu) that allow annotations of species ranges based on knowledge of the species and environment. The next step is to combine expert-based extent of occurrence data with ecological niche modeling. Ecological niche modeling is a rapidly emerging area that utilizes available presence only or presence–absence data along with environmental data (e.g. climate models and remote sensed data) to quickly output predictions about suitability of habitat in areas that have not been sampled (Soberón and Peterson, 2004) in GIS layer formats. As more data becomes available to global repositories, and as environmental data layers become finer scale, the more tractable finer scale ecological niche modeling becomes. Although niche modeling is both quantitative and repeatable, this approach does not yet take into account biotic interactions and other biogeographic factors that may limit species ranges (Guisan and Zimmerman, 2000; Soberón and Peterson, 2005). Thus it is the combination of modeling approaches and expert opinion information that will put us into the position to make accurate, scalable maps of species distributions (McPherson et al., 2006; Pearce et al., 2001) that can be easily visualized on flat maps
423
R.Guralnick and A.Hill
or virtual globes. These modeled range maps represent a central information product for our global biodiversity map. Once the relationship between species occurrences and environmental parameters is known in the present, it is possible also to make predictions about future (e.g. Hijmans and Graham, 2006), and even past (e.g. Martínez-Meyer et al., 2004; Waltari et al., 2007; Yesson and Culham, 2006) distributions if species niches are conserved. Such forward or back-casted species distributional modeling only requires one further set of environmental data—past and future environmental landscapes (such as IPCC modeled climate scenarios under different models of CO2 use; (http://www.ipccdata.org/ar4/gcm_data.html). Such models provide repeatable, quantitative outputs concerning how species distributions may change in location and size as climates or landscapes change. This approach may be particularly warranted when it is known that species distributions have shown consistent responses to climate changes from the recent past to the present (Kharouba et al., in press). Because the outputs of models are also ‘maps’, these predictions of distribution in the present and future are also part and parcel of our larger global biodiversity map. There are already persistent pipelines in place to rapidly handle many of the modeling tasks as new and better data and modeling approaches become available (LifeMapper, http://www.lifemapper.org; Stockwell et al., 2006; ), although there is still a need for long-term archiving of results. New pipelines could be designed by users to automate new species distribution maps based on the best new data and algorithms.
4
PIPELINES FOR BIODIVERSITY ASSESSMENT
The combination of finer scale range maps, data harvesting and analysis pipelines can be easily modified to tackle new sets of questions. The first will likely be simple but crucial questions such as ‘How well sampled is biodiversity in a geographic region of interest’ and ‘where should we go to sample more’. As of now, the approach to answering these questions requires a huge investment in data collection and individual analyses, which may or may not be published and which are often quite difficult to repeat. Developing persistent pipelines to answer these questions, and then housing the results along with original data could radically change current practices in biodiversity research. For example, in Guralnick et al. (2007) we showed how simple data harvesters can be built to collect data that meet certain specifications from data portals, which are then stored in local databases, placed in grid cells representing different geographic areas and automatically sent to analysis services for further processing to estimate key biodiversity measures like species richness. We then demonstrated how this can help us understand biodiversity sampling quality in different regions of the world, from southern Africa, to eastern North America, for groups like birds and mammals. Further, these map outputs can become a growing part of our global biodiversity map, representing summary information aggregated from either individual species range maps or occurrence data. As these tools are set up to automatically harvest information from data portals and perform analyses, they can be reassembled and redeployed as new data and information flows into biodiversity repositories (Fig. 1). Users themselves will be able to set up feeds for taxa of interest in regions of interest, and receive notifications when new records or analyses have become available.
424
As they do, users can redeploy their tools, or ones from a growing library of tools made available as services, and determine if new information (e.g. occurrence data, environmental data, niche models) changes previous assessments of biodiversity or suggests changes to biodiversity patterns that might be worth further study. Therefore any and all analyses of regional, continental or even global biodiversity can be run again and again to see how continued aggregation of new data helps provide a well sampled view of biodiversity of all organisms. Although this seems like a very ambitious goal, it is not out of reach. The data, knowledge and analysis approaches needed to document global biodiversity are available, and harvesting tools and notification tools such as RSS are simple enough to deploy.
5
INTEGRATION WITH PHYLOINFORMATICS
Although much information can be gleaned from just the sampled distribution of organisms across the landscape (Funk and Richardson, 2002; Kress et al., 1998), there are also limits. Patterns of species distribution have come about through historical processes, and inferring these processes through examination of trait and molecular variation and sorting of this variation into distinct lineages provides a much richer set of information about biodiversity (Wheeler, 1995). In biodiversity research, a synthesis of disciplines and approaches drawing from multiple areas in ecology and phylogenetic systematics is underway, as evidenced by integration of phylogenetic approaches into community ecology and species distribution modeling approaches into molecular ecology. More and more frequently, diversity is measured not simply as number of species, but instead utilizing a measurement based on phylogenetic relatedness. Phylogenetic diversity (PD) is calculated as the sum diversity of the overall phylogenetic branch lengths for a set of genes or taxa in a sampled region (Faith, 1992). Such measurements better reflect the diversity of unique traits that might exist within an area. At the population level, back-casted species distribution modeling approaches can be combined with phylogenetic and phylogeographic methods as complementary datasets in order to provide stronger test for past distribution and demography changes that can be used to calibrate how changes may happen in the future (Carstens and Richards, 2007; Waltari et al., 2007). A current integrative approach to documenting population histories is to construct potential past distributional models, as discussed above, as a way to generate initial hypothesis that can be formally compared with genetic data (Carstens and Richards, 2007). If there is concordance between results, then one can also run projections of species or lineage distributions into the future utilizing models of climate change. By extrapolating from single species to multi-species studies in a region, it is possible to examine concordance of patterns between species in a region that might suggest action of concerted environmental forces acting to shape community level genome variation. When combined with the burgeoning growth in metagenomic, genomic and proteonomic approaches, we can track the diversity and distribution of functional genes and their products across landscapes. Finally, we can relate variation in those patterns to known environmental changes, thus generating a more process-oriented understanding of biodiversity patterns.
Biodiversity informatics
Below we present two case studies that integrate biodiversity informatics approaches with those from phyloinformatics and other bioinformatics subdisciplines. These case studies show how automation tasks can be employed to gather and process datasets usable for biodiversity assessment. In the first case study, we develop an automated pipeline for measuring species conservation priority that utilizes both phylogenetic uniqueness and extinction risk. The second case study uses a similar pipeline approach, but focuses on analysis of full genomes of influenza A viruses in order to document continuing evolution and geographic spread of this disease.
6
PD CASE STUDY
Our first case study utilizes data made available from the Consortium for the Barcode of Life (CBOL) to automate assessment of PD in relation to conservation scenarios. CBOL is a global initiative to utilize short DNA sequences from a standardized and agreedupon position in the genome as a molecular diagnostic for species-level identification (Savolainen et al., 2005). CBOL has developed a web-based Barcode of Life Data System (BOLD; http://www.barcodinglife.org/views/login.php) that provides access to all collected sequence data. There are currently ∼500 000 barcode records available through BOLD, and 49 178 formally described species using barcode data. Although BOLD is often used for species identification, Faith and Baker (2006) note the utility of barcode data for PD assessment as well. A web service will soon provide programmatic access to barcode sequence data. Here we utilize sequence data from the Barcode of Life project ‘Birds of North America’, in order to assess species conservation priorities. This dataset was selected because it is particularly well sampled, including multiple sequences for many of the species in the region of interest (2586 sequences representing 657 bird species along with an outgroup crocodilian sequence for rooting). Work by Kerr et al. (2007) documents the utility of barcoding in documenting species level identification in North American birds. As well, the coverage of species is excellent, representing over 90% of the breeding and pelagic birds in Canada and the United States. These barcodes predominately come from vouchered museum specimens (Kerr et al., 2007). Finally, 23 species included in the BOLD dataset are listed as vunerable, endangered or critically endangered based on IUCN red list criteria (http://www.iucnredlist.org/static/categories_criteria_3_1). The outcome of our analysis is a quantification of conservation priority based on phylogenetic history and extinction risk (as discussed in Faith, 2008) for all the sampled birds in North America. The approach used here is simple: datasets are automatically accumulated from the BOLD website. Unfortunately, a full toolkit of external connectivity tools for BOLD is not yet fully operational but synchronization services to share prealigned sequence data and metadata required for this study are up and running. After also collecting data about the specimens from which sequences were drawn (e.g. taxonomy, geographic information, date of collection), the next step is to perform tree-building. We performed phylogenetic analyses using a RAxML (Stamatakis, 2006) implementation available through a REST API service from the Cyberinfrastructure for Phylogenetic Research (CIPRES) project. In the future, it will be possible to include other potential user-specified analyses (e.g. parsimony or Bayesian
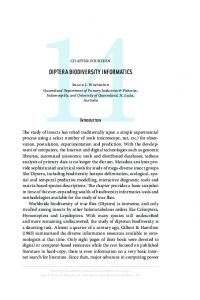
Fig. 2. Conservation values for seven endangered (EN) or critically endangered (CR) bird species in North America calculated based on extinction threat and evolutionary distinctness as implemented by the HEDGE and EDGE algorithms. Full results for all species, including those species listed as vunerable on IUCN red list is available online at: http://biodiversity.colorado.edu/bi/.
analysis). Trees are gathered and stored as a variable within the PHP script. To assess the conservation priority of the data, we ran three analyses: RM (Redding and Mooers, 2006); EDGE (evolutionarily distinct and globally endangered; Isaac et al., 2007); and HEDGE (Steel et al., 2007). These three different analyses are different ways to measure phylogenetic distinctness (see Faith, 2008 for more details). We require an additional piece of information to run these analyses: species extinction probability. To create these we used the IUCN red list ratings, ranging from ‘vunerable’ to ‘endangered’ to ‘critically endangered’, representing risk of extinction. We assigned critically endangered species a 99% chance of extinction in the next 100 years, endangered species a 50% chance of extinction, vulnerable species a 10% chance and least concern and near threatened species a 1% chance, generally following values in Mooers et al., 2008. Accumulating the red list information was done manually using data available from Birdlife International (http://www.birdlife.org/datazone/species/index.html), but this too is a process that could be incorporated into the pipeline itself. Each of these files is read and stored as arrays within a PHP script. Sample files are included at http://biodiversity.colorado.edu/bi/. We generated calculations for RM, EDGE and HEDGE for each of the species from BOLD based on the phylogeny and extinction risk. All results are stored within arrays for further manipulation and output. At http://biodiversity.colorado.edu/bi/ we include a sample output script that utilized the Google Charts API to generate a graph of RM, EDGE and HEDGE results. The results of the EDGE and HEDGE analysis for the seven endangered or critically endangered species are shown in Figure 2. The critically endangered species Brachyramphus brevirostris (Kittlitz’s Murrelet) has the highest EDGE and HEDGE values. Among the endangered species, Pterodroma hasitata (Black-capped Petrel), Oceanodroma homochroa (Ashy storm-petrel) and Brachyramphus marmoratus (Marbled Murrelet) rank next in both EDGE and HEDGE measurements. These four species might therefore be given priority for conservation over the other endangered species Phoebastria nigripes, Grus americana and Centrocercus minimus. Gymnorhinus cyanocephalus (Pinyon Jay, a monotypic taxon) is the
425
R.Guralnick and A.Hill
highest scoring vunerable species based on both EDGE and HEDGE results (results for vunerable species not shown). The case study shows the ease in which sequence data from any higher level taxon of interest in a region of interest can be accumulated from BOLD, analyzed and used along with extinction risk to make assessment of species conservation priorities. Such data could also be used for many other kinds of biodiversity assessment, from determining regional endemism to measuring overall community richness. This case study could be easily extended so that much of the process is automated. Such automation would provide updated knowledge of conservation risk for all organisms as more and more data from BOLD becomes available. This will provide means for unprecedented exploration of evolutionary patterns in biodiversity and ultimately conservation decision making.
7
TRACKING DISEASE EVOLUTION CASE STUDY
The second case study uses much of the same machinery as presented above, only in this case we are tracking diversity of influenza A viruses and how this diversity may have impacts on human health. Unlike the above case study example, we are less interested in overall PD in different regions of the world, although the same approach could be applied to generate those values. Instead, we want to understand how influenza A strains are proliferating across the landscape. Although the focus is on influenza A viruses for this case study, the system can be applied to other biological infectious agents that are of concern. In order to document the continuing evolution of viruses, we have built an information system built around a set of operations that we want to rapidly and automatically perform in order to provide near real-time results for monitoring purposes. The process begins with periodically harvesting genomic data coming in from flu sequencing projects occurring around the globe (e.g. http://www3.niaid.nih.gov/research/resources/mscs/Influenza/). In the last 10 years, the number of sequenced influenza A flu genomes has grown by orders of magnitude and that rate will likely continue or accelerate into the future. From there, we automate construction of alignments and phylogenetic analyses of these genomes, along with automated georeferencing of the locations where the genomes were isolated. Finally, we provide information on which types of animals are carrying which lineages and how the virus might be transmitted among different host types. This information is particularly crucial for documenting increased transmissibility of strains like avian influenza H5N1, now a predominately avian disease, from birds to mammals. Our workflow is designed to accumulate, link and reformat sources relevant to disease evolution and ecology. Currently we utilize only two main data sources: NCBI’s GenBank for genomic data and metadata about viral isolation, and external gazetteers (e.g. the BioGeomancer workbench) and the Getty Thesaurus of Geographic Names (http://www.getty.edu/research/ conducting_research/vocabularies/tgn/index.html) for place names. From these genetic and geographic sources, we can gain sufficient data to reconstruct both relationships among the viral isolates and their location on the globe, and then package that information for the user. Figure 3 summarizes the steps in creating meaningful outputs that can be used for disease monitoring (see Hill and Guralnick, 2008 for full workflow diagram). It is important to note that there are
426
Fig. 3. Influenza monitoring workflow: (1) data harvested from Genbank; (2) data aligned, trimmed and a phylogeny run through the Cipres web service; (3) geographic coordinates and phylogeny used to construct a geophylogeny in KML for viewing in GoogleEarthTM ; (4) outputs made available for users to download and reuse.
numerous places to utilize a distributed network of environmental and biological data resources and methods of analyses. We touch on a few of the obvious distributed resource and analysis tools that can be linked to our application below. Because our system is currently designed for influenza A, data harvesting is generally straightforward. Influenza genetic and associated data already organized and stored at the NCBI ftp site. Therefore, data harvesting is a simple programmatic process of running cURL to transfer the files to a local repository. Following the transfer, the files are parsed into a local PostgreSql database. The parsed data includes the full genome sequence, date of collection, location of collection, the host from which the genome was isolated and any other metadata that might be of interest. In order to allow for mapping, we then tie each isolate to the decimal degree latitude and longitude for its best locality description. In order to link locality strings to latitude and longitude, we currently use a hand assembled library of common localities of influenza isolation. The phylogenetic analysis steps in the process are similar to those described for first case study but first the genomic data needed to aligned. We align each dataset using MUSCLE (http://www.drive5. com/muscle/) and MAFFT (http://align.bmr.kyushu-u.ac.jp/mafft/ software/) services available through the European Bioinformatics Institute (EBI; http://www.ebi.ac.uk/). For the time being, we are currently only running analyses on influenza sampled with full genomes sequenced (those represented by all eight vRNA segments). Alignments are programmatically trimmed, simply removing as many leading and trailing columns as necessary until a certain threshold of the data are represented in the column. Trimmed alignments are stored in the PostgreSQL database. After alignment, we used the RAxML implementation available through a REST API service from the CIPRES project to generate maximum likelihood trees. After phylogenies are returned from CIPRES, we combine phylogeny and geographic information to form the structure of the Keyhole Markup Language (KML) visualization of disease spread viewable in GoogleEarthTM . In short summary, each terminal taxon and hypothetical taxonomic unit (HTU) was assigned a set of geographical coordinates and altitude. Altitude is based on the phylogenetic depth of the node, where terminal taxa rest on the surface of the globe and HTUs are shown floating above the globe— the farther towards the base of the tree, the higher the altitude above
Biodiversity informatics
Fig. 4. Visualization showing a phylogenetic tree of H5N1 avian influenza as projected onto GoogleEarthTM . The visualization is one of the outputs made available through the workflow in Figure 3.
the globe the HTU. For more details on creating these KMLs, see Janies et al. (2007). By utilizing metadata on isolation date and the KML timespan function, we can add an explicit temporal component to the GoogleEarthTM visualization allowing users to track lineage movement over time. Figure 4 presents a snapshot visualization for H5N1 influenza strains. Outputs from our workflow are available here: http://biodiversity.colorado.edu/ipl/. From the website, users can download original datasets, making it possible for them to use our preliminary analyses to formulate hypotheses and predictions, and then refine the datasets to test those predictions. Also available are files from each stage of the analysis, including alignment, and RAxML trees, and KML files. We foresee many future directions to expand our data visualization and analysis workflow. This includes using analysis of codons to provide information about functional changes to the virus. Such a process would be done by programmatically reconstructing the coding sequence from nucleotide sequences, and analyzing those through other programs (i.e. HyPhy’s http://datamonkey.org). An area of particular interest for monitoring would be the automation of the work done by Hill et al. (in press) detecting codon-level selection for known mutations that change how the virus functions (e.g. resistance to antiviral drugs). This case study has a different emphasis in terms of visualization and analysis compared with our first case study. Here, we are less concerned about providing an assessment of conservation priority for a set of taxa in a region of interest, and more focused on continued monitoring, analysis and visualization of how strains of diseases and the mutations they are carrying spread across the landscape. This case study also examines biodiversity—of influenza viruses—and could grow to include how these diseases are both transmitted by, and affect, other vertebrate groups.
8
CHALLENGES, SOLUTIONS AND CONCLUSIONS
We will face numerous challenges along the path to unifying biodiversity data, information and knowledge. One challenge we can address quickly is the lack of information regarding the structure
of the growing biodiversity informatics network. Where are all the sources of digital primary occurrence records and how are they being provided? What online services have already been designed to analyze these data and what mechanisms are in place for programmatic access? What are all the sources of freely available environmental data? What are the terms of data use and is appropriate metadata for attribution of data available? What pipelines are already in place and how are they storing their results? These questions are currently difficult to answer. Much as physical collections have catalogs that map their many specimens, the digital collections, services and pipelines network needs a similar map or registry. At each node of the network, it is necessary that we know the format and method by which data are provided, how it is queried, or how a service is run. This will allow new users and interested groups to immediately locate the data they need, the service they want to run, and determine how they should design their pipeline to make it work within the network. The map should also allow new users to document their own emerging nodes and pipelines. There will be many benefits to mapping this system while it is still young such as: the reduction in duplicated services; improved time to develop new services; and rapid identification of areas where new pipelines or services are still needed. The Biodiversity Information Standards ( http://www.tdwg.org/) group has begun to assemble many of the network nodes, through both their ‘Biodiversity Information Projects of the World’ and ‘Biodiversity Information Networks Database’, yet only fraction of existing points have been documented while such services exponentially increase in number. Another challenge that hinders the union of biodiversity informatics with other informatics fields is that different data from a single organism may be stored in several different collections. When individual records are also associated with global identifiers (GUIDs), it becomes possible to automatically harvest such records from multiple access points (Page, 2008). Such automation provides the means for faster data acquisition and analysis in order document changing genetic, species and ecosystem diversity. The global, unified and continually evolving biodiversity map will be multilayered and multidimensional, representing raw data, summary data and information and knowledge. Using this map will ultimately allow us to make better decisions about how to understand and manage biodiversity in a rapidly changing world. We argue it is already possible and will soon become commonplace for researchers to acquire knowledge, in near-real time, about not only just the changing patterns of biodiversity, but also processes that might be driving those changes. A process oriented view is going to require integration of multiple data types and sources. As the pipelines pushing data that allow us to perform these analyses continue to widen, informatics approaches that are integrative and take from the best of traditional bioinformatics, phyloinformatics and biodiversity informatics will be needed to achieve the goal of such a global biodiversity map.
ACKNOWLEDGEMENTS We appreciate the help of David Schindel and Sujeevan Ratnasingham from the Consortium for the Barcode of Life and Barcode of Life Data Systems for their help in developing our casestudy example automating phylogenetic diversity measurements.
427
R.Guralnick and A.Hill
Our rationale for developing scalable species distribution services developed through discussions with Walter Jetz. Funding: Global Biodiversity Information Facility (#2007-92 to R.P.G. and A.H.); National Biological Information Infrastructure (04HQAG0121 to R.P.G.); National Science Foundation (0110133 to R.P.G.); Gordon and Betty Moore Foundation. Conflict of Interest: none declared.
REFERENCES Bisby,F.A. (2000) The quiet revolution: biodiversity informatics on the internet. Science, 289, 2309–2312. Butler,D. (2006) Mashups mix data into global service. Nature, 439, 6–7. Canhos,V.P. et al. (2004) Global biodiversity informatics: setting the scene for a “new world” of ecological forecasting. Biodiversity Informatics, 1, 1–13. Carstens,B.C. and Richards,C.L. (2007) Integrating coalescent and ecological niche modeling in comparative phylogeography. Evolution, 61, 1439–1454. Chapman,A.D. (2005) Principles and methods of data cleaning. Report for the Global Biodiversity Information Facility 2004. GBIF, Copenhagen, Denmark. Collins,S.A. et al. (2006) New opportunities in ecological sensing using wireless sensor networks. Front. Ecol. Environ., 4, 402–407. Edwards,J.L. (2004) Research and societal benefits of the global biodiversity information facility. BioScience, 54, 485–486. Faith,D.P. (1992) Conservation evaluation and phylogenetic diversity. Biol. Conserv., 61, 1–10. Faith,D.P. (2008) Threatened species and the preservation of phylogenetic diversity (PD): assessments based on extinction probabilities and risk analysis. Conserv. Biol., 22, 1461–1470. Faith,D.P. and Baker,A.M. (2006) Phylogenetic diversity (PD) and biodiversity conservation: some bioinformatics challenges. Evol. Bioinform. Online, 2, 70–77. Ferrier,S et al. (2002) Extended statistical approaches to modelling spatial pattern in biodiversity in north-east New South Wales. I. Species-level modelling. Biodiv. Conserv., 11, 2275–2307. Funk,V.A. and Richardson,K.S. (2002) Systematic data in biodiversity studies: use it or lose it. Syst. Biol., 51, 303–316. Graham,C.H. et al. (2004). New developments in museum-based informatics and applications in biodiversity analysis. Trends Ecol. Evol. (Amst.), 19, 497–503. Guo,Q. et al. (2008) Georeferencing locality descriptions and computing associated uncertainty using a probabilistic approach. Int. J. Geogr. Inf. Sci., 22, 1067–1090. Guisan,A. and Zimmermann,N.E. (2000) Predictive habitat distribution models in ecology. Ecol. Modell., 135, 147–186. Guralnick,R.P. et al. (2006) Biogeomancer: automated georeferencing to map the world’s biodiversity data. PLoS Biol., 4, 1908–1909. Guralnick,R.P. et al. (2007) Toward a collaborative, global infrastructure for biodiversity assessment. Ecol. Lett., 10, 663–672. Heywood,V.H. and Watson,R.T. (1995) Global Biodiversity Assessment. Cambridge University Press, Cambridge. pp. 1–1152. Hijmans,R.J. and Graham,C.H. (2006) The ability of climate envelope models to predict the effect of climate change on species distributions. Glob. Chang. Biol., 12, 1–10. Hill,A.W. and Guralnick,R.P. (2008) A case study for distributed systems and automated biodiversity informatics: genomic analysis and geographic visualization of disease evolution. In Gray,A. et al. (eds) British National Conference on Databases Springer-Verlag Lecture Notes in Computer Science series 5071. Springer, Berlin and Heidelberg, pp. 270–279. Hill,A.W. et al. Evolution of drug resistance in multiple distinct lineages of H5N1 avian influenza. Infect. Genet. Evol. (In press). Hurlbert,A.H. and Jetz,W. (2007) Species richness, hotspots, and the scale dependence of range maps in ecology and conservation. Proc. Natl Assoc. Sci., 104, 13384–13389. Isaac,N.J.B. et al. (2007) Mammals on the EDGE: Conservation for sustainable development. IUCN/United Nations Environment Program/World Wildlife Fund, Gland Switzerland.
428
Janies,D. et al. (2007) Genomic analysis and geographic visualization of the spread of avian influenza. Syst. Biol., 56, 321–329. Jenkins,M. (2003) Prospects for biodiversity. Science, 302, 1175–1177. Kerr,K.C.R. et al. (2007) Comprehensive DNA barcode coverage of North American birds. Mol. Ecol. Notes, 7, 535–543. Kharouba,H.M. et al. Historically calibrated predictions of butterfly species’ range shift using global change as a pseudo-experiment. Ecology (In press). Kress,W.J. et al. (1998) Amazonian biodiversity: assessing conservation priorities with taxonomic data. Biodiv. Conserv., 7, 1577–1587. Lane,M. (2006) Information infrastructure for global biological networks. Microbiol. Aust., 27, 23–25. Loreau,M. et al. (2006) Diversity without representation. Nature, 442, 245–246. Martínez-Meyer,E. et al. (2004) Ecological niches as stable distributional constraints on mammal species, with implications for Pleistocene extinctions and climate change projections for biodiversity. Glob. Ecol. Biogeogr., 13, 305–314. McPherson,J.M. et al. (2006) Using coarse-grained occurrence data to predict species distributions at finer spatial resolutions—possibilities and limitations. Ecol. Modell., 192, 499–522. Mooers,A.Ø. et al. (2008) Converting endangered species categories to probabilities of extinction for phylogenetic conservation prioritization. PLoS ONE, 3, e3700. National Academy of Sciences (2001) Grand Challenges in Environmental Sciences. National Academy Press, Washington DC, pp 1–106. Novacek,M. and Cleland,E.E. (2001) The current biodiversity extinction event: scenarios for mitigation and recovery. Proc. Natl Acad. Sci. USA, 98, 5466–5470. Page,R.D.M. (2008) Biodiversity informatics: the challenge of linking data and the role of shared identifiers. Brief. Bioinformatics, 9, 345–354. Pearce,J.L. et al. (2001) Incorporating expert opinion and fine-scale vegetation mapping into statistical models of faunal distribution. J. Appl. Ecol., 38, 412–424. Pimm,S.L. et al. (1995) The future of biodiversity. Science, 269, 347–350. Redding,D.W. and Mooers,A.O. (2006) Incorporating evolutionary measures into conservation prioritization. Conserv. Biol., 20, 1670–1678. Robertson,D.R. (2008) Global biogeographical data bases on marine fishes: caveat emptor. Divers. Distrib., 14, 891–892. Sarkar,I.N. (2007) Biodiversity informatics: organizing and linking information across the spectrum of life. Brief. Bioinformatics, 8, 347–357. Savolainen,V. et al. (2005) Toward writing the encyclopaedia of life: an introduction to DNA barcoding. Philos. Trans. R. Soc. Lond., B, Biol. Sci., 360, 1805–1811. Soberón,J. and Peterson,A.T. (2004) Biodiversity informatics: managing and applying primary biodiversity data. Trans. R. Soc. Lond., B, Biol. Sci., 359, 689–698. Soberón,J. and Peterson,A.T. (2005) Interpretation of models of fundamental ecological niches and species’ distributional areas. Biodiv. Inform., 2, 1–10. Soberón,J. et al. (2007) Assessing completeness of biodiversity databases at different spatial scales. Ecography, 30, 132–150. Stamatakis,A. (2006) RAxML-VI-HPC: maximum likelihood-based phylogenetic analyses with thousands of taxa and mixed models. Bioinformatics, 22, 2688–2690. Steel,M. et al. (2007) Hedging our bets: the expected contribution of species to future phylogenetic diversity. Evol. Bioinform., 3, 237–244. Stockwell,D.R.B. et al. (2006) The use of the GARP genetic algorithm and Internet grid computing in the Lifemapper world atlas of species biodiversity. Ecol. Modell., 195, 139–145. Waltari,E. et al. (2007) Locating pleistocene refugia: comparing phylogeographic and ecological niche model predictions. PLoS ONE, 2, e563. Wheeler,Q.D. (1995) Systematics, the scientific basis for inventories of biodiversity. Biodiv. Conserv., 4, 476–489. Whittaker,R.J. et al. (2005) Conservation biogeography: assessment and prospect. Div. Distrib., 11, 3–23. Wilson,E.O. (1988) The current state of biological diversity. In Wilson,E.O. (ed.) Biodiversity. National Academy Press, Washington, DC, pp. 3–18. Wilson,E.O. (2000) A global biodiversity map. Science, 289, 2279. Wilson,E.O. (2003) The encyclopedia of life. Trends Ecol. Evol. (Amst.), 18, 77–80. Yesson,C. and Culham,A. (2006) Phyloclimatic modeling: combining phylogenetics and bioclimatic modeling. Syst. Biol., 55, 785–802. Yesson,C. et al. (2007) How global is the global biodiversity information facility? PLoS ONE, 2, e111.