Nov 15, 2013 ... workflow designer, ruby on rails, genomics workflow. ... To solve these issues, we
developed BioFlow; a web based genomic workflow.
BioFlow: A web based workflow management system for design and execution of genomics pipeline
Ashwin Acharya Puthige
Thesis submitted to the Faculty of the Virginia Polytechnic Institute and State University in partial fulfillment of the requirements for the degree of
Master of Science In Computer Science and Applications
David Alexander Mittelman, Co-Chair Harold Ray Garner, Co-Chair Liqing Zhang
November 15, 2013
Blacksburg, Virginia
Keywords and phrases: genomics pipeline, workflow automation, web development, workflow designer, ruby on rails, genomics workflow.
BioFlow: A web based workflow management system for design and execution of genomics pipeline
Ashwin Acharya Puthige
(ABSTRACT)
The cost required for the process of sequencing genomes has decreased drastically in the last few years. The knowledge of full genomes has increased the pace of the advancements in the field of functional genomics. Computational genomics, which analyses these sequences, has seen a similar growth. The multitude of sequencing technologies has resulted in various formats for storing the sequences. This has resulted in the creation of many tools for DNA analysis. There are various tools for sorting, indexing, analyzing read groups and other tasks. The analysis of genomics often requires the creation of pipelines, which processes the DNA sequences by chaining together many tools. This results in the creation of complex scripts that glue together these tools and pass the output from one stage to the other. Also, there are tools which allow creation of these pipelines with a graphical user interface. But these are complex to use and it is difficult to quickly add the new tools being developed to existing workflows.
To solve these issues, we developed BioFlow; a web based genomic workflow management system. The use of BioFlow does not require any programming skills. The integrated workflow designer allows creation and saving workflows. The pipeline is created by connecting the tools with a visual connector. BioFlow provides an easy and simple interface that allows users to quickly add tools for use in any workflow. Audit logs are maintained at each stage, which helps users to easily identify errors and fix them.
Acknowledgements It has been a great learning experience working with Dr. David Mittelman. He is the most hard working person I have ever seen and that has been a great source of inspiration. His teachings and support have helped me tackle the toughest of problems with ease. Even while juggling multiple projects, he has always made time to answer all my questions. I have enjoyed having him as my advisor and look forward to doing more projects with him.
I also thank the members of my committee, Dr. Harold Garner and Liqing Zhang for being supportive and encouraging me with the work. Dr. Garner has always stressed on the importance of quality research and publications. Without his push and advice, this work would never be complete on time.
My wife Vaishali has been very supportive throughout my Masters. I extend my gratitude to her, my parents Murari and Sumitra and my brother Bharath for their emotional and financial support during my life at Virginia Tech.
iii
Contents 1.
Introduction and Motivation .........................................................................................................................1 1.1 Introduction ................................................................................................................................................1 1.2 Motivation ....................................................................................................................................................2 1.3 Current Solutions ......................................................................................................................................5 1.3.1 Taverna .....................................................................................................................................................5 1.3.2 Bpipe ..........................................................................................................................................................7 1.3.3 Galaxy ........................................................................................................................................................7 1.4 Problem Statement ..................................................................................................................................9 1.5 Statement of Objectives .........................................................................................................................9 1.6 Overview of Thesis ................................................................................................................................ 10 2 Architecture........................................................................................................................................................ 11 2.1 Ruby on Rails ........................................................................................................................................... 12 2.2 Ruby Gems................................................................................................................................................. 13 2.2.1 awesome_print ................................................................................................................................... 13 2.2.2 devise ...................................................................................................................................................... 14 2.2.3 htmlentities.......................................................................................................................................... 15 2.2.4 delayed_job_active_record............................................................................................................ 16 2.3 Database Design ..................................................................................................................................... 17 2.3.1 ActiveRecord ....................................................................................................................................... 17 2.3.2 Database tables .................................................................................................................................. 17 2.4 Apache and Phusion Passenger ...................................................................................................... 19 2.5 Client side architecture and stack .................................................................................................. 21 2.5.1 Model View Controller ................................................................................................................... 21 2.5.2 The VIEW .............................................................................................................................................. 22 2.5.3 The Framework ................................................................................................................................. 23 2.5.4 jquery-ui ................................................................................................................................................ 24 2.5.5 jquery-ui-layout ................................................................................................................................. 24 2.5.6 jsplumb .................................................................................................................................................. 26 2.5.7 jquery.ui.touch.punch ..................................................................................................................... 27 2.5.8 jqGrid ...................................................................................................................................................... 27 2.5.9 jquery.tools.min.js ............................................................................................................................ 29 2.6 CSS ................................................................................................................................................................. 29 2.7 Client and Server Communication ................................................................................................. 30 2.7.1 add_workflowitem_controller .................................................................................................... 30 2.7.2 listalljobs_controller ........................................................................................................................ 30 2.7.3 workflow_item_controller ............................................................................................................ 31 3 Features ................................................................................................................................................................ 32 3.1 Add tools ..................................................................................................................................................... 32 3.2 Delete Tool ................................................................................................................................................. 36 3.3 Create Workflows .................................................................................................................................... 37 3.3.1 Tools pane ............................................................................................................................................ 37 3.3.2 Workflow Designer .......................................................................................................................... 38 3.4 Viewing Outputs ..................................................................................................................................... 39 iv
3.4.1 View Outputs Page ........................................................................................................................... 40 3.4.2 Output below the tool ..................................................................................................................... 41 3.4.3 In the workflow page ...................................................................................................................... 42 3.5 Save Workflows ...................................................................................................................................... 43 3.6 Notifications ............................................................................................................................................. 44 3.6.1 JobStatus update ............................................................................................................................... 45 3.7 Connection tooltips ............................................................................................................................... 45 3.7.1 Distributed Execution ..................................................................................................................... 46 3.8 Connection Validation ......................................................................................................................... 47 4 Real world problem ........................................................................................................................................ 48 4.1 The Problem ............................................................................................................................................. 48 4.1.1 Aligner .................................................................................................................................................... 48 4.1.2 Add Or Replace Read Groups ...................................................................................................... 53 4.1.3 Index, Sort, Realign .......................................................................................................................... 55 4.1.4 RepeatSeq ............................................................................................................................................. 56 4.1.5 Final Workflow .................................................................................................................................. 57 4.2 RepeatSEQ ................................................................................................................................................. 58 4.3 Comparison of RepeatSeq and lobSTR ........................................................................................ 59 5 Future Work and Conclusions ................................................................................................................... 62 5.1 Future Work ............................................................................................................................................. 62 5.2 Conclusions ............................................................................................................................................... 63 Bibliography ................................................................................................................................................................. 64
v
List of Figures Figure 1: Workflow in Taverna ..............................................................................................................................6 Figure 2: Create and execute pipelines in bPipe ............................................................................................7 Figure 3: Workflow in Galaxy .................................................................................................................................8 Figure 4: Tool definitions in Galaxy .....................................................................................................................8 Figure 5: Client - Server architecture of BioFlow ...................................................................................... 12 Figure 6: Formatting functionality provided by awesome_print ....................................................... 14 Figure 7: Authenticating Users using devise ................................................................................................ 14 Figure 8: Helpers provided by devise .............................................................................................................. 15 Figure 9: Encoding and Decoding using htmlentities............................................................................... 15 Figure 10: Programming constructs provided by delayed_job for running jobs in background ......................................................................................................................................................... 16 Figure 11: Database Model Diagram ................................................................................................................ 19 Figure 12: Worker processes in Phusion Passenger. Image Credit: http://phusionpassenger.com .................................................................................................................. 20 Figure 13: Virtual Host configuration in Apache httpd.conf ................................................................. 20 Figure 14: Model-View-Controller Pattern in a Ruby on Rails Application................................... 22 Figure 15: Selectors and Event Handling in jQuery ................................................................................. 23 Figure 16: Draggable and Resizable options in jquery-ui ...................................................................... 24 Figure 17: Creating and configuring layouts in jquery-ui-layout ....................................................... 25 Figure 18: Sample division of the page into multiple layouts using jquery-ui-layout ............ 25 Figure 19: Connecting divs using jsplumb connectors . .......................................................................... 26 Figure 20: Sample connection in jsPlumb from Source div to Target div ...................................... 26 Figure 21: Creating and using a jqGrid ............................................................................................................ 28 Figure 22: A sample jqGrid with four columns............................................................................................ 29 Figure 23: Comparison of tooltips generated by the browser and the jquery.tools plugin ... 29 Figure 24: Add Tools form showing multiple context sensitive help boxes ................................. 33 Figure 25: Delete Tool in BioFlow ..................................................................................................................... 36 Figure 26: Tools pane in BioFlow listing all tools added to the application ................................. 37 Figure 27: Workflow Designer - Tools connected to create workflows. The connections indicate the direction of flow of data in the workflows. ............................................................... 38 vi
Figure 28: Parameters pane - Enables users to provide optional parameters to individual tools in the workflow. .................................................................................................................................... 39 Figure 29: View Outputs Page - Shows the list of outputs in the left grid. Selecting a row shows the output of all tools in the workflow. .................................................................................. 41 Figure 30: Output being displayed along with the tool as part of the workflow. ....................... 42 Figure 31: Output being displayed in the same page as the workflow designer. ....................... 43 Figure 32: Creating and saving workflows. Such workflows can be used at a later stage and all the parameters will be prepopulated. ............................................................................................. 44 Figure 33: Notifications are displayed whenever an important event occurs. ............................ 44 Figure 34: Job Status displayed in the workflow page. ........................................................................... 45 Figure 35: Tooltips displayed on connection endpoints of a tool in the workflow ................... 46 Figure 36: Run-On feature in BioFlow which allows the workflows to be executed on another remote machine .............................................................................................................................. 47 Figure 37: Some error messages displayed during Validation process .......................................... 47 Figure 38: Specifying parameters in the AddTools page for the novoalign tool ......................... 51 Figure 39: Specifying parameters in the Add Tools page for the samtools tool .......................... 52 Figure 40: Specifying parameters in the Add Tools page for the AddOrReplaceReadGroups tool .......................................................................................................................................................................... 54 Figure 41: Specifying parameters in the Add Tools page for RepeatSeq Tool ............................. 57 Figure 42: A workflow for identifying genotypes in breast cancer genomes ............................... 58 Figure 43: Correctness of Mapped Reads/Total Reads for various mapping tools. Image Credit: Highnam, G., Franck, C., Martin, A., Stephens, C., Puthige, A., & Mittelman, D. (2013). Accurate human microsatellite genotypes from high-throughput resequencing ................................................................................................................................................................................... 59 Figure 44: Concordant and Discordant microsatellite calls. Image Credit: Highnam, G., Franck, C., Martin, A., Stephens, C., Puthige, A., & Mittelman, D. (2013). Accurate human microsatellite genotypes from high-throughput resequencing data using informed .... 60
vii
List of Tables Table 1: Models used in BioFlow for storing data...................................................................................... 18 Table 2: Mapping of Touch events to Mouse events ................................................................................. 27 Table 3: Description of fields in Add Tools page ........................................................................................ 34 Table 4: Fields displayed in the View Outputs page ................................................................................. 40 Table 5: Parameters in the novoalign command line ............................................................................... 49 Table 6: novoalign command line parameters specified in BioFlow ............................................... 50 Table 7: samtools view parameters specified in BioFlow ..................................................................... 52 Table 8: AddOrReplaceReadGroups parameters specified in BioFlow ........................................... 53 Table 9: RepeatSeq parameters specified in BioFlow .............................................................................. 56
viii
1. Introduction and Motivation 1.1 Introduction A workflow is a well-defined flow of work from initiation to completion. It is a sequence of jobs or tasks to be performed in a particular order. There is an order defined for the execution of tasks. For a task to start, all the tasks before it in the workflow should have completed. A workflow defines the total work to be performed and each task in the workflow contributes to achieving this goal.
A scientific workflow consists of multiple tools or commands that have to be executed in a predefined order. This order is represented in a format such that the dependencies of several tools towards each other are modeled. An evaluation order is determined and a tool is executed only when all the tools before it have executed successfully. A tool may be dependent on the successful completion of multiple tools before it. The workflow software is responsible for identifying the correct order of execution of the tools. A tool can be executed on the same machine, on another machine over the network. It can manipulate data and perform computation as required by the workflow. A workflow management system is a software that provides mechanisms to create and execute workflows. It allows users to define the relationship between various tools and create an order of execution. Some systems allow users to create the individual tools that are a part of the workflow. The system has prior knowledge of how each tool has to be executed, how the
1
results should be collected and stored. It maintains task status and provides a way of notifying users about the current status.
A graphical workflow management system allows users to create workflows using visual programming. It allows creation of a graph-based workflow where the output of one task is linked to another. Users can see the flow of information and hence workflows can be created without the knowledge of programming. A workflow management system that is specifically designed for the analysis of genomes is called a genomics workflow management system. Genomics is a fast-growing field and hence there is a necessity to quickly process genomes and produce results. New tools are being developed every day and the analysis is growing complex. It is required to use multiple tools from various vendors to build workflows and analyze the genomes.
Most of the workflows today are created by writing scripts. This requires programming language and genomics scientists might not be well versed in scripting as it is a field related to Computer Science. It is hence necessary to create a platform that can be used easily and quickly to create and execute workflows. Users should be able to utilize their current knowledge and not have to learn a specialized language for genome analyses.
1.2 Motivation Genomics is the branch of science that studies the genomes of organisms. This includes mapping, analyzing and sequencing genomes. A genome consists of the complete genetic material of an organism. Genomics plays a major role in health and diseases of any organism.
A branch of genome is concerned with sequencing the DNA of various organisms. The cost required for this process has decreased drastically in the last few years. The knowledge of full genomes has resulted in rapid advancements in the field of functional genomics. This helps describe gene functions and interactions using the data produced by the various genomics projects. Functional genomics describes the function of DNA at the gene level. Genomics
2
intends to provide a mapping of information encoded in a genome to an organism‟s health or disease. This information, which describes how a particular mutation affects an organism, will help scientists in identifying and curing various diseases.
Computational genomics is used to refer to the application of computational analysis to genome sequences. This field is mainly concerned in analyzing the sequences of the DNA. There are multiple ways in which DNA can be sequenced. Sanger Sequencing, developed in 1977, was the most widely used method of sequencing. The Sanger method produces long and contiguous DNA sequencing reads, with greater than 500 nucleotides per read. The current need is to sequence DNA at a fast rate and this has resulted in the creation of next-gen sequencing technologies, which parallelize the sequencing and produce very high throughput. There are various techniques for sequencing and they produce sequences with varying read lengths. Some sequencers and theirs read lengths are, Illumina (50 to 250 bp), 454 (700 bp), Ion Torrent (200 bp) and Pacific Bio (2900 bp). Each method has its own sequence accuracy and generates between 35000 to a billion reads per run. Shotgun sequencing technologies produce short reads (25 – 500 bp) and are capable of producing millions of reads in a short interval. The reads produced from the sequencers have to be assembled, aligned and merged to reconstruct the original DNA. The de-novo technique assembles short read to create full sequences and the mapping technique assembles the genome by aligning against a reference DNA.
The DNA sequences themselves are stored in multiple formats - FASTA, FASTQ, SAM and BAM, to name a few. This in turn has resulted in the creation of many different tools for DNA analysis. There are various tools that can sort, add or replace read groups, index, identify indels and perform other operations on the genome data.
Currently, this field is growing at a very rapid pace and new tools are being created every day. Since this field is still developing, there are no standards for the representation of the genomic data and their processing. This has resulted in the creation of a variety of tools that have to be chosen based on the sequencing technology used.
3
The tools are also increasing in complexity. For example, a tool that performs mapping would want to support all the input file formats and read lengths. This makes the command line extremely complex. It is very challenging for researchers to remember all the tool names, their usage scenarios and the command line parameters. It is also important to use the same set of parameters and tools on genomic data so that the results can be easily reproduced for testing and validation purposes. The analysis on the genomes is performed serially by running various tools one after the other. The tools are used to create a pipeline that passes the outputs from one tool to another. At each stage of the pipeline, the previous output is analyzed to identify whether the tool was successful or not. This output is passed as input to the tool in the next stage. This process is repeated until the end of the pipeline is reached. This is a very tedious and error prone process. Currently, writing Perl or Linux shell scripts creates this pipeline. Users require computerscripting knowledge to perform this. Handling error conditions, writing log statements and debugging failures is very difficult. Any output or logs that is produced, is lost as soon as the pipeline terminates.
Due to the size and complexity of the genomic data files, the tools take a lot of computing resources during execution. Even on powerful servers, executing multiple pipelines in parallel will cause resource starvation and slow down all the pipelines. So, some of the pipelines have to be executed in serial and users end up righting more scripts to control the pipelines. The scripts don‟t automatically store the amount of time required by each tool for analyzing the genomic dataset. This will give an estimate of the speed of execution of various tools and enable choosing a better and faster tool.
To remedy these problems, we designed a genomic workflow management system called BioFlow. It is a web based, distributed, workflow management software tuned for the tools in genomics. It has a workflow designer, which allows the creation of the workflows by
4
chaining together various tools and by defining an order for execution of the tools. The output of each tool is saved for viewing at a later time. BioFlow also allows users to add the tools that make up the workflows. It has an easy to use interface that enables users to define the tool by accepting all the command line parameters required for the script, executable or a system command. Once defined, these tools can be reused as part of any workflow.
We have created BioFlow to greatly simplify creation and execution of workflows. It also allows users to easily view results and keep track of which files were generated at which stage. Audit logs are maintained at each stage, which helps users to easily identify errors and fix them. Users without scripting knowledge can easily use the tool‟s web interface and create complex workflows. We have added multiple frequently used tools to the database and used these to solve real world problems in genomics.
BioFlow allows multiple jobs to be queued and executed serially. It employs workers to execute jobs that define the workflow and based on the system resources multiple workers can be started to execute workflows in parallel. BioFlow can run in a distributed environment taking advantage of multiple computational resources available.
1.3 Current Solutions There are multiple workflow management tools that are used extensively in genomics. They are available as desktop and web based workflow execution systems. Some of them are:
1.3.1
Taverna
Taverna is a bioinformatics workflow management tool that is developed by the myGrid team. It supports a wide variety of input tool formats and also has a database with user uploaded tool definitions. Taverna is a desktop application and requires users to download and install a client. The client has a workflow designer where workflows can be created by interconnecting various tools that are part of the workflow.
5
Users are mainly encouraged to reuse services created by other users, developers or scientists. Writing a new service is not straightforward and involves a learning curve. Users need to have code development experience to write the services and hence it is expected that these services will be written by experienced users. These services can be shared for others to use.
All workflows are executed by the Taverna server. The default Taverna setup does not come with a web based interface but there are other applications which provide a web based interface to the Taverna server for executing workflows. So, users need to install Taverna server and an additional application that creates a web interface. Taverna does not have a web based interface for creating workflows. Web interface is available only for running preexisting workflows. So, all workflows have to be created using the workflow designer, which is a desktop application.
Figure 1 shows an example of a workflow created using Taverna. It is part of a larger workflow and does the task of SAM to BAM conversion. Figure 1: Workflow in Taverna
6
1.3.2
Bpipe
Bpipe is a programming language for running and managing bioinformatics pipelines. Bpipe enables users to create bioinformatics pipelines by writing minimal code. It is a programming language for defining and executing pipelines. First, users have to define all the stages of pipelines. Once the stages are defined, they can be linked together to build pipelines. The linking and ordering is done using mathematical operators.
The following example is from the manuscript [2]. The stages are defines as: Figure 2: Create and execute pipelines in bPipe
align_reads = { exec “bwa aln –t 8 $input > $output” } The pipeline can be created using the “+” operator: Bpipe.run { align_reads + dedupe + call_variants }
Inputs and outputs are implicitly provided by Bpipe. Bpipe handles saving inputs and outputs, cleaning logs and passing correct parameters to various stages. Jobs can be restarted from the failed stage whenever it fails. Bpipe does not have a graphical user interface.
1.3.3
Galaxy
Galaxy is an open, web-based platform for creating and executing workflows. It includes a workflow designer where various tools can be linked together to build workflows. Below is an example, which converts a file in SAM format to BAM and applies filtering and sorting on it.
7
Figure 3: Workflow in Galaxy
Adding tools to galaxy is accomplished by writing XML tool definitions. Writing tool definitions involves a learning curve and to reduce the effort required by its users, Galaxy provides a central repository for sharing the tool definitions. An example of a definition that executes a perl script where the input format is FASTA and the output is tabular can be seen below. Figure 4: Tool definitions in Galaxy
8
These tool definitions need to be placed in a directory and will be automatically picked up during restart of the Galaxy server.
1.4 Problem Statement The current workflow automation tools in genomics are powerful but complicated. Since new programs for analyzing genomic data are being created at a rapid pace, it is very important for the workflow software to provide an easy interface that will enable users to add new tools quickly. The mechanism for adding new tools should be based on a familiar interface. If the process requires writing complex tool definitions, then it will be difficult for end users to write tool definitions for all new tools. If it requires programming or scripting to create definitions, the utilization by scientists who are not comfortable with computer technologies will be limited.
The software should be easily accessible from anywhere. This requirement will enable users to run tasks whenever desired. Forcing users to ssh to the server every time they want to execute a pipeline or whenever they want to see the results is difficult and might not be possible always. Users are familiar with web browser and it interfaces and hence an easy way to check results through the browser is required.
The tasks should maintain a history of all the jobs that have been executed. When researchers execute pipelines on hundreds of genomes, it gets difficult to keep track of which results were generated by which commands. So, the workflow automation software should keep track of all the commands that were executed and should save the outputs of every workflow.
1.5 Statement of Objectives The objective of this work is to provide a solution to solve the problems identified before. Hence, we propose to implement the following: 1. Implement BioFlow, a web based workflow automation software.
9
2. BioFlow should support easy addition of tools to the software. Users should be able to add tools quickly. 3. Every generated output should be saved which includes the outputs of workflows and individual tools. 4. It should be usable by users who are not aware of scripting and should not require complex knowledge on computer technologies. 5. It should be simple to identify the output files created by various pipelines. 6. The process of running the jobs on multiple machines should not require complex knowledge of setting up clusters and networking.
1.6 Overview of Thesis Chapter 2 talks about the various technologies used in creating BioFlow. It provides a detailed explanation about the various programming languages and libraries used to make the process of creating workflows simple and error free. The features are discussed in Chapter 3. This chapter discusses how multiple features have been integrated to create the BioFlow application. Each feature has its own requirements and its use cases are discussed explaining the necessity of such functionality.
Chapter 4 discusses a real life solution implemented in BioFlow. A complex workflow is taken and is converted to a solution in BioFlow. This chapter shows the advantages of BioFlow and tries to convince the user that it is a viable replacement to traditional script based workflow management.
The last chapter, Chapter 5 provides concluding remarks and the future work that can be implemented to make BioFlow a better product.
10
2 Architecture We designed BioFlow, a workflow management system for scientific workflows in bioinformatics. BioFlow has been designed to be aesthetically pleasing and its central design policy has been ease of use. BioFlow has been created as a replacement for the current scripting practices in writing and executing workflows. Hence, we decided to create a state of the art user interface that supports familiar and easy drag and drop interfaces for each component of the workflow. The workflows can be created in the workflow designer using visual programming. The web based interface allows BioFlow to be used from anywhere on the Internet and thus facilitates easy tracking of job statuses, error management and recovery.
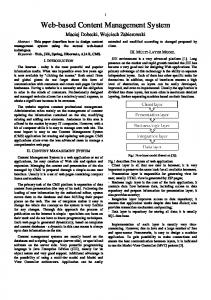
The BioFlow server has been created using the Ruby on Rails web framework and has been deployed on the Apache Server using Phusion Passenger. The client is any HTML5 capable browser and is javascript intensive. It uses the jQuery framework for creating responsive javascript functionalities. The architecture is detailed in Figure 5.
11
Figure 5: Client - Server architecture of BioFlow
2.1 Ruby on Rails Ruby on Rails is an open source web application framework. It is popularly referred to as Rails and is built in ruby.
Rails emphasizes on the “convention over configuration” design paradigm. It provides descriptions and templates that reduce the number of decisions to be made by developers. It provides simplicity without losing any flexibility. Some of the conventions that are followed in rails are:
Rails provides ActiveRecord support that allows mapping classes to database tables. The table names, by convention, are the pluralized forms of the class names
Controller names when matched with the database tables, the convention is to name the controller in plural. Example: Controller for the model user will be names UsersController and the filename should be users_controller.rb.
Rails applications have to be developed in ruby and it uses the Model View Controller architectural pattern. Rails allows rapid prototyping of applications. Rails uses generators to create and perform common tasks. Initial web application creation can be performed using
12
the rails new generator. This creates the folder structure required for any project that follows the MVC architectural pattern. Separate directories are created for Models, Views and Controllers. Rails supports running applications under various modes – development mode, testing mode and production mode. During development mode, code changes are compiled for each new request and enables developers to see results instantaneously.
2.2 Ruby Gems Ruby libraries are distributed as gems. A gem has a name and a version. RubyGems is the package manager for the gems. The following gems have been used in the development of BioFlow.
2.2.1
awesome_print
This gem pretty prints ruby objects which allow visualization of the structure. It prints in color and with proper indentation. This enables easy and fast debugging as wrong values in an object can be spotted quickly. The indentation, color, html content, etc. can be controlled by configuring required options. An example can be seen in Figure 6
13
Figure 6: Formatting functionality provided by awesome_print
2.2.2
devise
devise is a flexible authentication system for Rails. It is a complete MVC solution based on Rails engines. Devise provides a generator to create the model for storing authenticated users in the database. The generator can be executed as rails generate model User.
Devise generates controllers and helpers, which can be included wherever authentication is required. Individual controller methods can be marked as requiring authentication and devise will automatically redirect the user to the login screen if the user is not logged in. An example of using a controller that requires user authentication is shown in Figure 7. Figure 7: Authenticating Users using devise
The views generated by devise can be customized and application specific styles can be applied to the login, signup and forgot password screens. devise follows the modularity concept and hence features such as Lockout, Recover, and Timeout are available as modules. Based on the application, only the required modules can be included. Some helpers provided by devise for various actions are shown in Figure 8
14
Figure 8: Helpers provided by devise
2.2.3
htmlentities
htmlentities is a library that facilitates encoding and decoding of HTML entities. The characters such as “” cannot be directly used in HTML as they are interpreted by the browser as part of HTML causing errors in page rendering. Hence, to display these characters, they should be encoded to “<” and “>”. htmlentities supports all the characters that belong to the HTML5 keywords set. An example is demoed in Figure 9 where encoding and decoding of some characters which are part of HTML are shown. Figure 9: Encoding and Decoding using htmlentities
15
2.2.4
delayed_job_active_record
delayed_job is a gem for executing tasks in the background. delayed_job_active_record is the version of the gem which works with the active record in Rails. delayed_job creates a database table into which jobs scheduled to be executed in the background are inserted. Multiple queues and workers can be created. The workers pick jobs from the database and run them in the background. The workers can exist on the same machine as the database or in any remote machine.
delayed_job provides an easy mechanism to execute jobs in the background. Jobs must execute ruby code. Bioinformatics tasks tend to be long running and in a web server application, the response has to be generated immediately. In such cases, the jobs are moved to the background and executed when server resources are available. Since the jobs are picked up from the database, it also provides an easy way for distributed execution of the background tasks. The database can be accesses over TCP/IP and this enables transfer of job information from one server to another. Some examples of running tasks in background, using queues can be seen in Figure 10. Figure 10: Programming constructs provided by delayed_job for running jobs in background
16
2.3 Database Design BioFlow has been designed to be able to work with any database supported by Rails activerecord pattern. A database can be changed by editing the gem file to download the appropriate connector and by modifying the config file to specify the database host.
By default, BioFlow uses MySQL. MySQL is an open source database which is very stable and secure. It is a relational database management system. The database can be on the same machine as the application or it can be on any remote system. The database IP address, username and password are configurable. The Rails framework provides Object-Relational Mapping capabilities through ActiveRecord.
2.3.1
ActiveRecord
ActiveRecord provides mechanisms for mapping a row of the database to an object in Ruby. When a database table is created, it is automatically mapped to a ruby model. If this class is instantiated, then an activerecord instance will be created. CRUD operations can be easily performed on this instance. Every model is a Table in the database and every instance of the model acts as a row in the table. Select, Update and other queries are automatically generated by the Active Record framework and the programmer has to work directly with the objects. This enables developers to concentrate on the actual logic while being transparent to the workings of the database.
2.3.2
Database tables
2.3.2.1 Model Design The models in Rails are mapped to database tables. The convention followed in Rails is to name the models in singular and the corresponding database table in plural. Rails provides a generator which generates the model class and the database table. The model is
17
mapped to the table and it provides object to relational mapping features which allow data to be read and written from the database as objects.
The following models have been created in BioFlow. Table 1: Models used in BioFlow for storing data
workflow_items
The tools added to BioFlow are stored in this table. The tool definitions are stored as YAML files. At startup, this table is read to retrieve all the tools available in BioFlow.
jobs
The jobs are stored in this table. Every workflow is a job and is stored here. Each job has a jobId and is a primary key.
user_saved_workflows
The workflows saved by the users are stored in this table.
job_outputs
This table is used to store the outputs of the workflows. The output is stored in a YAML file and each tool‟s output is saved.
delayed_job
This table is required for the gem delayed_job. delayed_job uses this table to pass messages and objects for execution in the background.
Users
This table is created by the gem devise. This table stores every user who has signed up and his credentials.
The models and their interaction are shown in Figure 11. The job object represents a workflow and each workflow consists of many job outputs. The joboutputs contains the output of each item in the workflow.
18
Figure 11: Database Model Diagram
2.4 Apache and Phusion Passenger Phusion Passenger is a web server for ruby. It allows applications to be deployed on the Apache HTTP Server. It enables easy deployment of Rails applications with minimal configurations. The directory structure of a rails application can be directly imported into Phusion passenger. It only requires that a virtual host be created within the apache httpd.conf. Phusion also allows deployment in development mode, which is a great
advantage as it facilitates easy test and development cycle for the Rails Apps.
19
Phusion Passenger uses a smart spawn method for creating processes. Phusion Passenger creates the Application Spawner process, which loads the entire Rails application initially. From then on, all processes are created by the Application Spawner. In this way, new workers can be created quickly and whenever required thereby saving system resources. Figure 12: Worker processes in Phusion Passenger. Image Credit: http://phusionpassenger.com
The virtual host entry in the apache httpd.conf requires a Document Root, which points to the public folder in Rails. Figure 13: Virtual Host configuration in Apache httpd.conf 1. 2.
ServerName www.bioFlow.com
3.
DocumentRoot /webapps/root/public
4.
5. 6. 7.
Allow from all Options -MultiViews
20
2.5 Client side architecture and stack 2.5.1
Model View Controller
BioFlow follows a Model-View-Controller architecture. All the requests from the browser go to a controller. The selection of controller is based on the URL requested by the browser. This is also true for the many AJAX calls made in the application. This allows the components of a web application to remain modularized and minimize the dependencies among various modules. Changes in one part will not adversely affect the other parts and hence each module can be developed individually. Figure 14 shows the model-viewcontroller pattern from the point of view of a Ruby on Rails application.
Whenever a browser makes a request, the URL arrives at the web server. Rails uses the “routes.rb” file which consists of all the mapping between the URLs and controllers. Using this file, a controller is chosen and its corresponding method is invoked. If any data is required for processing the request, then these models are accessed like any regular objects. The controller calls the model layer to fetch the required data. The models are retrieved from the database and returned to the controller. If the models are updated, Rails automatically saves it back to the active record database. After performing any business logic implemented in the controller, the view is invoked to return HTML back to the server. The view can access the model data in the controller and hence create appropriate views based on the data. Rails uses the template system for creating views. This view is then sent back to the web server in the language of the browser - HTML. The browsers render this view at the client side where it is visible to the end users.
In this way the model, view and controller remain independent and are not dependent on each other. If any layer changes, then it does not cause any impact on another layer. This allows reusable code to be written and enables independent development of each layer in a web application.
21
Figure 14: Model-View-Controller Pattern in a Ruby on Rails Application
2.5.2
The VIEW
The view or the front end of BioFlow is capable of state of the art features such as drag and drop, context sensitive help and has been developed to be aesthetically pleasing. Hence the view is javascript intensive. At the same time the number of objects on the client side has been kept at a minimum to ensure quicker responses to user interactions. This in turn produces high impact factor on the users and encourages them to use it further and explore all available features. Care has been taken to make sure that there are no annoying popups or flashing lights which decrease the acceptance by users. A minimal layout has been preferred with less number of large buttons. The main page can be customized according to user preference by collapsing or expanding the multiple
22
panels. Once a job is created, these panels do not play any role and hence users can close them to increase the real estate of the workflow part of the page.
The workflow widgets have been created in a bright color so as to indicate its importance on the page. It has various input and output connectors attached that indicate the number of parameters that are required to run the widget. Users do not have to read the help to understand how many inputs are required for any widget to run. Each connector shows help when hovered. This quickly indicates the input it accepts and the outputs it produces enabling users to make connections to other widgets with causing any errors.
2.5.3
The Framework
The view has been created using the javascript library jQuery. jQuery is a small and fast javascript library that provides easy and fast mechanisms to manipulate and run actions on the HTML DOM. It has methods that make constructing and error handling of Ajax calls simple and easy. Traversing a HTML DOM object has been provided through selectors. Browser and HTML event handling is done by adding listeners through jQuery. An example of using selectors and event handling in jQuery can be seen in Figure 15. Figure 15: Selectors and Event Handling in jQuery
function jQueryDemo() { //Selector – document.getElementByID(“leftpanel”) $(“#leftpanel”) //Event Handing $(“#saveButton”).on(“click”, function() { /*process it */} ) }
23
Multiple scripts have been used to bring out the desired effects. The scripts are loaded, only if they are used in the page. The various scripts and frameworks used are:
2.5.4
jquery-ui
jquery-ui is a set of frequently used javascript interactions with the browser and user
interfaces. It is very helpful in building highly interactive web applications. The download is customizable and only those widgets and interactions that are required can be downloaded. This enables maintaining a very small javascript footprint without including any extra unused javascript functions. Some of the jquery-ui interactions used in bioFlow are draggable, droppable and resizable. Accordion layout on the left panel is created using this library. Some other effects such as hover and highlighting are also utilized in bioFlow. jquery-ui is easy to use and below is a code sample in Figure 16.
Figure 16: Draggable and Resizable options in jquery-ui
$(function() { //Make an element with ID=”drag” as draggable $( "#dragg" ).draggable(); // Make an element with ID=”size” as resizable $( "#size" ).resizable(); });
2.5.5
jquery-ui-layout
This script creates a border layout on the main page. It provides functions to divide the page into North, South, East, West and Center. The library is capable of hosting nested layouts. In BioFlow, the page has been divided into the 5 parts – left panel with the tools, the top panel with the Home and SignOut buttons, the center panel with the workflow designer, the right panel which holds the forms for the workflow items and the bottom panel for error and other notifications. Each panel is collapsible with a single click. The panels can be resized to desired size. The initial sizes are percentages and will always render properly whatever be
24
the size of the browser. Events are fired during resize and the widths are calculated again to keep the panel sizes consistent.
Figure 17: Creating and configuring layouts in jquery-ui-layout
$(document).ready(function () { myLayout = $('body').layout({ closable : true // pane can open & close resizable: true // when open, pane can be resized //Setting size east__size : 300 east__minSize: 200 west__maxSize: .5 // 50% of layout width } }
A sample border layout created by jquery-ui-layout can be seen here with the page divided into multiple areas.
Figure 18: Sample division of the page into multiple layouts using jquery-ui-layout
25
2.5.6
jsplumb
This script is used to make the connections between widgets. It creates pipe like connections and hence the name plumb. The script allows customization of the width of the pipes, color, arrow marks and sizes. The ends of the pipes are called endpoints and different shapes can be used for it. The endpoints will always be attached to a div element. jsPlumb provides methods to show tooltips on hover over the endpoints. It fires javascript events through the jQuery whenever connections are made or detached. This allows bioFlow to make
connections on the server side and pass parameters from one widget to another.
jsPlumb provides a connect function that takes the source and target div IDs. Various
styling parameters can be passed to the same function. Usage example can be seen in Figure 19 and the corresponding connection in Figure 20. Figure 19: Connecting divs using jsplumb connectors .
jsPlumb.connect({ // Source and Target Divs to connect source:'window1', target:'window2', // CSS for the connector paintStyle:{lineWidth:15}, // Add style to the endpoint endpointStyle:{fillStyle:'rgb(243,229,0)'} });
Figure 20: Sample connection in jsPlumb from Source div to Target div
26
2.5.7
jquery.ui.touch.punch
This script is used to support touch screen devices. Since desktop browsers work by detecting mouse click and release, the same javascript events do not exist on a touch screen device, which does not have a mouse. So, the script jquery.ui.touch.punch converts touch interfaces to corresponding mouse events. The main advantage is that the same desktop event handlers can be used on a touch screen device. The events generated in a browser and the corresponding mappings to that of a touch device are shown here.
Table 2: Mapping of Touch events to Mouse events
Touch
2.5.8
Mouse
touchstart
touchmove
touchend
mouseover
mousemove
mouseend
mousemove
mouseup
mouseout
click
jqGrid
jqGrid is a javascript based grid used in BioFlow to display the list of jobs that have been
executed. jqGrid provides mechanisms to load from the server directly into the grid. BioFlow transfers data in json and this data is displayed in the grid without creating extra local variables. jQuery event handlers have to be created for row click events. This allows fetching the details for the corresponding job selected in the grid.
27
Loading data into the grid is easy and simple. It requires the URL which returns the models. The element‟s name in the model and the column model should be same. This allows jqGrid to load data into the appropriate column in the grid.
Figure 21: Creating and using a jqGrid
jQuery("#mygrid").jqGrid({ // URL to load the data from url :'server.php?q=2', //Format of the returned data datatype : "json", //Column names and model data colNames :['ProcessName','ID'], colModel :[ {name:'id',index:'id', width:55}, // model details ], //Table title caption :"JOB DETAILS" });
A mockup of a jqGrid can be seen in Figure 22. It shows a grid with 4 columns. The grid displays 10 rows at a time and has pagination buttons at the bottom.
28
Figure 22: A sample jqGrid with four columns
2.5.9
jquery.tools.min.js
This script is used to display stylized tooltips. It modifies the HTML tag “title” to apply styles to it and override the default browser tooltips. This allows customization of the application and change the styles to be consistent with that of the application. This in turn creates a better user interface and contributes positively to the feeling on the user towards the application. Below, in Figure 23, is a comparison of the tooltips produced by the browser and the jquery.tools plugin.
Figure 23: Comparison of tooltips generated by the browser and the jquery.tools plugin
2.6 CSS BioFlow is highly customized to create a similar look and feel all over the application. The CSS of any included javascript libraries have been modified to look similar to BioFlow. The
29
use of images has been minimized and hence the workflow widgets are created using colored divs instead of images.
2.7 Client and Server Communication BioFlow has multiple controllers to isolate requests and decrease response time. Each controller is designed for a specific purpose. This helps in keeping the codebase clean and in isolating bugs and issues. Whenever a request arrives, the methods in the controller load the required objects from the model layer. This data is used in the business logic and is then passed to the view. The views can access this data in creating views. The views create HTML and the controller returns this back to the browser. Some of the controllers and their purpose are mentioned below.
2.7.1
add_workflowitem_controller
This controller is used to add workflow tools to the database. These are the tools that are available in the left panel of the main page that users can drag and drop onto workflow designer. Users have to fill a form with the tool‟s name, summary and the executable along with other details. When submitted, the controller creates a model which stores this data in the database. The tool definition is stored in the „workflow_items‟ table. These tools are displayed when the view is refreshed.
2.7.2
listalljobs_controller
Every job that has been created is stored in the database. A job represents a workflow that the user has created. This controller loads the jobs in the database. This controller is invoked when the user browses to the View Outputs page. The controller loads the last ten jobs that were executed and displays the data in a grid. When a row in the grid is clicked, an AJAX request is fired and the corresponding data is loaded for the workflow and is displayed in the right panel. This controller supports pagination and loads the data in the grid 10 items at
30
a time thereby producing quick response times and decreasing the number of objects on the client side.
2.7.3
workflow_item_controller
This is the backbone of BioFlow application. This controller is invoked whenever the user browses to the workflow designer page. This controller loads all the tools when the workflow designer is loaded. When the workflow is built, this controller creates all the required objects and accepts their parameters. When the user executes the workflow, the objects are passed to a backend job manager. This controller is responsible for creating widgets, sending the parameters to the server, making connections among various tools in the UI and accepting form parameters for each widget. The actions such as Run, Run On, View Output are also handled by this controller. Displaying notifications in the bottom right corner of the page is implemented using AJAX calls and the notification updater is started as soon as a job is started.
This controller uses many helper classes to perform the job. When a job is executed, it is stored in the database and the response is generated. These jobs are picked up by the delayed_job gem, which executes them using the job executor. The number of jobs that run in parallel can be controlled by configuring the workers of delayed_job.
When the job executor starts, it picks up all the objects of the workflow and uses its algorithm to decide the order in which jobs have to be executed. Before a job is started, all the jobs which provide input to it should be complete. Otherwise, the executor stops and updates status in the database. The jobs are executed in serial and the output of each workflow item is collected and stored. The job status will be RUNNING until all the workflow items finish running.
31
3 Features This chapter describes the features of BioFlow and the various technologies used to implement each feature.
3.1 Add tools The main building blocks of workflows are the tools that are linked together to define a workflow. BioFlow has been designed to be easy and intuitive to add tools. Any application that can be executed from a command line can be added as tools. These can be bash scripts, java programs or C executables.
The page has been designed with the intention of making it easy on users to add tools. The tools follow a logical structure similar to the command line parameters passed to any script. Since the users are already familiar with executing scripts and java programs, they will find it easy to add tools to the database in the same structure as the command lines.
Context sensitive help is automatically displayed for each input element in the form. Whenever the user clicks on a form field, a short help is displayed. The help is designed to be non-obtrusive and is positioned to the right of the Add tool form. The help vanishes when the input field loses focus. This enables users to quickly validate that their inputs are as expected by the application. A sample generated command is displayed as soon as the user enters data. This allows users to make minor tweaks to their inputs to get the desired command line structure.
32
The main advantage is that, when a command line has been converted to a tool, it can be used any number of times. It completely removes the necessity of remembering the long and complex list of command line. The tools will be a graphical representation of the parameters and instill confidence in the users that their workflows will be correct. The form that accepts all the parameters is displayed below. The help is shown in the right side of the form.
Figure 24: Add Tools form showing multiple context sensitive help boxes
33
Below, in Table 3, is a brief description of each field in the Add tool page. Table 3: Description of fields in Add Tools page
The name of the tool. This name will be displayed in the tools Name
Summary
pane on the left panel of the Create Workflow page.
A short summary to indicate what the tool does.
The category to which the tool belongs. This is used to group the tools and produce a non-cluttered view for the user while Category
selecting a tool for creating workflows. Tools which perform similar function should be given same category.
There are two command formats supported by BioFlow. This is because of the difference in the parameters accepted by other utilities. They are : Command Format
Paramname [space] Paramvalue : When this option is selected, the parameter and value are separated by a space. For eg : executable –t 60 –time 06:00
Paramname=Paramvalue :
Selecting
this
option
seperates the parameter and its value by an = sign. For eg : executable t=60 time=06:00
Input Details
Number of Inputs Based on the value selected here, the tool learns the number of inputs to accept.
34
For each input, an input type and a parameter name can be passed. This data will be used to create parameters for the executable. The parameter field is the command line param which will be passed to the executable while executing the tool.
Number of Outputs The tool is displayed with as many output ports as selected here.
Output Details
For each output, an output type and a parameter name can be passed. This data will be used to create parameters for the executable. This parameter is same as the parameter that the command line uses.
The command line tool or script that defines the tool being added. This executable will be executed using the value Executable
provided here. Any default parameters that should be passed to the tool should also be mentioned here.
35
Optional parameters, which may be required by the tool, Form Parameters
should be specified here. User can configure these values at run time and should use this field to pass values specific to current instance of the workflow. A sample-generated command is displayed here. Using all the values in the Add Tools page, a command line is created
Generated
and displayed here. This value will help a new user quickly
Command
learn how the system works and enable the user to make corrections before the tool is added to the database.
3.2 Delete Tool Tools added from the Add Tools page can be deleted when users no longer require them. From the Manage Tools page, the delete tool option can be selected. Users have to drag the tool from the tools pane and drop it in the delete box. Tools once deleted cannot be recovered and are removed from the database permanently. The drag and drop feature for deleting tool is shown in Figure 25.
Figure 25: Delete Tool in BioFlow
36
3.3 Create Workflows The Create Workflows page has three sections:
3.3.1
Tools pane
The command line tools that have been added from the Add Tools page will be visible here. The tools are ordered by categories specified while adding tools. This allows the tools to be grouped according to the functionality they perform. Series of collapsible panels are placed in a vertical list with category as headers. Clicking on any header will cause the panel to expand and the tools within that panel are displayed. For each tool, its name and a brief summary are displayed. The tools are draggable objects and can be dragged to the center workflow designer panel and can be seen in Figure 26. Figure 26: Tools pane in BioFlow listing all tools added to the application
37
3.3.2
Workflow Designer
The Workflow Designer is in the center of this page and is used to create workflows from individual tools. A tool is dragged from the left panel and dropped on the center, to add to the workflow. Each tool has input and output connection end points. To pass the output of one tool to another, the output endpoint of former must be connected to input endpoint of latter. BioFlow internally generates a temporary file that is passed as input to the next. The connectors have arrows indicating the direction of data flow. Multiple tools can be added to build workflows.
Figure 27: Workflow Designer - Tools connected to create workflows. The connections indicate the direction of flow of data in the workflows.
38
3.3.2.1 Parameters pane The right pane is the parameters pane. For each tool that is added to the center, parameters can be specified. For example, if datasets are added to the workflow, then the files that they represent can be passed as parameters. Additionally, special parameters decided at run time can also be specified here. Sometimes, tools have two options based on the input file. These can be specified here. At each step of the workflow, an output file is generated. The name of this file is auto generated by BioFlow and can also be specified by the user here. The parameter pane can also be used to provide a name to the job. This will enable easy tracking of the job in the View Outputs page where all the jobs are listed in order. While searching for a particular output in the outputs page, a familiar name will help distinguish the result quicker from other previous tasks. Figure 28: Parameters pane - Enables users to provide optional parameters to individual tools in the workflow.
3.4 Viewing Outputs The output of every executed workflow is stored. Each tool in the workflow has a status which indicates whether the tool completed successfully or not. The status of the individual tools bubble up to reflect the status of the job. So, if a job is successful, then it means that all
39
the tools were successful. This will allow easy tracking of job statuses as the user has to look only for those jobs that have failed. The outputs of the jobs are of high importance to users and hence BioFlow multiple views for viewing the outputs. The outputs can be seen from the View Outputs page, right below the work item in the workflow and also the create workflow page. Each of these are shown below.
3.4.1
View Outputs Page
The View Outputs page lists all the jobs in a grid. The grid shows the job name and its status. Clicking on any row shows the outputs of individual tools. For each tool, the following details are collected. Table 4: Fields displayed in the View Outputs page
Output File
Status
The file that was generated by the tool. Users can specify file names or the name will be auto generated The Status of the tool. Possible values are Success, Failure and Error
Stdout
The standard output generated by the tool.
Stderr
The error generated by the tool The exit code returned after the tool completes execution. A code
Exit_code
of 0 indicates successful completion. For other error code, see the tool‟s documentation
Time Start
The time at which the execution of the tool was started
Time taken
Total time taken by the tool from start till exit code was returned.
40
Figure 29: View Outputs Page - Shows the list of outputs in the left grid. Selecting a row shows the output of all tools in the workflow.
3.4.2
Output below the tool If the user is in the same page where the workflow was created, then it makes sense to show the outputs in the same context as the workflow. Hence, for each workitem it is possible to see the output right below the work item. It can be seen by clicking the View Output button available below the work item whose output is to be viewed. This opens a small sliding panel below the tool and shows the output of that particular item.
41
Figure 30: Output being displayed along with the tool as part of the workflow.
3.4.3
In the workflow page The previous mechanism shows the output of a particular tool. This current mechanism which can be launched by clicking the View Output button shows the output of the whole workflow with individual statuses for all the tools. The output is shown in a panel which slides from the right. The parameter panel is hidden as the output window slides in. When the output is closed, the parameter pane reappers from the right. This output auto refreshes and always shows the current output. This can be used as a dashboard where the output and status of the workflow can be continuously monitored.
42
Figure 31: Output being displayed in the same page as the workflow designer.
3.5 Save Workflows Workflows that have been created in the Workflow Designer can be saved for future use. Such saved workflows will appear in the Left Tools pane under User Saved Jobs. Hence, users have to specify a name and a short summary for every saved workflow. When workflows are saved, their parameters also are saved so that it is easy to re run the workflow. To re-run the workflows, they should be dragged and dropped from the left to the center panel like any other tool. The parameters will be auto populated. The new parameters can be added and the task can be executed. This greatly cuts down the time required to execute workflows.
43
Figure 32: Creating and saving workflows. Such workflows can be used at a later stage and all the parameters will be prepopulated.
3.6 Notifications Figure 33: Notifications are displayed whenever an important event occurs.
The workflow designer page has a notifications box which displays information whenever important changes are performed. When the parameters of the tools are changed, a message is displayed as a confirmation to the user. This feedback gives confidence to the user that his action has been performed. When the workflow is being executed, the notification box will be live and display information as soon as it‟s available. A message is displayed when the job is moved from the queue to execution. Whenever the execution of a tool starts or finishes, the user is notified.
44
3.6.1
JobStatus update
The jobStatus is displayed at a prominent location in the create workflow page. It is displayed just below the buttons in the create workflow page and allows users to quickly identify the state of the job. Possible states are Pending, Running and Completed. Figure 34: Job Status displayed in the workflow page.
3.7 Connection tooltips Tooltips are displayed when hovering over connection endpoints. It displays the labels that were added while creating the tool. It helps users in identifying the expected filetype and make correct connections. When a workflow item has multiple inputs, it creates ambiguity as to which endpoint accepts which output file. But the presence of tooltips removes this ambiguity and allows users to pass the correct outputs down the pipeline.
45
Figure 35: Tooltips displayed on connection endpoints of a tool in the workflow
3.7.1
Distributed Execution
BioFlow can be easily executed in a multi server environment. To do so, the same application should be started on another server. In that application, the database should be configured such that both the instances share the database. This is required because the data exchanged between multiple instances of BioFlow is through the database. Any number of BioFlow instances can be started with the database shared. The files required by the workflow should be accessible by all the BioFlow instances. This can be achieved by placing the files in a shared directory. The same directory when mounted at all BioFlow servers, the files can be easily accessed by all the tools. The name or IPAddress of all the BioFlow servers should be configured in the original server. This allows displaying the option on the create workflow page where the user can select the server to run the task on. This is ideal for a small-scale environment where the users are aware of the processing load on each server. The users can also opt to use random scheduling where they don‟t pick the server to execute the task on and BioFlow will automatically utilize the next available worker.
46
Figure 36: Run-On feature in BioFlow which allows the workflows to be executed on another remote machine
3.8 Connection Validation BioFlow validates all connections before the task is executed. This allows users to correct errors and perform changes to the workflow as required. Checks are made to see that all workitems have connections and that all the inputs have been provided. The errors are displayed in red color in the South panel. Figure 37: Some error messages displayed during Validation process
47
4 Real world problem In this chapter we will discuss how a real world problem can be modeled using BioFlow. This will demonstrate the usefulness of a web based workflow management application in comparison to a scripting based solution.
4.1 The Problem The problem is to identify the genotypes in 50 breast cancer genomes. This task is to be done in a lab environment with 2 computers shared among multiple users. Each machine has 64 cores and 48 GB of RAM. The machines themselves are very powerful but the breast cancer genomic files are very huge and each step of processing takes many hours to many days.
Before we can identify the genotypes using repeatseq, we need to prepare the genomes by mapping, sorting and other operations. These steps have to be done in serial. In other words, a workflow pipeline has to be created to process the files. Below are the steps involved in the workflow with a few of them modeled in BioFlow.
4.1.1
Aligner
The first step in the workflow is to execute an aligner called novoalign. Novoalign is an aligner for single ended and paired end reads. Novoalign uses Needleman-Wunsch algorithm to identify global optimum alignments. It is a multithreaded application capable
48
of performing parallel processing of the input file. It maps next generation sequencing reads to a reference database.
The command line for processing input file using novoalign is novoalign -c threads -d
REF
-f File_1 File_2 -o SAM
[[-k -K
STATS_FILE]]
The significance of each parameter in the novoalign command line is detailed in the table below. Table 5: Parameters in the novoalign command line
Parameter
Meaning Indicates the maximum number of threads that will be used by
-c
novoalign. This value has to be set based on the system capacity.
-d REF
-f FILE_1 FILE_2 –o
Full path name of indexed reference sequence. This file has been indexed using novoindex. The two paired end input files are FILE_1 and FILE_2 Output format is SAM (Sequence Alignment/Map) This option indicates novoalign to collect mismatch statistics for
-k STATS_FILE
quality calibration. Mismatched counts are written to the file passed as parameter.
-K
When this option is used with –k, the mismatch counts include reads from the input quality calibration file.
When modeling in BioFlow, novoalign should be added through the Manage Tools page by specifying the following parameters.
49
Table 6: novoalign command line parameters specified in BioFlow
Parameter Name
Parameter Value
Name of the tool
novoalign
Summary
Aligner
Category
Aligner
Command Line Format
param space value
Number of Inputs
3 - a Reference File, 2 Paired End files.
Number of Outputs
2 - SAM file and STATS file
Form Parameters
none
Executable with default parameters
Novoalign –c 50
The Figure 38 shows the parameters specified in the Add tools page. All the values are filled in to create a tool that can be utilized in the workflow designer.
50
Figure 38: Specifying parameters in the AddTools page for the novoalign tool
The tool – novoalign, generates an output file in the SAM format. The second step of the workflow is to convert this SAM file to a BAM file. SAM stands for Sequential Alignment/Map and is a general format for storing large nucleotide sequence alignments. SAM format stores alignments sequentially, which is beneficial in processing streams of file contents without loading the whole file. SAM format is tab delimited and can be easily converted to other formats and hence is utilized extensively for storing nucleotides. BAM is binary version of a SAM file. Its size is many times smaller than a SAM file. SAM files are compressed using the BGZF format to create BAM files. BAM files along with an index file allow efficient random access.
samtools is an utility that can convert files in the SAM format to BAM. The command to do the conversion is: samtools view –b input_sam
> output_bam
51
This command can be modeled in bioflow by specifying the following parameters: Table 7: samtools view parameters specified in BioFlow
Parameter Name
Parameter Value
Name of the tool
Samtools
Summary
Converts SAM to BAM
Category
Converter
Command Line Format
param space value
Number of Inputs
1 , Input SAM file
Number of Outputs
1, Output BAM file
Form Parameters
None
Executable with default parameters
Samtools view
Figure 39: Specifying parameters in the Add Tools page for the samtools tool
52
4.1.2
Add Or Replace Read Groups
The third step is to Add or Replace Read Groups. This step is performed using the Picard jars, which is a java application. This command replaces all read groups in the INPUT file with a new read group and assigns all reads to this read group in the OUTPUT Bam. The parameters for the new read group are passed as command line arguments to the AddOrReplaceReadGroup.jar file. The command used for this step is: java -Xmx12g -jar AddOrReplaceReadGroups.jar I=INPUT O=OUTPUT SORT_ORDER=coordinate RGID=Read_Group_ID RGLB=novoalign RGPL=illumina RGSM=ID_RGSM CREATE_INDEX=true RGPU=RGPU VALIDATION_STRINGENCY=SILENT
Table 8: AddOrReplaceReadGroups parameters specified in BioFlow
Parameter Name
Parameter Value
Name of the tool
AddOrReplaceReadGroups
Summary
Adds/Replaces Read Groups
Category
ReadGroup
Command Line Format
Param=value
Number of Inputs
1, Input file
Number of Outputs
1, Output BAM file
Form Parameters
none java -Xmx12g -jar AddOrReplaceReadGroups.jar SORT_ORDER=coordinate RGID=Read_Group_ID RGLB=novoalign RGPL=illumina RGSM=ID_RGSM CREATE_INDEX=true RGPU=RGPU VALIDATION_STRINGENCY=SILENT
Executable with default parameters
53
This command contains java arguments as well as arguments to the read groups utility. This command can be modeled in BioFlow as in Table 8. First we note that there are many default parameters and hence these can be included in the command line. The following parameters have to be populated in the Add Tools page. Figure 40: Specifying parameters in the Add Tools page for the AddOrReplaceReadGroups tool
The next step in the workflow is to MarkDuplicates. In this process the aligned reads are examined and the duplicates are located. These regions are then marked and written to the file. The command line for this process is: java -Xmx12g -jar MarkDuplicates.jar VALIDATION_STRINGENCY=SILENT INPUT=INPUT REMOVE_DUPLICATES=false OUTPUT=OUTPUT METRICS_FILE=METRICS MAX_FILE_HANDLES_FOR_READ_ENDS_MAP=1020
The structure of this command is very similar to the previous AddOrReplaceReadGroups command. Modeling it in BioFlow is also similar to the previous command.
54
The output of this command, a file with aligned reads with read groups assigned and duplicates marked, is indexed using samtools. This command creates a .bai file which is the index of the bam file. The index file allows random access of any region within the bam file. Without this file, bams can only be processed serially.
4.1.3
Index, Sort, Realign
The command to index a file is samtools index INPUT_FILE
This command is simple and is easy to be modeled in BioFlow. The indexed file is then sorted using novosort, indexed using samtools, realigned and re indexed. The commands used are shown below. These can be modeled similar to the previous commands.
Command for sorting using novosort novosort INPUT > OUTPUT.bam
Command for indexing the input BAM file samtools index INPUT.bam
Command for executing Genome Analysis Toolkit java -Xmx12g -jar GenomeAnalysisTKLite.jar -I INPUT -R REF -T IndelRealigner -targetIntervals INTERVALS -o OUTPUT_BAM
The command for indexing the Bam file is samtools index OUTPUT_BAM
The final step is to call the genotypes. This is accomplished by a tool called RepeatSeq. A detailed description of RepeatSeq is provided in the next section.
55
4.1.4
RepeatSeq
The command line for RepeatSeq is repeatseq -repeatseq INPUT REFERENCE REGIONS_FILE
Repeatseq takes three input parameters. The first parameter is the input file from previous command. The second file is the list of references and the third file contains the regions. The command can be modeled as
Table 9: RepeatSeq parameters specified in BioFlow
Parameter Name
Parameter Value
Name of the tool
RepeatSeq
Summary
Call Genotype
Category
RepeatSeq
Command Line Format
param [space] value
Number of Inputs
3, Input, Reference, Regions
Number of Outputs
1, repeatseq file
Form Parameters
none
Executable with default parameters
repeatseq -repeatseq
56
Figure 41: Specifying parameters in the Add Tools page for RepeatSeq Tool
4.1.5
Final Workflow
After all the tools have been added, the workflow can be constructed by connecting the various tools and command lines in serial. This complicated workflow with 8 command lines can be easily created by dragging, dropping the tools and connecting them to pass outputs from one tool to the other. The workflow is shown in Figure 42 . This workflow can be saved and executed multiple times. Each time, only the input file needs to be changed. The rest of the workflow is reusable and enabled easy error tracking and debugging of failed tasks. For successful tasks, the filenames and other outputs are saved by the tool and the input can be mapped to outputs easily.
57
Figure 42: A workflow for identifying genotypes in breast cancer genomes
4.2 RepeatSEQ RepeatSeq is a genotyping software package for calling microsatellite repeat genotypes from whole genome resequencing data. Repeatseq uses an error model created from the properties of repeat sequences and the reads that map to it. Using repeat allele determination along with a Bayesian technique of genotyping, RepeatSeq calls microsatellite repeat genotypes.
58
The accuracy of repeatSeq depends on the proper mapping of reads to repeat loci. Hence it was necessary to correctly understand the mapping accuracies of the popular mapping tools such as Bowtie2, BWA, Novoalign, Stampy and SMALT. For this process, simulated reads were created using DWGSIM and we created a graph showing the proportion of incorrectly mapped reads plotted as a function of the proportion of correctly mapped reads.
Figure 43: Correctness of Mapped Reads/Total Reads for various mapping tools. Image Credit: Highnam, G., Franck, C., Martin, A., Stephens, C., Puthige, A., & Mittelman, D. (2013). Accurate human microsatellite genotypes from high-throughput resequencing
We observed that novoalign has the lowest ratio of inaccurate calls to accurate calls.
4.3 Comparison of RepeatSeq and lobSTR lobSTR is also a software product that is capable of identifying repeat mutations. It is a tool for profiling short tandem reads from whole genome sequencing datasets. The tool detects repetitive reads and analyzes them to identify the STR repeat unit. After aligning to the
59
genome, the genotype calls are made. The lobSTR method makes genome wide microsatellite calls but it ignores homopolymers runs.
RepeatSeq‟s algorithm on whole genomes successfully assigns genotypes to ~90% of the repeat loci. RepatSeq assigns genotypes to homopolymers also during its run. To compare the two software, microsatellite calls were made on the same genomes using both RepeatSeq and lobSTR. A table was created that identified all the regions were RepeatSEQ and lobSTR made calls. This table was used to compare the results and some observations were made. It was observed that, for the repeats genotyped by both methods, the same calls were made for ~90% of the repeats.
The table below shows the genotypes assigned by RepeatSeq and lobSTR to the HG01140 genome. Figure 44: Concordant and Discordant microsatellite calls. Image Credit: Highnam, G., Franck, C., Martin, A., Stephens, C., Puthige, A., & Mittelman, D. (2013). Accurate human microsatellite genotypes from high-throughput resequencing data using informed
60
From the table, we can see that RepeatSEQ makes genotypes call for ~90% of reads whereas lobSTR assigns genotypes to only ~3% of the reads. RepeatSeq and lobSTR both assign genotypes to 2% of the reads. The details are published in the manuscript available at [2].
61
5 Future Work and Conclusions 5.1 Future Work The current version of BioFlow can serve as a framework for adding new features. It is easily extendable and new functionality can be plugged in to currently available infrastructure. The current support for the tool infrastructure is simple and clean. But it is limited in performing runtime evaluations such as accepting different number of parameters based on user input selection. Such intelligence can be built into the workflow, but care has to be taken to add to the strength of BioFlow, which is simplicity. Visual programming capabilities can be integrated to enable users to handle error cases automatically and provide more debug logs whenever any job or task fails. A predictor engine can be integrated into BioFlow, which can predict the amount of time each task will take. This is possible because we store the time taken by each task. Adding this new feature will require intelligence on the software which takes into account the input file size, the current tool and the machine on which the task is being performed. For critical tasks, it is important to receive notifications as soon as it is completes or errors out. So, a feature can be added which can send push notifications to smart phones thereby allowing users to take immediate and necessary action.
62
5.2 Conclusions Few applications are available for building workflows in genomics. These applications are very helpful in creating reusable genomics pipelines. The existing tools are not easy to use and require complex programming knowledge. To address these, we created a simple and easy to use application – BioFlow, a web based workflow automation tool. The strength of this software is that it provides mechanisms to convert any command line utility to a tool in the workflow. BioFlow has been designed to be simple and easy to use. This tool will encourage people to utilize such a visual programming technique to create and execute workflows. Executing multiple workflows and tracking their results is effortless. The outputs created at all stages are saved and users can easily map all generated outputs to the parent pipelines. BioFlow‟s simplicity is its strength and can increase adaptation. The interface for converting command line utilities to a tool in the workflow is simple and has a very small learning curve. This enables users to quickly add tools and hence, create workflows effortlessly.
63
Bibliography [1] Highnam, G., Franck, C., Martin, A., Stephens, C., Puthige, A., & Mittelman, D. (2013). Accurate human microsatellite genotypes from high-throughput resequencing data using informed error profiles. Nucleic acids research, 41(1), e32-e32.
[2] Goecks, J., Nekrutenko, A., Taylor, J., & Team, T. G. (2010). Galaxy: a comprehensive approach for supporting accessible, reproducible, and transparent computational research in the life sciences. Genome Biol, 11(8), R86.
[3] Oinn, T., Addis, M., Ferris, J., Marvin, D., Senger, M., Greenwood, M., ... & Li, P. (2004). Taverna: a tool for the composition and enactment of bioinformatics workflows. Bioinformatics, 20(17), 30453054.
[4] Sadedin, S. P., Pope, B., & Oshlack, A. (2012). Bpipe: a tool for running and managing bioinformatics pipelines. Bioinformatics, 28(11), 1525-1526. [5] Li, H., Handsaker, B., Wysoker, A., Fennell, T., Ruan, J., Homer, N., ... & Durbin, R. (2009). The sequence alignment/map format and SAMtools.Bioinformatics, 25(16), 2078-2079. [6] McKenna, A., Hanna, M., Banks, E., Sivachenko, A., Cibulskis, K., Kernytsky, A., ... & DePristo, M. A. (2010). The Genome Analysis Toolkit: a MapReduce framework for analyzing next-generation DNA sequencing data. Genome research, 20(9), 1297-1303. [7] Cock, P. J., Fields, C. J., Goto, N., Heuer, M. L., & Rice, P. M. (2010). The Sanger FASTQ file format for sequences with quality scores, and the Solexa/Illumina FASTQ variants. Nucleic acids research, 38(6), 1767-1771. [8] Gymrek, M., Golan, D., Rosset, S., & Erlich, Y. (2012). lobSTR: A short tandem repeat profiler for personal genomes. Genome research, 22(6), 1154-1162. [9] Bachle, M., & Kirchberg, P. (2007). Ruby on rails. Software, IEEE, 24(6), 105-108. [10] Genomics. http://www.news-medical.net/health/What-is-Genomics.aspx [11] Genomicsnetwork. http://www.genomicsnetwork.ac.uk/holding/ [12] Whole Genome Sequencing. http://en.wikipedia.org/wiki/Whole_genome_sequencing [13] Genomatix. http://www.genomatix.de/online_help/help/sequence_formats.html [14] Emboss. http://emboss.sourceforge.net/docs/themes/SequenceFormats.html [15] Picard. http://picard.sourceforge.net/command-line-overview.shtml [16] Novoalign. http://www.novocraft.com [17] awesome_print. https://github.com/michaeldv/awesome_print [18] devise. https://github.com/plataformatec/devise
64
[19] htmlentities. http://htmlentities.rubyforge.org/ [20] delayed_job. https://github.com/collectiveidea/delayed_job [21] jQuery. http://jquery.com/ [22] jsPlumb. http://jsplumbtoolkit.com/home/jquery.html
65