Environmental Research Letters
LETTER • OPEN ACCESS
Biogeochemical potential of biomass pyrolysis systems for limiting global warming to 1.5 °C
Related content - Impacts devalue the potential of largescale terrestrial CO2 removal through biomass plantations L R Boysen, W Lucht, D Gerten et al.
To cite this article: C Werner et al 2018 Environ. Res. Lett. 13 044036
- Evaluating the use of biomass energy with carbon capture and storage in low emission scenarios Naomi E Vaughan, Clair Gough, Sarah Mander et al.
View the article online for updates and enhancements.
- The role of large—scale BECCS in the pursuit of the 1.5°C target: an Earth system model perspective Helene Muri
This content was downloaded from IP address 178.196.70.225 on 05/05/2018 at 09:17
Environ. Res. Lett. 13 (2018) 044036
https://doi.org/10.1088/1748-9326/aabb0e
LETTER
OPEN ACCESS
Biogeochemical potential of biomass pyrolysis systems for limiting global warming to 1.5 ◦C
RECEIVED
27 October 2017
C Werner1,6 , H-P Schmidt2, D Gerten1,3, W Lucht1,3,4 and C Kammann5
REVISED
1
14 March 2018
2
ACCEPTED FOR PUBLICATION
3
3 April 2018
4
PUBLISHED
5
17 April 2018 6
Original content from this work may be used under the terms of the Creative Commons Attribution 3.0 licence. Any further distribution of this work must maintain attribution to the author(s) and the title of the work, journal citation and DOI.
Potsdam Institute for Climate Impact Research, Telegraphenberg A62, D-14473 Potsdam, Germany Ithaka Institute for Carbon Strategies, Hansa Platz 2, D-20099 Hamburg, Germany Humboldt-Universit¨at zu Berlin, Department of Geography, Unter den Linden 6, D-10099 Berlin, Germany Integrative Research Institute on Transformations of Human-Environment Systems, Unter den Linden 6, D-10099 Berlin, Germany Hochschule Geisenheim University, WG Climate Change Research for Special Crops, Department of Soil Science and Plant Nutrition, Von-Lade Str. 1, D-65366 Geisenheim, Germany Author to whom any correspondence should be addressed.
E-mail:
[email protected] Keywords: negative emission technologies, biochar, bio-oil, mitigation, 1.5 goal, PyCCS, geoengnieering Supplementary material for this article is available online
Abstract Negative emission (NE) technologies are recognized to play an increasingly relevant role in strategies limiting mean global warming to 1.5 ◦ C as specified in the Paris Agreement. The potentially significant contribution of pyrogenic carbon capture and storage (PyCCS) is, however, highly underrepresented in the discussion. In this study, we conduct the first quantitative assessment of the global potential of PyCCS as a NE technology based on biomass plantations. Using a process-based biosphere model, we calculate the land use change required to reach specific climate mitigation goals while observing biodiversity protection guardrails. We consider NE targets of 100–300 GtC following socioeconomic pathways consistent with a mean global warming of 1.5 ◦ C as well as the option of additional carbon balancing required in case of failure or delay of decarbonization measures. The technological opportunities of PyCCS are represented by three tracks accounting for the sequestration of different pyrolysis products: biochar (as soil amendment), bio-oil (pumped into geological storages) and permanent-pyrogas (capture and storage of CO2 from gas combustion). In addition, we analyse how the gain in land induced by biochar-mediated yield increases on tropical cropland may reduce the pressure on land. Our results show that meeting the 1.5 ◦ C goal through mitigation strategies including large-scale NE with plantation-based PyCCS may require conversion of natural vegetation to biomass plantations in the order of 133–3280 Mha globally, depending on the applied technology and the NE demand. Advancing towards additional bio-oil sequestration reduces land demand considerably by potentially up to 60%, while the benefits from yield increases account for another 3%–38% reduction (equalling 82–362 Mha). However, when mitigation commitments are increased by high balancing claims, even the most advanced PyCCS technologies and biochar-mediated co-benefits cannot compensate for delayed action towards phasing-out fossil fuels.
1. Introduction Negative emission technologies (NETs) are increasingly considered mandatory for climate change mitigation strategies limiting mean global warming to 1.5 ◦ C as specified in the Paris Agreement (Schleussner et al 2016, Rockstr¨om et al 2017). The relevance of negative emissions (NE) will even increase if additional carbon balancing has to compensate ongoing © 2018 The Author(s). Published by IOP Publishing Ltd
emissions resulting from delayed decarbonization action (Luderer et al 2013, Rockstr¨om et al 2016). Thus, diverse methods for removing carbon from the atmosphere are currently being discussed as part of mitigation portfolios (Smith et al 2016). Processes relying on the carbon uptake of vegetation, such as bioenergy with carbon capture and storage (BECCS), are among the most promising of these NETs (Smith et al 2016, Burns and Nicholson 2017).
Environ. Res. Lett. 13 (2018) 044036
However, the potential of methods based on dedicated biomass plantations needs to be evaluated in the context of environmental side effects and economic costs along the supply chain (Uludere Aragon et al 2017). Effects on the local climate may be beneficial or disadvantageous, as elevated transpiration may have a cooling effect, while the impact on soil moisture may offset this response in some regions (Wang et al 2017). Moreover the change in albedo, and correspondingly the local energy budget, depends on the land cover prior to the conversion (Georgescu et al 2011, Boysen et al 2017). From a global perspective, the potential of large-scale NE via plantation-based approaches may, however, be rather limited, as they compete with other sustainability goals including food security, respecting planetary boundaries and ecosystem protection (Humpen¨oder et al 2014, Boysen et al 2017, Heck et al 2018). Furthermore, relevant technologies, i.e. the carbon capture and storage (CCS) process, are not yet ready for the market, or require large-scale decisions and societal consent for the geological storages (Fuss et al 2014, Vaughan and Gough 2016). In this study we quantify, from a biogeochemical point of view, the global potential of pyrogenic carbon capture and storage (PyCCS), as an alternative plant-based NET, offering market-ready technologies and additional application options that may lessen pressure on land use and biosphere integrity. Pyrolysis is the thermal treatment of biomass at 350 ◦ C–900 ◦ C in in an oxygen-deficient atmosphere. Three main carbonaceous products are generated during this process, which can be stored subsequently in different ways to produce NE: a solid biochar as soil amendment, a pyrolytic liquid (bio-oil) pumped into depleted fossil oil repositories, and permanent-pyrogas (dominated by the combustible gases CO, H2 and CH4 ) that may be transferred as CO2 to geological storages after combustion. Additionally, PyCCS provides a range of alternative storage options, i.e. sand replacement for building materials (Schmidt 2012, Gupta and Kua 2017) or bioplastics (Kersten and Garcia-Perez 2013) (figure S1 available at stacks.iop.org/ERL/13/044036/mmedia). The production of biochar and subsequent storage in arable soils is particularly worthy of consideration within NE strategies due to its technological adaptability and co-benefits for agricultural productivity (Lehmann and Joseph 2015, Woolf et al 2016). Most outstandingly, application of biochar to arable soils has been shown to improve soil fertility and increase crop yields significantly in many regions (Jeffery et al 2017). While research on biochar has been primarily focused on local and regional scales, its global potential to mitigate climate change has not received much attention. Woolf et al (2010) estimated that global net emissions of CO2 , methane and nitrous oxide could be reduced by up to 1.8 Pg CO2 -equivalents per year through sustainable biochar-only PyCCS as a countermeasure. Only few, crude estimates of the global NE potential of PyCCS exist that actually consider 2
the feedstock supply from large-scale biomass plantations similar to, for example, the assumptions generally made for BECCS. While Woolf et al (2010) only considered residues and plantations on abandoned land, Matovic (2011) uses a large-scale approach to estimate the biomass globally available for pyrolysis and corresponding sequestration rates by assuming that 10% of the global NPP would be available for biochar production, resulting in 4.8 GtC yr−1 NE. A more detailed, process-based estimation of the global NE potential of biochar systems is still lacking. Therefore, we applied the LPJmL Dynamic Global Vegetation Model (Bondeau et al 2007, Schaphoff et al 2013) to calculate the biomass available for pyrolysis and the corresponding NE potential of PyCCS under a set of rules for global land allocation. We use the model to project biomass plantation areas required for reaching the target of a maximum mean global warming of 1.5 ◦ C (assuming mitigation demands of 100, 200 and 300 GtC NE over the period 2020–2100, respectively). Further, we evaluate how inclusion of additional carbon balancing demands affect the pressure on land (represented by +200 and +700 GtC NE). For each scenario of combined NE demands, we examine whether the respective target is achievable through large-scale plantation-based PyCCS, given different constraints on conversion of land for such a purpose. We also analyse how inclusion of bio-oil and CO2 -CCS in the PyCCS technology as well as a yield increase associated with biochar use might ease pressure on land.
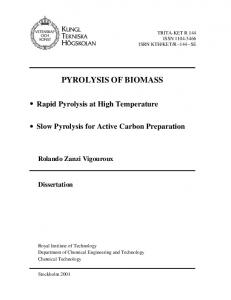
2. Method 2.1. Overall approach We apply the process-based Dynamic Global Vegetation Model LPJmL to simulate biomass production on dedicated plantations over the time period 2020–2100 and determine the respective land requirements. The latter follows an allocation scheme that minimizes land conversion by primarily selecting 0.5◦ grid cells with highest net NE rates outside of agricultural areas and areas of conservational interest (which can be taken into account if required, see below). For each cell, the net NE are simulated accounting for (1) carbon losses due to the land conversion, (2) the initial harvest of biomass at a clearing event before plantation growth, (3) the total harvest from the biomass plantations over the simulation period, and (4) the conversion efficiencies of three technological pathways. In total, we analyse 54 scenarios characterized by different combinations of mitigation strategies, carbon balancing demands, technological pathways, and land gain from biochar-mediated yield increases (see figure 1 for overview). In each scenario, NE requirements are given by the respective mitigation target and the optional addition of NE demands due to carbon balancing intentions covering cases of failed or delayed
Environ. Res. Lett. 13 (2018) 044036
Figure 1. Scenario setup showing the 54 studied combinations of primary NE demands from mitigation strategies, additional NE demands from optional carbon balancing efforts, technological pathways, and land gains from biochar-mediated yield increases. In rows three and four, the first bars describe the following grouped bars. Scenarios that require plantation expansions into areas of conservational interest (see results section) are framed in red.
mitigation. The amount of biomass required for these NE targets, however, depends on the three technological pathways which feature different sequestration efficiencies. Furthermore, we include the option of sparing natural vegetation from conversion to biomass plantations due to biochar-mediated yield increases on cropland (figure 1). Finally, we analyse to what extent technological innovation of the biochar sequestration and the gain in land induced by biochar-mediated soil fertility increases may prevent conversion of areas of conservational interest. 2.2. Negative emission targets We represent a set of NE targets for mitigation and carbon balancing strategies to reflect the diversity of pathways that ‘pursue efforts to limit the temperature increase to 1.5 ◦ C above pre-industrial’ (UNFCCC 2015). Our set of NE requirements for mitigation is based on assumptions from energy– economy–environment scenarios consistent with a +1.5 ◦ C temperature limit by 2100 assessed by Rogelj et al (2015) in the REMIND and MESSAGE Integrated Assessment Models (IAMs). The value of 200 GtC approximates their median of cumulative NE at 800 Gt CO2 (equalling ∼218 GtC), whereas the 100 GtC and 300 GtC values approximately cover the outer bounds of those IAM results (450 and 1000 Gt CO2 equalling ∼123 and 272 GtC). In addition to the amount of NE needed to stay below a warming of 1.5 ◦ C within settings of stringent mitigation measures, we account for the option of carbon balancing to compensate for undesired emissions, should single or multiple mitigation actions fail (due 3
to lower efficiency increases, higher energy demands, persistence of the fossil fuel lobby, etc.) (Luderer et al 2013, Rockstr¨om et al 2016). We consider carbon balancing options that require another 200 or 700 GtC NE on top of the 100, 200 or 300 GtC NE demand from the mitigation scenarios. The balancing of 700 GtC corresponds to the stark difference in median cumulative CO2 emissions between RCP4.5 scenarios (IPCC 2013) and 1.5◦ -consistent scenarios (Rogelj et al 2015) (∼685 GtC [482–951 GtC]). It represents the case in which mitigation measures besides the expected 100, 200 or 300 GtC NE fail to such a degree that emission rates would rise to RCP4.5 levels—which is likely to result in a 2.4 ◦ C (1.7–3.2 ◦ C) warming by 2100 (IPCC 2013) if not counteracted by additional carbon sequestration. Alternatively, we consider a lower balancing demand of 200 GtC, representing the additional NE requirements needed to balance emissions that would otherwise lead to RCP2.6 concentration levels and a likely warming of 1.6 ◦ C (+/−0.7 ◦C), close to the difference in median estimates of 175 GtC [27–356 GtC] (IPCC 2013, Rogelj et al 2015)). 2.3. Technological pathways The efficiency of the transformation of biomass carbon into a sequestered carbon depends on the pyrolysis products used for sequestration—here, represented in three different technological pathways (see table 1 and third row in figure 1). Lower slow-pyrolysis temperatures (HTT, highest treatment temperature) maximizes the biochar yield and leads to lower bio-oil and permanentpyrogas yields. However, higher HTTs lead to more
Environ. Res. Lett. 13 (2018) 044036
Table 1. Comparison of main biomass based NE technologies and carbon sequestration pathways (solid biochar, liquid bio-oil, and liquefied CO2 ). While all three are complementary sequestration methods of PyCCS, BECCS is only based on liquefied CO2 -CCS. Type of sequestered carbon Sequestration scenario Storage type Estimated MRT
Estimated time to develop technology for planetary scale-up C-density of the stored C Scale of implementation
Main environmental risks
Suitable biomass
Estimated price per ton of sequestered carbon to date
Additional material uses
Recovery of sequestered C Social acceptance
Biochar basic PyCCS
Bio-oil advanced PyCCS
Agricultural soil; industrial materials >700 y (Lehmann et al 2015)
Depleted oil and gas fields; industrial materials >100’000 y (geological integrity demonstrated by ability to hold fossil oil for millions of years)
>2–10 y (Schmidt and Shackley 2016)
10–20 y
150–250 kg C m−3 (Lehmann and Joseph 2015) Suitable both for small landholders and large-scale industries; it enables bottom-up and top-down processes No known risks if biochar production and application underlies strict quality control and certification (Domene et al 2015, Buss et al 2016) Wide range of pure and blended biomass: wood, harvest residues, bio waste, sewage, end-of-life-cycle organic materials such as paper fiber sludge etc. 0–400 US$ depending on added value of application. Economically viable even with modest carbon credit pricing (Schmidt and Shackley 2016, Shackley et al 2015) Replacement of sand in building industry, paper industry, plastics and composite materials, electronics, agriculture, animal farming etc. (Schmidt 2012) Mostly impossible Neutral to rather positive as linked to increasing soil fertility or e.g. odor reduction (manure management) (Schmidt and Shackley 2016)
590–730 kg C m−3 (Neves et al 2011) Suitable for small landholders and large-scale industries. Sequestration requires international top-down governance. Leakage and spilling during transport.
Wide range of pure and blended biomass: wood, harvest residues, bio waste, etc.
No cost evaluation available. Exceeds the price of crude oil that it is supposed to replace. Dependent on carbon credit pricing. Raw material for chemical industry (Crombie and Ma˘sek 2014), road construction (Raman et al 2015), fuel cells (Benipal et al 2016), agriculture (Tiilikkala et al 2010) Possible Might face fundamental opposition (e.g. if the value transfer is mainly to OPEC countries)
Biomass nutrient cycling
Most biomass minerals return, organically bound, back to soil when biochar is used as soil amendment
Low mineral content and thus low nutrient loss (mainly S, N) when co-produced biochar is applied to soil
Added value due to side effects of C-product sequestration pathway
Agriculture: Increase of soil fertility; reduced nitrate leaching; increased nutrient use efficiency; likely increase of soil resilience to extreme events (e.g. improved infiltration); Building materials: improved insulation and material strength; lower weight; NOx decomposition
Sequestered bio-oil can be recovered by future generations as chemical raw material or carburant
4
CO2 BECCS and ideal PyCCS Geological storage mainly dependent on the natural environment of the storage location, with high uncertainties in the long term (Guest et al 2013, Mclaren 2012, Harvey et al 2012) >20 y (Vaughan and Gough 2016) 135–220 kg C m−3 (IPCC 2005) Large-scale industrial process. Sequestration requires international top-down governance. Groundwater contamination, massive leakage during natural catastrophes (Vaughan and Gough 2016, Burns and Nicholson 2017) Current BECCS technology requires homogenous biomass (i.e. preferential from monocultural production); in theory, all types of biomass possible 150–165 US$ (Vaughan and Gough 2016, Kemper 2015) Dependent on carbon credit pricing.
Biochemical conversion into biofuels and energy storage (power to fuel) (Schemmea et al 2017), chemical industry
Impossible ‘Nimby-effect’ comparable to radioactive waste deposits, civilian discomfort and likely resistance due to fear of known and unknown risks (Vaughan and Gough 2016) In BECCS abiotic minerals in ash fraction, higher nutrient losses due to higher combustion temperature. In PyCCS nutrients are recycled via biochar fraction. none
Environ. Res. Lett. 13 (2018) 044036
Table 1. Continued. Type of sequestered carbon Sequestration scenario Additional negative emissions, or potential for added NE due to C-product sequestration
Biochar basic PyCCS
Bio-oil advanced PyCCS
Reduction of N2 O emissions from agricultural soils, reduction of CH4 emissions in rice farming; potential reduction of CH4 emission from ruminants (feed additive) (Kammann et al 2017); potential C-ROI in soils when more plant-derived C is retained (SOC build-up) (Weng et al 2017)
recalcitrant biochar, resulting in longer mean residence times when applied to soil (Zimmerman et al 2011, Lehmann et al 2015). For the purpose of the present study, we selected a standard so-called rotary kiln type slow pyrolysis system with a HTT of 450 ◦ C and no reactive or inert gas injection (Fagern¨as et al 2012, Peters et al 2017). The selected pyrolysis parameters (table S1) are a reasonable compromise between a rather high biochar yield (55% of the initial biomass carbon) with extended biochar mean residence times in soils (>750 years, (Camps-Arbestain et al 2015, Lehmann et al 2015)) at medium bio-oil yields (34% of biomass carbon) and a low permanent-pyrogas yield (21% of biomass carbon) (Neves et al 2011). On the basic PyCCS track, we account for only the sequestration of biochar in soil, resulting in an overall efficiency of 47% of the feedstock carbon being captured (figure S2). While 55% of the feedstock carbon is captured in the produced biochar, we account for biomass harvesting, chipping, pre-drying, transport and soil application with a carbon expenditure of 5%. We further apply a 10% carbon loss (based on the initial biomass carbon) for biochar carbon degradation once it is applied to the soil. Based on extended literature reviews we assume that, at hydrogen to carbon ratios (H/Corg ) below 0.4 as achieved at 450 ◦ C, a maximum of 10% of the biochar carbon will be emitted to the atmosphere during the first 80 years after soil application (Lehmann et al 2015). The advanced PyCCS pathway additionally accounts for the sequestration potential of the liquid bio-oil (figure S3). Pyrolytic bio-oil has comparable properties to fossil crude oil, with a less complex chemistry, but similar environmental toxicity following suitable post-pyrolysis treatment (Zhang et al 2007, Fermoso et al 2017, Louwes et al 2017, Varma and Mondal 2017). Long term storage (>1000 years) can be achieved by pumping the oil into depleted fossil oil fields. The geological integrity of the sequestration deposits was demonstrated by their ability to hold fossil oil for millions of years without leakage. Moreover, geological sequestered bio-oil could be recovered from the deposits by later generations when atmospheric carbon is eventually balanced; it could then 5
None
CO2 BECCS and ideal PyCCS none
be used for fuel or chemical purposes as done today with fossil oil. We account for carbon leakage during transportation of the bio-oil to the final repository and the millennial underground storage with a 2% loss. This results in a NE efficiency of 77% of the harvested biomass carbon for the advanced PyCCS track. While the basic and advanced PyCCS are technologically ready for implementation (Lehmann and Joseph 2015), we investigate an ideal PyCCS technology track including the CO2 -CCS of the combusted permanent-pyrogases to estimate the maximum sequestration that is theoretically possible (figure S4). As it is a mere theoretical evaluation, the ideal pathway is labelled and interpreted accordingly throughout this analysis. Whereas the energy required for the CO2 -CCS process would have to be provided by carbon-neutral energy, we still assume a 10% expenditure for the permanent-pyrogas production and subsequent CO2 CCS as inevitable. Assuming a leakage rate of 5% over 80 years for the geological CO2 storage (Kemper 2015, Vaughan and Gough 2016) and a pyrolysis HTT of 500 ◦ C, the ideal PyCCS pathway implies a NE efficiency of 86% (table 1, S1). 2.4. Benefit of yield increases When applied as a soil amendment, biochar does not only contribute to climate change mitigation via NE, but may also substantially increase crop yields as it enhances humus formation, soil fertility and water holding capacity (Liu et al 2013, Jeffery et al 2017, Weng et al 2017). In a meta-analysis of 109 independent studies, Jeffery et al (2017) found on average a 25% increase in crop yields in the tropics and subtropics (latitudes between 35◦ N to 35◦ S) and no yield increase in temperate latitudes. Our study addresses these biochar-mediated benefits by a simple substitution approach assuming that 20% of the tropical and subtropical cropland becomes available for biomass plantations. The underlying rationale is that a yield increase of 25% enables a constant crop production on 80% of the land. For scenarios including this land gain, the NE target can, thus, be reduced by the amount that is simulated to be accomplished on 20% of the tropical agricultural land.
Environ. Res. Lett. 13 (2018) 044036
2.5. The model LPJmL We use the process-based Dynamic Global Vegetation Model LPJmL (version 3.5) to estimate the biomass harvest required as feedstock for pyrolysis for producing the targeted NE for the different scenarios. At daily time steps and a spatial resolution of 0.5◦ × 0.5◦ , key ecosystem processes such as photosynthesis, carbon allocation, evapotranspiration, plant and soil respiration are simulated in a direct coupling of the carbon and hydrological cycle. Detailed descriptions of vegetation and biogeochemical dynamics in LPJmL can be found in Sitch et al (2003), Bondeau et al (2007) and Schaphoff et al (2018), hence only a short summary is provided here. For key processes, detailed model validations have been conducted by Schaphoff et al (2018). Vegetation is represented by 9 natural plant functional types (Sitch et al 2003), 13 crop functional types and managed grasslands for agriculture (Bondeau et al 2007). Three bioenergy functional types (BFTs) were used to simulate the biomass feedstock for the pyrolysis (Beringer et al 2011, Heck et al 2016). The parametrisations of Eucalyptus in tropical climates and poplar and willow in temperate climates for woody BFTs as well as C4 grass on dedicated plantations have been calibrated with field observations by Heck et al (2016). Woody BFTs are simulated to be harvested in an 8 yr cycle, while the herbaceous BFT is modelled to be mowed once or several times a year (i.e. 85% leaf mass at the annual peak or if aboveground carbon storage >400 g m−2 ). The BFT we assume to be grown in each grid cell is chosen to be the one achieving the highest yield in the respective cell over the time period 2020–2100 that is tested for in preceding model runs. The model is driven by an ensemble of 19 temperature-stratified sets of climate data (air temperature, precipitation, cloudiness) reaching 1.5 ◦ C of mean global warming above preindustrial in the year 2100 as provided by the pattern-scaling approach of Heinke et al (2013). Further required inputs are annual atmospheric CO2 concentrations consistent with these simulations, data on soil texture to drive soil processes as described by Schaphoff et al (2013) based on the Harmonized World Soil Database (FAO et al 2012), and river flow directions (V¨or¨osmarty et al 2011) for the river routing module (Rost et al 2008). Grid cell shares of current cropland and grazing land were generated by harmonizing HYDE 3.2 data (Klein Goldewijk et al 2017) with country-specific irrigation efficiencies (J¨agermeyr et al 2015) and crop types (Frieler et al 2017). Preceding the simulations from 2020–2100, we first achieved an equilibrium of soil carbon and distribution of natural vegetation through a 5000 year spin-up without land use during which the climate of the years 1901–1930 is repeated and, subsequently, we introduced the influence of agriculture on the carbon balance with a second spin-up period of 390 years and simulations of the historical land use change until 2015. For the simulations of 6
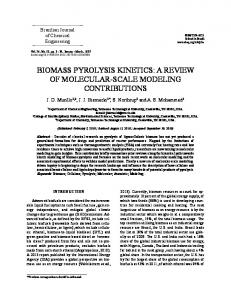
required biomass plantations in the period from 2020– 2100, the land use pattern was held constant at year 2015 state, since it is beyond the scope of this study to account for the balance of agricultural innovations decreasing pressure on land or (oppositely) for population growth and diet changes increasing it. Thus, all present agricultural land (cropland and pasture) is excluded from conversion to biomass plantations (figure 2). Also, wetlands (Kaplan 2007) are spared due to disproportionately high carbon losses that would come along with a conversion (MEA 2005). On the remaining natural land, we follow a general rule of minimum land conversion and a prioritization procedure based on biodiversity measures. We exclude areas of significant conservational interest based on biodiversity hotspots (Mittermeier et al 2011), protected areas (IUCN&UNEP-WCMC 2015), intact forest landscapes (Potapov et al 2017), endangered species (Pimm et al 2014), and endemism richness (Kier et al 2009) (figure 2, S2). As the current situation of global biodiversity is already alarming (Steffen et al 2015), this definition should be seen as a suggestion for a minimum level of biodiversity protection. Only if the non-cultivated land outside these areas is not sufficient to supply the scenario-specific NE demand, biomass plantations will be implemented in those particularly vulnerable regions to the extent required. Since large-scale implementation of biomass plantations may have severe biogeochemical and ecological impacts, we developed an algorithm seeking to minimize, in each scenario, the area converted to plantations by prioritizing the grid cells with highest net NE and sequentially including lesser productive areas, until the targeted global NE requirement is reached (100–1000 GtC, see figure 1). For every grid cell, the efficiency regarding the production of NE is calculated as net NE rate (figure S8). The latter accounts for the total carbon sequestration of clearing-related and plantation-based PyCCS as well as the losses of carbon due to the conversion of natural vegetation. In addition to the plantation yields from the BFT shares, the timber harvested at the initial clearing event is thus included as feedstock for PyCCS. The changes in the vegetation, litter and soil pools of the ecosystems are calculated by comparing the carbon stocks of the PyCCS scenarios with a reference simulation without biomass plantations. Besides the efficiencies regarding the net NE, we apply a minimum biomass productivity threshold of 5 tons DM ha−1 to account for economic viability (Hastings et al 2009). Other suitability indicators, such as terrain slope (Cai et al 2011) were not considered, due to the spatial resolution, but should be included in future analyses. To test for the sensitivity of our results regarding the assumptions about land availability, reflecting the possibility that not all of the nature conservation criteria will be considered or single aspects will be rated
Environ. Res. Lett. 13 (2018) 044036
Figure 2. (a) Areas potentially available for biomass plantations (cell fractions) outside of areas of conservational interest (green colours) and within those areas as constrained by agricultural land fractions and wetlands (red to yellow colours), resulting from the definition of areas of conservational interest (b) as described in S2, the exclusion of wetlands (c) according to Kaplan (2007), and the agricultural areas (d) according to HYDE 3.2 (Klein Goldewijk et al 2017). More detailed maps of the exclusion criteria are provided as figures S5, S6, and S7.
as less important, we exclude the areas of high extinction risk (Pimm et al 2014)—the most extensive of all considered measures—from our priorization scheme. In this alternative setting, the majority of areas indicating high extinction risks is still protected due to other conservational interests mostly regarding intact ecosystems, whereas some widely cultivated regions where biodiversity is substantially threatened by the current agricultural expansion are disregarded.
3. Results Our analysis shows that NE required for meeting a global warming target of 1.5 ◦ C above preindustrial level are potentially achievable through plantationbased PyCCS—yet implying extensive land use change. For each scenario combination, we calculated the mean 7
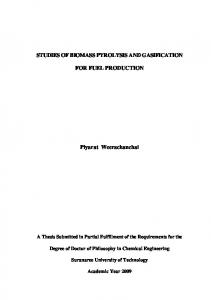
land area required to produce the pyrolysis feedstock for the corresponding NE demand based on climate change simulations from 19 climate models. While the areas chosen for biomass plantations somewhat differ among these simulations (according to the respective spatial distribution of the most productive areas), the total global areal extents are very similar across the scenarios (max. +/− 3%, figure 3). Given the basic PyCCS track, vast areas of natural vegetation, i.e. >280 Mha, would have to be cleared for biomass plantations even in the scenario assuming a modest mitigation target of 100 GtC NE over 2020–2100 (table 2, figure 3). This is a larger fraction of the terrestrial surface than currently covered by wheat fields (FAO 2017). Doubling the NE demand to 200 GtC would even result in a projected plantation extent of 776 Mha (the converted area increases disproportionally as the share of lesser productive grid cells
Environ. Res. Lett. 13 (2018) 044036
z Figure 3. Simulated extents of biomass plantations (Mha) on uncultivated land as mean values over simulations based on 19 climate scenarios for the basic (green), advanced (blue) and ideal pyrolysis technology (PyCCS) (pale purple) under the three mitigation scenarios (bold blocks) and additional carbon balancing of 200 GtC (darker stacked bars on the left) and 700 GtC (lighter stacked bars on the right), respectively. Variabilities due to the climate scenarios are indicated as whiskers. The reductions in land requirements potentially induced by biochar-mediated increases in agricultural yields are indicated by the hatched areas. The maximum area available for biomass plantations following conservational interests is on average 1437 Mha (red dotted line)—every plantation extent beyond this threshold advances into areas of conservational interest (compare figure 2).
Table 2. Area [Mha] of biomass plantations on uncultivated land (mean over 19 climate scenarios) required per negative emission target for each technological pathway (PyCCS). Primary mitigation targets are given in bold with carbon balancing options below. Land requirements within areas of conservational interest are recorded in brackets. The columns with biochar (BC) land gain are italicised and consider biomass production on 20% of tropical and subtropical cropland which is gained due to biochar-mediated productivity increases. Required conversion of natural vegetation for biomass plantation [Mha] Basic PyCCS Mitigation 100 GtC 285 + 200 GtC balancing (300 GtC) 1478 (41) + 700 GtC balancing (800 GtC) 2650 (1213) Mitigation 200 GtC 776 + 200 GtC balancing (400 GtC) 1676 (239) + 700 GtC balancing (900 GtC) 2944 (1507) Mitigation 300 GtC 1478 (41) + 200 GtC balancing (500 GtC) 1894 (457) + 700 GtC balancing (1000 GtC) 3280 (1843)
Advanced
PyCCS + BC land gain 123 1158 2517 (1080) 511 1577 (140) 2799 (1362) 1158 1787 (350) 3111 (1674)
increases; see figure S8). Analogously, a total NE supply of 300 GtC would even require biomass plantations on an area of about 1480 Mha, almost equalling the size of current global cropland if only basic PyCCS was applied (table 2, figure 3). This scenario would imply a transgression into areas of conservational interest of over 40 Mha (table 2, figures 1, 3). In scenarios where carbon balancing becomes necessary to still reach the 1.5 ◦ C target, the additional NE demand forces plantations into areas of 8
Ideal
PyCCS PyCCS + BC land gain PyCCS PyCCS + BC land gain 133 560 1728 (291) 317 879 1838 (401) 560 1327 1951 (514)
25 366 1646 (209) 170 626 1752 (315) 366 965 1863 (426)
114 463 1623 (186) 267 714 1715 (278) 463 1029 1810 (373)
13 292 1547 (110) 134 495 1636 (199) 292 754 1728 (291)
conservational interest in nearly every scenario considering basic PyCCS (figures 1, 3). Naturally, the strongest effects are simulated for the NE demand composed of 300 GtC from the mitigation scenario and another 700 GtC from carbon balancing requirements. This NE target of a total 1000 GtC is projected to require conversions of >3200 Mha—an area more than twice the size of current global cropland (figure 3). However, significantly smaller areas may have to be converted when the bio-oil carbon produced during
Environ. Res. Lett. 13 (2018) 044036
pyrolysis is additionally sequestered (advanced PyCCS, figure 3). For mitigation strategies, the inclusion of bio-oil storage results in less than half the plantation area compared to the basic method (table 2). Also, in scenarios including carbon balancing, substantial reductions in land requirements (30%–60%) appear possible if the advanced PyCCS technology and geological storages are used. Regarding the lower balancing level (200 GtC), this technological pathway completely spares land of conservation interest (figure 1). For example, in the scenario adding 200 GtC balancing on top of 200 GtC NE from the mitigation scenario, improving sequestration efficiencies with the advanced pyrolysis technology is simulated to spare ∼240 Mha in areas of conservation interest from conversion, i.e. 30% of the total technologically induced reduction of 797 Mha (difference between land requirements for basic and advanced PyCCS, table 2). However, the higher balancing requirement of 700 GtC would necessitate the advancement of plantations into those vulnerable regions in every scenario (figure 3), while reductions that can potentially be accomplished by the transition from basic to advanced PyCCS technology could still amount to >1/3 of total land (table 2). Further reductions of land requirements might be possible with the proposed future technological pathway of ideal PyCCS based on optimal economic conditions (figure 3). In the mitigation scenarios without carbon balancing, additional CO2 CCS from permanent-pyrogas combustion leads to another 6%– 7% of land resources that can be spared from conversion to biomass plantations due to the higher sequestration efficiency (table 2). For an additional balancing of 200 GtC, this effect may result in another 7%–16% reduction of the land demand, whereas in balancing scenarios of 700 GtC, it shows reductions of only another 4%. In addition to benefits from technological amendments, reductions of land requirements can potentially be accomplished through biochar-mediated yield increases, here simulated to be 75–360 Mha, depending on NE target and technology. While the assumed 25% yield increase in the (sub)tropics is calculated to release 185 Mha land for potential biomass plantations, the associated NE varies with the applied technology (basic PyCCS, 49 GtC NE; advanced PyCCS including oil storage, additional 29 GtC; ideal technology, an additional 8 GtC). Yet, the higher the demand for biomass is (i.e. in case of low sequestration efficiencies and high NE targets), the lower is the simulated relative benefit from such yield increases. In mitigation-only scenarios, ∼50% of land can be spared due to gains induced by biochar application (mean over mitigation and technology scenarios; range 22%–88%). With the ideal PyCCS pathway, the combination of optimum technological conditions and benefits from biochar-mediated yield increases even suggests that the 100 GtC NE target might be reached 9
Figure 4. Divergence [%] of the land requirements for alternative nature conservation from the original results per NE target.
with only a minor land conversion of 13 Mha. In contrast, the yield-stimulating effect can compensate only 24% (6%–37%) of the land expansion in scenarios with an additional carbon balancing of 200 GtC and only 5% in case of 700 GtC carbon balancing. Our estimations of the (minimum) land use change required for supplying specific NE targets depend on the assumption about land available for conversion, here considering protection of vulnerable areas as determined by five different spatial datasets (S2). To test for the sensitivity of our results regarding these assumptions, we developed an alternative setting that excludes the areas of high extinction risk (Pimm et al 2014) from the priorization scheme (2.5). An effect on our simulated plantation areas occurs in both negative and positive directions (table 3, figure 4). Since cells outside the areas of conservational interest are assumed to be converted first and the alternative setting provides additional highly productive cells for this category, 3%–23% less land is needed for supplying relatively low NE demands (100–500 GtC). In contrast, higher NE targets require more land (+2%– 11%), because it also releases less productive land for the initial conversion, which is assumed to be utilized before allocating more productive cells within the areas of conservational interest.
4. Discussion In this study, the quantitative potential of biomass pyrolysis CCS as a NE technology based on dedicated biomass plantations is evaluated for the first time at a global scale. We found that meeting the target of restricting mean global warming to 1.5 ◦ C through NE based on PyCCS would require conversion of extensive areas, critically endangering biosphere integrity. This pressure may either be significantly reduced by the technological development towards bio-oil storage and systematic application of biochar
Environ. Res. Lett. 13 (2018) 044036
Table 3. Area [Mha] of biomass plantations on uncultivated land (mean over 19 climate scenarios) required per negative emission target for each technological pathway (PyCCS) in the altered setting of the nature conservation scheme excluding the areas of high extinction threat. Primary mitigation targets are given in bold with carbon balancing options below. The columns with biochar (BC) land gain are italicised and consider biomass production on 20% of tropical and subtropical cropland which is gained due to biochar-mediated productivity increases. Required conversion of natural vegetation for biomass plantation in an alternative nature conservation setting [Mha] Basic PyCCS Basic PyCCS + Advanced Advanced Ideal PyCCS Ideal PyCCS + BC land gain BC land gain PyCCS PyCCS + BC land gain Mitigation 100 GtC + 200 GtC balancing (300 GtC) + 700 GtC balancing (800 GtC) Mitigation 200 GtC + 200 GtC balancing (400 GtC) + 700 GtC balancing (900 GtC) Mitigation 300 GtC + 200 GtC balancing (500 GtC) + 700 GtC balancing (1000 GtC)
245 1205 2758 626 1830 3040 1205 2034 3363
112 896 2630 424 1673 2902 896 1933 3198
to agricultural soils or substantially increased, if balancing of ongoing emissions should become a necessity in the absence of stringent decarbonization. Meeting such extra sequestration demands through PyCCS is expected to violate even the minimum level of biodiversity protection assumed here. Should an additional NE demand of 700 GtC be necessary (on top of 100–300 GtC mitigation demand)—which is the case when decarbonization measures fail to a degree that would lead to RCP4.5 emission levels—biomass plantations might reach an extent that would double or triple the land under cultivation. Analysing such a carbon balancing option is particularly policy-relevant, as the RCP4.5 trajectory is similar to the current ‘Intended Nationally Determined Contributions’ (INDCs) to the Paris Agreement (UNFCCC 2016). While today’s land use change is already considered an increasing risk to Earth system functioning, doubling or even tripling the extent of cultivated land would strongly accelerate this threat (Ostberg et al 2015, Steffen et al 2015). The alternative setting of nature conservation shows that moderate shifts in the calculated land requirements may occur due to changed assumptions about land availability. However, trade-offs with environmental targets or food security must be taken into account, as in our example reduced land requirements versus high extinction threats. As we evaluate the benefits from technological developments and higher sequestration efficiencies to be substantial, these amendments have to be adopted as soon as possible to constrain the increasing pressure on the global biosphere. In contrast to BECCS, for which the technology is currently not mature enough to cope with global NE demands (Vaughan and Gough 2016), the basic PyCCS method can be implemented immediately (Woolf et al 2016) and the advanced PyCCS method relatively soon after (table 1). Nevertheless, the inclusion of bio-oil CCS would be an enormous political challenge, as for geological storages, global consent and new economic models to pay for sequestered carbon become necessary.
10
122 469 1890 278 711 1994 469 1016 2103
24 318 1814 154 519 1914 318 775 2019
106 395 1796 238 586 1880 395 823 1970
13 259 1540 123 420 1807 259 617 1893
The additional benefit from applying biochar to increase soil fertility (Jeffery et al 2017) is already achievable with the current state of technology and is thus more likely to be established soon than the geological storage pathways. Accounting for this, NE demands below 100 GtC could even be provided through plantation-based PyCCS at a minimum rate of further land use change. Moreover, yield increases—and, thus, NE potentials on already cultivated land—might even be somewhat higher than estimated by Jeffery et al (2017), since further progress will be made based on observed positive effects of biochar use (Vaccari et al 2011, Jones et al 2012, Genesio et al 2015) or improved biochar post-treatment and mechanistic understanding (Kammann et al 2015, Hagemann et al 2017). The same applies for (nutrient enhanced) biochar use in the tropics where increases far above 25% have been reported (Jeffery et al 2017, Schmidt et al 2017). Furthermore, new agricultural practices, such as biochar application to the root zone or organic biochar based fertilization, may lead to further significant increases in crop productivity (Schmidt et al 2017). The crop yield increase is, however, not the only benefit of biochar. Its production and application implies other substantial co-benefits not studied here (see table 1). For example, the biochar-mediated improvement of nutrient and water holding capacities of arable soils does not only cause higher yields, but also influences management intensities, regarding freshwater consumption and fertilization (Basso et al 2013, Joseph et al 2013). Moreover, it likely reduces the extent of crop failure with extreme weather events accompanying global warming by creating more resilient soils. Furthermore, biochar-enriched soils do not only actively mitigate climate change through CDR, but also through the reduction of agricultural non-CO2 greenhouse gas emissions (Kammann et al 2017) such as N2 O (Van Zwieten et al 2015) or CH4 emissions from flooded agricultural soils (Jeffery et al 2016). As recent studies show that rising CH4 emissions have
Environ. Res. Lett. 13 (2018) 044036
been underestimated (Wolf et al 2017, Davidson et al 2018), mitigating these emissions will be an even greater challenge than initially thought. Accounting for the potential contribution of PyCCS in this regard would significantly increase its overall potential as a comprehensive climate change mitigation strategy. In addition to these biogeochemical improvements, PyCCS involves social advantages over other biomass-based NETs (Fuss et al 2014), as they do not necessarily need to be implemented as a largescale industry solution. A large number of test sites are e.g. already today efficient at small scales and are run by small landholders (Schmidt et al 2017); thus PyCCS allows implementation and associated income gain at small-scale or even subsistence farming level (Solomon et al 2016). Furthermore, particularly the advanced PyCCS approach offers economic incentives by material-use pathways (table 1), ranging from building and composite materials (Gupta and Kua 2017), road construction (Raman et al 2015), chemical industry (Crombie and Ma˘sek 2014) to electronics (Gu et al 2015). Every material-use pathway will serve carbon sequestration, as long as the products are not burnt or otherwise decomposed. Yet, biomass pyrolysis may even provide improvements in other fields of climate change mitigation, as biochar has a high potential to replace expensive and non-renewable conventional catalysts for the production of biofuels (Lee et al 2017). In this study, we assessed the NE potential of PyCCS, though an evaluation of the overall climate impact would require additional analysis of shifts in energy and water fluxes due to land conversion or biochar application on cropland. Immediate effects on the regional hydrological cycle can be induced by shifts in evapotranspiration caused by changes in vegetation structure or water holding capacities (Heck et al 2016, Wang et al 2017). Furthermore, changes in albedo could be caused by darkening the soil due to biochar application (Meyer et al 2012, Verheijen et al 2013) or by land cover modifications influencing the shortwave radiative forcing and thus the energy budget (Pielke et al 2002, Boysen et al 2017). Further impacts on Earth system functioning may occur due to a large-scale implementation of biomass plantations, but could not be considered quantitatively here. Severe disturbances of the natural water cycle (beyond evaporative losses) could occur if biomass plantations were irrigated. While plantations are simulated to be rainfed in our setup, significant further yield increases can be achieved on otherwise water-limited areas, if biomass plantations were irrigated. However, overall benefits of irrigation are questionable if water availability for other purposes is compromised (Hejazi et al 2015). Moreover, Heck et al (2018) indicated that supplying a NE target (3.75 GtC yr−1 ) comparable to our 300 GtC NE mitigation target with BECCS of 90% conversion efficiency would lead to further transgression of the 11
planetary boundaries for land-system change, biosphere integrity, and biogeochemical flows alike— indicating possible limitations or environmental side-effects of PyCCS not studied here. Despite these limitations, our analysis provides the first evaluation of global potentials of plantationbased PyCCS as a NET, also estimating the required land use change while observing biodiversity protection guardrails. Compared to the approach by Woolf et al (2010) using residues and plantations on abandoned land and producing ∼35 GtC net NE, the plantation-based approach modelled in this study is more compatible with other biomass-based NETs. While Matovic (2011) assumes 10% of the global NPP as biomass input for the pyrolysis, we dynamically model the biomass potentials in the process-detailed LPJmL model. His more simplistic approach for the biomass input results in a global NE potential of 4.8 GtC yr−1 including fossil fuel offsets, thus falling between the potentials we calculate for the basic and advanced technological track while respecting areas of conservational interest (3.5 and 6.5 GtC yr−1 , respectively).
5. Conclusion This study systematically assessed the potential of PyCCS within different NE pathways consistent with a mean global warming limited to 1.5 ◦ C, as targeted by the Paris Agreement. We demonstrate that only low NE demands as part of a mitigation portfolio of stringent emission reductions are able to fulfil that goal with relatively low additional pressure on the biosphere. The PyCCS approach offers opportunities to substantially reduce impacts by increasing sequestration efficiencies through additional bio-oil storage and the possible gain in land induced by biocharmediated yield increases. However, should additional carbon balancing become a necessity in the absence of effective and rapid mitigation measures, major land areas including regions of high conservational interest would have to be converted with earth systemic side-effects that could only partially be buffered by technically advanced PyCCS systems and agricultural co-benefits of biochar. Thus our results reinforce the need for prompt and consequent decarbonization actions.
Acknowledgments This study was conducted within the BMBF-funded project BioCAP-CCS, grant no. 01LS1620B and 01LS1620A. The publication of this article was partially funded by the Open Access Fund of the Leibniz Association. We thank Vera Heck and Fabian Stenzel for valuable discussions, comments, and technical support. We gratefully acknowledge Sibyll Schaphoff for her constant improvements of the model.
Environ. Res. Lett. 13 (2018) 044036
ORCID iDs C Werner
https://orcid.org/0000-0003-1511-3086
References Basso A S, Miguez F E, Laird D A, Horton R and Westgate M 2013 Assessing potential of biochar for increasing water-holding capacity of sandy soils GCB Bioenerg. 5 132–43 Benipal N et al 2016 Direct fast pyrolysis bio-oil fuel cell Fuel 185 85–93 Beringer T I M, Lucht W and Schaphoff S 2011 Bioenergy production potential of global biomass plantations under environmental and agricultural constraints GCB Bioenerg. 3 299–312 Bondeau A et al 2007 Modelling the role of agriculture for the 20th century global terrestrial carbon balance Glob. Change Biol. 13 679–706 Boysen L R, Lucht W and Gerten D 2017 Trade-offs for food production, nature conservation and climate limit the terrestrial carbon dioxide removal potential Glob. Change Biol. 23 4303–17 Buss W, Graham M C, Shepherd J G and Ma˘sek O 2016 Risks and benefits of marginal biomass-derived biochars for plant growth Sci. Total Environ. 569 496–506 Burns W and Nicholson S 2017 Bioenergy and carbon capture with storage (BECCS): the prospects and challenges of an emerging climate policy response J. Environ. Stud. Sci. 7 527–34 Cai X M, Zhang X A and Wang D B 2011 Land availability for biofuel production Environ. Sci. Technol. 45 334–9 Camps-Arbestain M, Amonette J E, Singh B, Wang T and Schmidt H P 2015 A biochar classification system and associated test methods Biochar for Environmental Management: Science, Technology and Implementation ed J Lehmann and S Joseph (Abingdon: Routledge) Crombie K and Ma˘sek O 2014 Investigating the potential for a self-sustaining slow pyrolysis system under varying operating conditions Bioresour. Technol. 162 148–56 Davidson T A, Audet J, Jeppesen E, Landkildehus F, Lauridsen T L, Sondergaard M and Syvaranta J 2018 Synergy between nutrients and warming enhances methane ebullition from experimental lakes Nat. Clim. Change 8 156–60 Domene X, Enders A, Hanley K and Lehmann J 2015 Ecotoxicological characterization of biochars: Role of feedstock and pyrolysis temperature Sci. Total Environ. 512–513 552–61 Fagern¨as L, Kuoppala E and Simell P 2012 Polycyclic aromatic hydrocarbons in birch wood slow pyrolysis products Energy Fuels 26 6960–70 FAO 2017 FAOSTAT—Production (Food and Agriculture Organization of the United Nations (www.fao.org/ faostat/en/#data/QC) (Accessed: 28 July 2017) FAO, IIASA, ISRIC, ISSCAS and JRC 2012 Harmonized World Soil Database (version 1.2) (Rome and IIASA, Laxenburg: FAO) Fermoso J, Pizarro P, Coronado J M and Serrano D P 2017 Advanced biofuels production by upgrading of pyrolysis bio-oil Wiley Interdiscip. Rev. Energy Environ. 6 e245 Frieler K et al 2017 Assessing the impacts of 1.5 ◦ C global warming—simulation protocol of the Inter-Sectoral Impact Model Intercomparison Project (ISIMIP2b) Geosci. Model Dev. 10 4321–45 Fuss S et al 2014 Betting on negative emissions Nat. Clim. Change 4 850–3 Genesio L, Miglietta F, Baronti S and Vaccari F P 2015 Biochar increases vineyard productivity without affecting grape quality: results from a four years field experiment in Tuscany Agric. Ecosyst. Environ. 201 20–5 Georgescu M, Lobell D B and Field C B 2011 Direct climate effects of perennial bioenergy crops in the United States Proc. Natl Acad. Sci. USA 108 4307–12
12
Gu X, Wang Y, Lai C, Qiu J, Li S, Hou Y, Martens W, Mahmood N and Zhang S 2015 Microporous bamboo biochar for lithium-sulfur batteries Nano Res. 8 129–39 Guest G, Bright R M, Cherubini F and Strømman A H 2013 Consistent quantification of climate impacts due to biogenic carbon storage across a range of bio-product systems Environ. Impact Assess. Rev. 43 21–30 Gupta S and Kua H W 2017 Factors determining the potential of biochar as a carbon capturing and sequestering construction material: critical review J. Mater. Civil Eng. 29 04017086 Hagemann N et al 2017 Organic coating on biochar explains its nutrient retention and stimulation of soil fertility Nat. Commun. 8 1089 Harvey O R et al 2012 Geochemical implications of gas leakage associated with geologic CO2 storage—a qualitative review Environ. Sci. Technol. 47 23–36 Hastings A, Clifton-Brown J, Wattenbach M, Mitchell C P, Stampfl P and Smith P 2009 Future energy potential of Miscanthus in Europe GCB Bioenerg. 1 180–96 Heck V, Gerten D, Lucht W and Boysen L R 2016 Is extensive terrestrial carbon dioxide removal a ‘green’ form of geoengineering? A global modelling study Glob. Planet. Change 137 123–30 Heck V, Gerten D, Lucht W and Popp A 2018 Biomass-based negative emissions difficult to reconcile with planetary boundaries Nat. Clim. Change 8 151–5 Heinke J, Ostberg S, Schaphoff S, Frieler K, M¨uller C, Gerten D, Meinshausen M and Lucht W 2013 A new climate dataset for systematic assessments of climate change impacts as a function of global warming Geosci. Model Dev. 6 1689–703 Hejazi M I et al 2015 21st century United States emissions mitigation could increase water stress more than the climate change it is mitigating Proc. Natl Acad. Sci. 112 10635–40 Humpen¨oder F et al 2014 Investigating afforestation and bioenergy CCS as climate change mitigation strategies Environ. Res. Lett. 9 064029 IPCC 2005 IPCC special report on carbon dioxide capture and storage IPCC 2013 Climate Change 2013: The Physical Science Basis Contribution of Working Group I to the Fifth Assessment Report of the Intergovernmental Panel on Climate Change (Cambridge: Cambridge University Press) IUCN&UNEP-WCMC 2015 The World Database on Protected Areas (WDPA) (www.protectedplanet.net/) (Accessed: 20 October 2015) J¨agermeyr J, Gerten D, Heinke J, Schaphoff S, Kummu M and Lucht W 2015 Water savings potentials of irrigation systems: global simulation of processes and linkages Hydrol. Earth Syst. Sci. 19 3073–91 Jeffery S, Abalos D, Prodana M, Bastos A C, Groenigen J W v, Hungate B and Verheijen F 2017 Biochar boosts tropical but not temperate crop yields Environ. Res. Lett. 12 053001 Jeffery S, Verheijen F G A, Kammann C and Abalos D 2016 Biochar effects on methane emissions from soils: a meta-analysis Soil Biol. Biochem. 101 251–8 Jones D L, Rousk J, Edwards-Jones G, DeLuca T H and Murphy D V 2012 Biochar-mediated changes in soil quality and plant growth in a three year field trial Soil Biol. Biochem. 45 113–24 Joseph S et al 2013 Shifting paradigms: development of high-efficiency biochar fertilizers based on nano-structures and soluble components Carbon Manage. 4 323–43 Kammann C et al 2017 Biochar as a tool to reduce the agricultural greenhouse-gas burden-knowns, unknowns and future research needs J. Environ. Eng. Land. Manage. 25 114–39 Kammann C I, Schmidt H-P, Messerschmidt N, Linsel S, Steffens D, M¨uller C, Koyro H-W, Conte P and Joseph S 2015 Plant growth improvement mediated by nitrate capture in co-composted biochar Sci. Rep. 5 11080 Kaplan J O 2007 A composite map of global wetland distribution at 0.5 degree resolution (http://arve.epfl.ch/pub/wetlands/ index.html) (Accessed: 14 September 2017) Kemper J 2015 Biomass and carbon dioxide capture and storage: a review Int. J. Greenh. Gas Control 40 401–30
Environ. Res. Lett. 13 (2018) 044036
Kersten S and Garcia-Perez M 2013 Recent developments in fast pyrolysis of ligno-cellulosic materials Curr. Opin. Biotechnol. 24 414–20 Kier G, Kreft H, Lee T M, Jetz W, Ibisch P L, Nowicki C, Mutke J and Barthlott W 2009 A global assessment of endemism and species richness across island and mainland regions Proc. Natl Acad. Sci. 106 9322–7 Klein Goldewijk K, Beusen A, Doelman J and Stehfest E 2017 Anthropogenic land use estimates for the Holocene—HYDE 3.2 Earth Syst. Sci. Data 9 927–5 Lee J, Kim K-H and Kwon E E 2017 Biochar as a Catalyst Renew. Sustain. Energy Rev. 77 70–9 Lehmann J, Abiven S, Kleber M, Pan G, Singh B P, Sohi S P, Zimmerman A R, Lehmann J and Joseph S 2015 Persistence of biochar in soil Biochar for Environmental Management: Science, Technology and Implementation ed J Lehmann and S Joseph (Abingdon: Routledge) pp 235–299 Lehmann J and Joseph S 2015 Biochar for Environmental Management: Science, Technology and Implementation (Abingdon: Routledge) Liu X, Zhang A, Ji C, Joseph S, Bian R, Li L, Pan G and Paz-Ferreiro J 2013 Biochar’s effect on crop productivity and the dependence on experimental conditions—a meta-analysis of literature data Plant Soil 373 583–94 Louwes A C, Basile L, Yukananto R, Bhagwandas J C, Bramer E A and Brem G 2017 Torrefied biomass as feed for fast pyrolysis: an experimental study and chain analysis Biomass Bioenergy 105 116–26 Luderer G, Pietzcker R C, Bertram C, Kriegler E, Meinshausen M and Edenhofer O 2013 Economic mitigation challenges: how further delay closes the door for achieving climate targets Environ. Res. Lett. 8 034033 Matovic D 2011 Biochar as a viable carbon sequestration option: global and canadian perspective Energy 36 2011–6 Mclaren D 2012 A comparative global assessment of potential negative emissions technologies Process Saf. Environ. Prot. 90 489–500 MEA 2005 Millennium ecosystem assessment Ecosystems and Human Well-being: Wetlands and Water (Washington, DC: World Resources Institute) Meyer S, Bright R M, Fischer D, Schulz H and Glaser B 2012 Albedo impact on the suitability of biochar systems to mitigate global warming Environ. Sci. Tech. 46 12726–34 Mittermeier R A, Turner W R, Larsen F W, Brooks T M and Gascon C 2011 Global biodiversity conservation: the critical role of hotspots Biodiversity Hotspots: Distribution and Protection of Conservation Priority Areas ed F E Zachos and J C Habel (Berlin, Heidelberg: Springer) Neves D, Thunman H, Matos A, Tarelho L and Gomez-Barea A 2011 Characterization and prediction of biomass pyrolysis products Prog. Energy Combust. Sci. 37 611–30 Ostberg S, Schaphoff S, Lucht W and Gerten D 2015 Three centuries of dual pressure from land use and climate change on the biosphere Environ. Res. Lett. 10 044011 Peters J F, Banks S W, Bridgwater A V and Dufour J 2017 A kinetic reaction model for biomass pyrolysis processes in Aspen Plus Appl. Energy 188 595–603 Pielke R A, Marland G, Betts R A, Chase T N, Eastman J L, Niles J O, Niyogi D D S and Running S W 2002 The influence of land-use change and landscape dynamics on the climate system: relevance to climate-change policy beyond the radiative effect of greenhouse gases Phil. Trans. R. Soc. Lond. A-Mat. Phys. Eng. Sci. 360 1705–19 Pimm S L, Jenkins C N, Abell R, Brooks T M, Gittleman J L, Joppa L N, Raven P H, Roberts C M and Sexton J O 2014 The biodiversity of species and their rates of extinction, distribution, and protection Science 344 1246752 Potapov P et al 2017 The last frontiers of wilderness: tracking loss of intact forest landscapes from 2000–2013 Sci. Adv. 3 e1600821 Raman N A A, Hainin M R, Hassan N A and Ani F N 2015 A review on the application of bio-oil as an additive for asphalt J. Tech. 72 105–10
13
Rockstr¨om J, Gaffney O, Rogelj J, Meinshausen M, Nakicenovic N and Schellnhuber H J 2017 Climate policy a roadmap for rapid decarbonization Science 355 1269–71 Rockstr¨om J et al 2016 The world’s biggest gamble Earth Future 4 465–70 Rogelj J, Luderer G, Pietzcker R C, Kriegler E, Schaeffer M, Krey V and Riahi K 2015 Energy system transformations for limiting end-of-century warming to below 1.5 ◦ C Nat. Clim. Change 5 519–27 Rost S, Gerten D, Bondeau A, Lucht W, Rohwer J and Schaphoff S 2008 Agricultural green and blue water consumption and its influence on the global water system Water Resour. Res. 44 W09405 Schemmea S, Samsuna R C, Petersa R and Stoltenab D 2017 Power-to-fuel as a key to sustainable transport systems–an analysis of diesel fuels produced from CO2 and renewable electricity Fuel 205 198–221 Shackley S, Clare A, Joseph S, McCarl B A and Schmidt H-P 2015 BIochar for Environmental Management−Science and Technology 2nd edn ed J Lehmann and S Joseph (Earthscan) pp 813–52 Schaphoff S, Heyder U, Ostberg S, Gerten D, Heinke J and Lucht W 2013 Contribution of permafrost soils to the global carbon budget Environ. Res. Lett. 8 014026 Schaphoff S et al 2018 LPJmL4–a dynamic global vegetation model with managed land: Part I–Model description Geosci. Model Dev. Discuss. in press Schleussner C-F, Rogelj J, Schaeffer M, Lissner T, Licker R, Fischer E M, Knutti R, Levermann A, Frieler K and Hare W 2016 Science and policy characteristics of the Paris Agreement temperature goal Nat. Clim. Change 6 827–35 Schmidt H-P and Shackley S 2016 Biochar in European Soils and Agriculture: Science and Practice ed S Shackley, G Ruysschaert, K Zwart and B Glaser (Abingdon: Routledge) pp 281–89 Schmidt H-P 2012 55 uses of biochar Ithaka J. Ecol. Winegro. Clim. Farm. 29 286–9 Schmidt H-P, Pandit B H, Cornelissen G and Kammann C I 2017 Biochar-based fertilization with liquid nutrient enrichment: 21 field trials covering 13 crop species in Nepal Land Degrad. Dev. 28 2324–42 Sitch S et al 2003 Evaluation of ecosystem dynamics, plant geography and terrestrial carbon cycling in the LPJ dynamic global vegetation model Glob. Change Biol. 9 161–85 Smith P, Davis S J, Creutzig F, Fuss S, Minx J, Gabrielle B, Kato E, Jackson R B, Cowie A and Kriegler E 2016 Biophysical and economic limits to negative CO2 emissions Nat. Clim. Change 6 42–50 Solomon D, Lehmann J, Fraser J A, Leach M, Amanor K, Frausin V, Kristiansen S M, Millimouno D and Fairhead J 2016 Indigenous African soil enrichment as a climate-smart sustainable agriculture alternative Front. Ecol. Environ. 14 71–6 Steffen W et al 2015 Planetary boundaries: guiding human development on a changing planet Science 347 1259855 Tiilikkala K, Fagern¨as L and Tiilikkala J 2010 History and use of wood pyrolysis liquids as biocide and plant protection product pp 111–8 Uludere Aragon N, Wagner N, Wang M, Broadbent M, Parker A M and Georgescu M 2017 Sustainable land management for bioenergy crops Energy Procedia 125 379–88 UNFCCC 2015 Adoption of the Paris Agreement FCCC/CP/2015/L.9/Rev.1 UNFCCC 2016 Aggregate effect of the intended nationally determined contributions: an update. Synthesis report by the secretariat Report No FCCC/CP/2016/2 (Bonn: UNFCCC Secretariat) Vaccari F P, Baronti S, Lugato E, Genesio L, Castaldi S, Fornasier F and Miglietta F 2011 Biochar as a strategy to sequester carbon and increase yield in durum wheat Eur. J. Agron. 34 231–8 Van Zwieten L, Rose T, Herridge D, Kimber S, Rust J, Cowie A and Morris S 2015 Enhanced biological N2 fixation and yield of faba bean (Vicia faba L.) in an acid soil following biochar addition: dissection of causal mechanisms Plant Soil 395 7–20
Environ. Res. Lett. 13 (2018) 044036
Varma A K and Mondal P 2017 Pyrolysis of sugarcane bagasse in semi batch reactor: effects of process parameters on product yields and characterization of products Ind. Crop. Prod. 95 704–17 Vaughan N E and Gough C 2016 Expert assessment concludes negative emissions scenarios may not deliver Environ. Res. Lett. 11 095003 Verheijen F G A, Jeffery S, van der Velde M, Penizek V, Beland M, Bastos A C and Keizer J J 2013 Reductions in soil surface albedo as a function of biochar application rate: implications for global radiative forcing Environ. Res. Lett. 8 044008 V¨or¨osmarty C J, Fekete B M, Hall F G, Collatz G J, Meeson B W, Los S O, Brown de Colstoun E and Landis D R 2011 ISLSCP II River Routing Data (STN-30 p) (Oak Ridge, Tenneessee: ORNL DAAC) Wang M et al 2017 On the long-term hydroclimatic sustainability of perennial bioenergy crop expansion over the United States J. Clim. 30 2535–57
14
Weng Z H et al 2017 Biochar built soil carbon over a decade by stabilizing rhizodeposits Nat. Clim. Change 7 371–6 Wolf J, Asrar G R and West T O 2017 Revised methane emissions factors and spatially distributed annual carbon fluxes for global livestock Carbon Balance Manage. 12 16 Woolf D, Amonette J E, Street-Perrott F A, Lehmann J and Joseph S 2010 Sustainable biochar to mitigate global climate change Nat. Commun. 1 56 Woolf D, Lehmann J and Lee D R 2016 Optimal bioenergy power generation for climate change mitigation with or without carbon sequestration Nat. Commun. 7 13160 Zhang Q, Chang J, Wang T J and Xu Y 2007 Review of biomass pyrolysis oil properties and upgrading research Energy Convers. Manage. 48 87–92 Zimmerman A R, Gao B and Ahn M-Y 2011 Positive and negative carbon mineralization priming effects among a variety of biochar-amended soils Soil Biol. Biochem. 43 1169–79