BIOINFORMATICS APPLICATIONS NOTE Systems biology
Vol. 27 no. 3 2011, pages 433–434 doi:10.1093/bioinformatics/btq679
Advance Access publication December 9, 2010
SurreyFBA: a command line tool and graphics user interface for constraint-based modeling of genome-scale metabolic reaction networks Albert Gevorgyan, Michael E. Bushell, Claudio Avignone-Rossa and Andrzej M. Kierzek∗ Faculty of Health and Medical Sciences, University of Surrey, Guildford, Surrey GU2 7XH, UK Associate Editor: Olga Troyanskaya
Received on August 3, 2010; revised on December 2, 2010; accepted on December 3, 2010
1
INTRODUCTION
An understanding of how cellular phenotypes emerge from interactions between molecular parts, encoded in the genome, requires computer simulation of genome-scale molecular interaction networks. Due to the scarcity of quantitative information, these simulations have been limited to the special case of metabolic networks operating under quasi-steady state, which is modeled by a set of linear relationships between reaction fluxes. The model is explored by employing Linear Programming optimization, where the optimal flux toward any reaction or substance in the model can be determined. This approach is referred to as constraint based (Price et al., 2004), because it evaluates metabolic capabilities under the set of constraints representing stoichiometry, maximal capacity and reversibility of the reactions. This information can be obtained for a particular repertoire of enzymatic activities, predicted from ∗ To
whom correspondence should be addressed.
the genome, which has permitted reconstruction of genome-scale metabolic reaction networks (GSMNs) for major model organisms, pathogens, industrial microorganisms and humans. The review of the numerous applications of GSMNs is beyond the scope of this article. The software presented here stemmed from our work on metabolic engineering (Khannapho et al., 2008) and prediction of gene essentiality in pathogens (Beste et al., 2007). Constraint-based simulations are implemented in the COBRA toolbox (Alexandrescu et al., 2007) running under the Matlab environment. The SimPheny software (www.genomatica.com) is a commercial solution with a database backend providing visualization of numerical results on pathway maps. Visualization is also available in the FBA-SimViz (Grafahrend-Belau et al., 2009) and MetaFluxNet (Lee et al., 2003) programs, although none of them implements iterative simulations such as flux variability analysis (FVA) or reaction essentiality scans. Here we present SurreyFBA, a GNU GPL software for constraintbased simulations of metabolic reaction networks. In addition to the standard methods, available in existing tools, it implements analysis of minimal substrate and product sets. The command line tool is available as a binary and source code for Linux, Windows and MacOS systems and can be used without dependencies on mathematical modeling environments. It can be easily run using common scripting languages, which makes it particularly suitable for the integration with bioinformatics analysis pipelines. We have already implemented JyMet, a Jython graphics user interface, which provides visualization of networks and numerical results, integrated into network diagrams.
2
SOFTWARE
The SurreyFBA is a metabolic modeling interface to the Gnu Linear Programming Kit (www.gnu.org/software/glpk/glpk.html), distributed within the software. The calculations involving linear programming (LP) are implemented in C++ as an object-oriented LP kernel, which is initialized once and used repeatedly in iterative algorithms, while the objective function and the linear constraints are modified. This increases performance in applications such as FVA and essentiality scans involving thousands of LP solutions. An additional gain in performance can be achieved by applying the optional matrix reduction algorithm (M.G. Poolman, unpublished). For example, SurreyFBA is 41% faster than COBRA toolbox on FVA of Saccharomyces cerevisiae iND750 model. In the current distribution, we also provide JyMet—a desktop graphics user interface written in Jython. JyMet presents model structure in a
© The Author 2010. Published by Oxford University Press. All rights reserved. For Permissions, please email:
[email protected]
[13:41 5/1/2011 Bioinformatics-btq679.tex]
Downloaded from http://bioinformatics.oxfordjournals.org/ by guest on May 18, 2013
ABSTRACT Summary: Constraint-based modeling of genome-scale metabolic networks has been successfully used in numerous applications such as prediction of gene essentiality and metabolic engineering. We present SurreyFBA, which provides constraint-based simulations and network map visualization in a free, stand-alone software. In addition to basic simulation protocols, the tool also implements the analysis of minimal substrate and product sets, which is useful for metabolic engineering and prediction of nutritional requirements in complex in vivo environments, but not available in other commonly used programs. The SurreyFBA is based on a command line interface to the GLPK solver distributed as binary and source code for the three major operating systems. The command line tool, implemented in C++, is easily executed within scripting languages used in the bioinformatics community and provides efficient implementation of tasks requiring iterative calls to the linear programming solver. SurreyFBA includes JyMet, a graphics user interface allowing spreadsheet-based model presentation, visualization of numerical results on metabolic networks represented in the Petri net convention, as well as in charts and plots. Availability: SurreyFBA is distributed under GNU GPL license and available from http://sysbio3.fhms.surrey.ac.uk/SurreyFBA.zip. Contact:
[email protected]
433
Page: 433
433–434
A.Gevorgyan et al.
user friendly spreadsheet and provides a menu-based interface to simulation methods (Fig. 1). A model can be provided either in a tab-delimited format defining reactions only or in a more extended four-level format describing also genes, enzymes and metabolites. JyMet can also import SBML files that conform to the conventions accepted by the COBRA Toolbox. A separate text file may be provided with one or more problem definitions in a simple scripting format, including objective functions, redefined flux bounds, method-specific arguments and additional linear constraints. The results are written in a tabular format. SurreyFBA implements established metabolic modeling methods, such as flux balance analysis, flux variability analysis, robustness analysis, phenotypical phase planes (Price et al., 2004), elementary mode analysis (Heinrich and Schuster, 1996), essentiality scans and prediction of reaction and gene/enzyme knockout results (involving the evaluation of logical rules relating reactions to genes or enzymes). It also provides some structural methods for model validation, such as detection of live reactions, orphan metabolites (Poolman et al., 2006), unconserved metabolites (Gevorgyan et al., 2008) and connected components. Original methods are provided for the calculation of minimal substrate and product sets (Gevorgyan, 2009), enabling quick and concise characterization of nutritional requirements and metabolic capabilities of the organisms investigated. A model or results can be visualized in JyMet on network maps using Petri net convention, with automatically generated and manually editable layouts. Dedicated functions are also provided for showing simulation results in charts and plots.
3
CONCLUSIONS
The free SurreyFBA software provides a command line tool efficiently implementing a large number of constraint-based
modeling approaches, including methods that are not available in other tools. It is an ideal choice for users integrating constraintbased simulations with bioinformatics pipelines, and also provides a user-friendly graphical interface independent on commercial mathematical modeling environments.
ACKNOWLEDGEMENTS We are grateful to Ahmad Mannan for performing COBRA toolbox simulations. Funding: BBSRC projects (BB/H004262/1 and BB/D011582/1). Conflict of Interest: none declared.
REFERENCES Alexandrescu,A. et al. (2007) Quantitative prediction of cellular metabolism with constraint-based models: the COBRA Toolbox. Nat. Protoc., 2, 727–738. Beste,D.J.V. et al. (2007) GSMN-TB: a web-based genome scale network model of Mycobacterium tuberculosis metabolism. Genome Biol., 8, r89. Gevorgyan,A. (2009) Theoretical and computational methods for studying genomescale metabolic networks applied to Streptococcus agalactiae. PhD. Thesis, Oxford Brookes University. Gevorgyan,A. et al. (2008) Detection of stoichiometric inconsistencies in biomolecular models. Bioinformatics 24, 2245–2251. Grafahrend-Belau,E. et al. (2009) FBA-SimVis: interactive visualization of constraintbased metabolic models. Bioinformatics, 25, 2755–2757. Heinrich,R. and Schuster,S. (1996) The regulation of cellular systems. Chapman & Hall, London. Khannapho,C. et al. (2008) Selection of objective function in genome scale flux balance analysis for process feed development in antibiotic production. Metab. Eng., 10, 227–233. Lee,D.Y. et al. (2003) MetaFluxNet: the management of metabolic reaction information and quantitative metabolic flux analysis. Bioinformatics, 19, 2144–2146. Price,N.D. et al. (2004) Genome-scale models of microbial cells: evaluating the consequences of constraints. Nat. Rev. Microbiol., 2, 886–897. Poolman,M.G. et al. (2006) Challenges to be faced in the reconstruction of metabolic networks from public databases. IEE Proc. Syst. Biol., 153, 379–384.
Downloaded from http://bioinformatics.oxfordjournals.org/ by guest on May 18, 2013
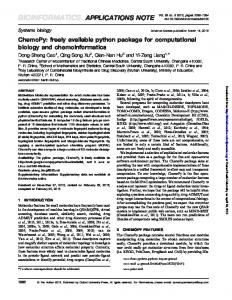
Fig. 1. Usage of SurreyFBA illustrated by screenshots of the command line tool and JyMet GUI. The S.cerevisiae iND750 model available in sample directory is used as an example. The model in spreadsheet interface, visualization of the results on pathway map and the plot of FVA results are shown. The bottom panel shows example command line evaluating biomass objective function.
434
[13:41 5/1/2011 Bioinformatics-btq679.tex]
Page: 434
433–434