BioComputing/BioInformatics>>>>> Short Technical Report Processing of Gene Expression Data Generated by Quantitative Real-Time RT-PCR BioTechniques 32:__-__ (June 2002)
Patrick Y. Muller1, Harald Janovjak2, André R. Miserez1, and Zuzana Dobbie3 1Research Group Cardiovascular Genetics, Institute of Biochemistry and Genetics, University of Basel, Switzerland, 2MaxPlanck-Institute of Molecular Cell Biology and Genetics, Dresden, Germany, and 3Research Group Human Genetics, Division of Medical Genetics, University of Basel, Switzerland ABSTRACT Real-time quantitative PCR represents a highly sensitive and powerful technique for the quantitation of nucleic acids. It has a tremendous potential for the high-throughput analysis of gene expression in research and routine diagnostics. However, the major hurdle is not the practical performance of the experiments themselves but rather the efficient evaluation and the mathematical and statistical analysis of the enormous amount of data gained by this technology, as these functions are not included in the software provided by the manufacturers of the detection systems. In this work, we focus on the mathematical evaluation and analysis of the data generated by real-time quantitative PCR, the calculation of the final results, the propagation of experimental variation of the measured values to the final results, and the statistical analysis. We developed a Microsoft® Excel®-based software application coded in Visual Basic for Applications, called Q-Gene, which addresses these points. Q-Gene manages and expedites the planning, performance, and evaluation of real-time quantitative PCR experiments, as 2 BioTechniques
well as the mathematical and statistical analysis, storage, and graphical presentation of the data. The Q-Gene software application is a tool to cope with complex realtime quantitative PCR experiments at a high-throughput scale and considerably expedites and rationalizes the experimental setup, data analysis, and data management while ensuring highest reproducibility.
INTRODUCTION One of the best characteristics for the functional status of a certain cell is its gene expression pattern. Cells belonging to different tissues, cells in different developmental or metabolic stages, cells under the influence of specific compounds, or cells within a carcinogenic process differ by their gene expression patterns and thus by their mRNA pools. Currently, the most important technique for the accurate quantitation of gene expression is the fluorescent quantitative real-time RT-PCR (8). Various variants of this technique are currently applied. The fluorescence signal is either generated by dyes intercalating into dsDNA [e.g., SYBR® Green (13)] or by hybridization probes [TaqMan® (9) or molecular beacons (6)] relying on fluorescence resonance energy transfer (FRET). Within the last few years, quantitative real-time RTPCR has become an important method for the analysis of gene expression in a vast variety of samples (3,5,8). The quantitative real-time RT-PCR technique represents a sensitive and powerful method for the gel-free detection of mRNA with a tremendous potential for quantitative applications. Typically, the expression of the target
gene is analyzed (in different reaction tubes or in the same reaction tube; i.e., multiplex) together with a reference gene to normalize the amount of the PCR template and, thus, to enable the calculation of the relative expression level of the target gene (i.e., normalized gene expression) (12). Instead of using a standard curve, the target gene expression levels are calculated relative to the reference. Therefore, it is critical that the reference is a housekeeping gene [such as glyceraldehyde-triphosphate dehydrogenase (GAPDH), βactin, or an rRNA gene] that is not influenced by the experimental situation. However, it is still a matter of debate whether the expressions of such housekeeping genes are in fact unaffected by a particular experimental setup or not (4,7,16). In parallel, the normalized copy number of any genomic DNA sequence can be determined as well by quantitative real-time RT-PCR. However, in this article, for practical reasons, we focus on quantitative RT-PCR to quantify gene expression. Due to the rapid development of reagents and hardware components, the practical realization of quantitative realtime RT-PCR has become user-friendly and feasible at a high-throughput scale in basic and applied research. However, the major hurdle is neither the isolation of the mRNA nor the RT-PCR itself but rather the coordination of the experiments and the efficient management of the collected data. The main challenge remains the evaluation and the mathematical and statistical analysis of the enormous amount of data gained by this technology, as these functions are not included in the software provided by the manufacturers of the detection systems. Vol. 32, No. 6 (2002)
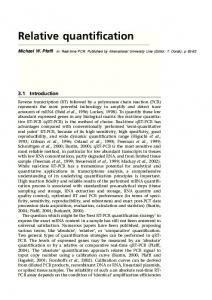
>>>>>>>>>>>>>>>>>>>>>>>>>>> Table 1. Comparison of Two Different Ways to Calculate the Mean Normalized Gene Expression
CT of CT of Normalized Description Target Gene Reference Gene Expression Well #1 Well #2 Well #3 Mean SE SE
in %
24.60 24.50 24.20 24.43 0.12 0.49
17.10 17.20 17.50 17.27 0.12 0.70
435.23a 380.84a 255.15a 357.07b,f 53.32d 14.93
Mean Normalized Expression
348.41c,f 39.56e 11.35
aAccording
to Table 2, Equation 1; baccording to Equation 2; caccording to Equad tion 3; according to Equation 4; eaccording to Equation 6; fThe difference between the calculation procedures according to Table 2, Equations 2 and 3, respectively, amounts to 2.5% for the present example. Etarget was chosen to be 2.0 and Eref to be 1.9, respectively.
Nevertheless, one of the most critical issues for many quantitative PCR applications, reproducibility, cannot be improved by software tools. Two important issues arising during the analysis of the normalized gene expression are the way to calculate (i) the mean value and (ii) the standard error. (i) As nearly all measurements in the course of quantitative real-time RTPCR analyses are performed in replicates, preferably in triplicates, the calculated gene expressions represent mean values. The corresponding mean value(s) of a certain analysis procedure can be calculated by different methods, depending on which step of the calculation procedure the actual mean value is calculated. In this work, different mathematical procedures for the calculation of the mean normalized expression value have been compared and evaluated. (ii) The calculation of standard errors (as a measure for the precision of the assay) is especially important for all results that are calculated on the basis of mean values of series of experimental measurements, as the standard errors of these mean values are propagated to the final results. We derived a formula for the calculation of the standard error of the normalized expression by applying the differential equation of Gauss for the calculation of error propagation and developed a Microsoft® Excel®-based software application that calculates these standard errors. Here we present Q-Gene, a novel and comprehensive software application for the analysis of quantitative Vol. 32, No. 6 (2002)
real-time RT-PCR data, which solves the limitations addressed above and automates the entire evaluation, calculation, and graphical presentation. QGene, provided at no cost from the BioTechniques Software Library at www.BioTechniques.com, has been developed to manage and expedite the entire experimental process of quantitative real-time RT-PCR, including the general planning of the experiments, as well as the mathematical and statistical analysis, storage, and graphical presentation of the data.
MATERIALS AND METHODS Two Different Ways to Calculate the Mean Normalized Gene Expression The normalized gene expression is directly proportional to the amount of RNA of a certain target sequence (i.e., the target gene) relative to the amount of RNA of the reference gene. The normalized expression is calculated according to Equation 1, which is not based on the assumption that the PCR amplification efficiencies of the target gene and the reference gene are equal (12). Based on an example of a triplicate quantitative real-time RT-PCR measurement (well nos. 1–3), two different ways to calculate the mean of the normalized expression were compared (Table 1). The mean of the normalized expression was calculated (i) by averaging three independently calculated normalized expression values of the
triplicate (Table 2, Equation 2) and (ii) by averaging the threshold cycle (CT) values (of the target and of the reference) and subsequent calculation of the mean normalized expression (Table 2, Equation 3). The corresponding standard errors were calculated according to the differential equation of Gauss for the calculation of error propagation (Table 2, Equation 5). Basic Formulae for the Calculation of Error Propagation The standard error is a quantitative value for the precision—not the accuracy—of a series of individual measurements (Table 2, Equation 4) (2,15). The propagation of the standard error in the course of any mathematical procedure involving mean values and their corresponding standard errors is described by the differential equation of Gauss for the calculation of error propagation (Table 2, Equation 5) (2,15). Q-Gene Modules and the Q-Gene Statistics Add-in Q-Gene, consisting of the Q-Gene Core Module, the Q-Gene Database Module, and the Q-Gene Statistics Add-in, is implemented on the basis of Microsoft Excel spreadsheet files and has been programmed in Visual Basic for Applications (VBA) (10,11). Thus, Q-Gene can be run on any system on which Microsoft Excel (version 97 or later for Microsoft Windows® and version 98 or later for Apple® Macintosh®) is installed. Every quantitative real-time RTPCR experiment is managed by a separate copy of the Q-Gene Core Module file (qgene96.xls or qgene384.xls) that is structured into four worksheets. Upon opening the file, an additional custom-made toolbar named “Q-Gene Core Module” appears, enabling the user to run several VBA programs for a variety of data-import procedures. Every worksheet contains cells shaded in blue for data entry (input variables provided by the user) and white cells containing output values calculated by Q-Gene (output variables). Because of the modular assembly of Q-Gene, every worksheet can be used and modified on its own, providing the highest BioTechniques 3
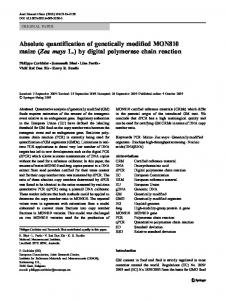
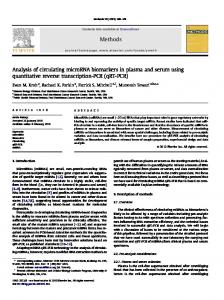
BioComputing/BioInformatics>>>>> Table 2. Equations
Equation 1: Formula for the Calculation of the Normalized Gene Expression
NE, normalized gene expression; Etarget, PCR amplification efficiency of the target gene; Eref, PCR amplification efficiency of the reference gene; CTtarget, threshold cycle of the PCR amplification of the target gene; CTref, threshold cycle of the PCR amplification of the reference gene. The CT is defined as the cycle at which the fluorescence rises appreciably above the background fluorescence. Equation 2: Formula for the Calculation of the Mean Normalized Gene Expression by Averaging Three Normalized Expression Values
MNE, mean normalized expression (by arithmetic mean of three normalized expression values). Equation 3: Formula for the Calculation of the Mean Normalized Gene Expression by Averaging the Three Concomitant CT Values
MNE′, mean normalized expression (by averaging the three concomitant CT values of the target gene and of the reference gene, respectively). Equation 4: Formula for the Calculation of the Standard Error
∆x, standard error; xi, values of the independent measurements; x, mean value of the independent measurements; n, number of independent measurements. Equation 5: Differential Equation of Gauss for the Calculation of Error Propagation
If a result is calculated by the function F consisting of n independent variables, x1...xn, with their standard errors xi ± ∆xi, the standard error of the result (∆F) is calculated according to the differential equation of Gauss. Equation 6: Formula for the Calculation of the Standard Error of the Mean Normalized Gene Expression
{
∆
∆MNE, standard error of mean normalized expression; Etarget, PCR amplification efficiency of the target gene; Eref, PCR amplification efficiency of the reference gene; CTtarget, mean, mean threshold cycle of the PCR amplification of the target gene; CTref, mean, mean threshold cycle of the PCR amplification of the reference gene; ∆CTtarget, mean, standard error of mean threshold cycle of the PCR amplification of the target gene; ∆CTref, mean, standard error of mean threshold cycle of the PCR amplification of the reference gene.
4 BioTechniques
Vol. 32, No. 6 (2002)
>>>>>>>>>>>>>>>>>>>>>>>>>>> flexibility. In addition, the VBA source code of all Q-Gene components can be edited to modify or extend Q-Gene or to develop related VBA applications. The Q-Gene Database Module (qgenedb.xls) represents a central database-like depository for any kind of expression data. The normalized expression values can be directly imported from any Q-Gene Core Module file using an integrated VBA program. The Q-Gene Statistics Add-In (qstats. xla) is a collection of several VBA programs for the rapid and menu-guided performance of frequently used parametric and nonparametric statistical tests (14). To have permanent access to the QGene Statistics Add-In, it is recommended to copy the file to the local hard drive and to activate it as an add-in file (Menu Tools, Add-Ins). All statistical programs can then be launched from a custommade toolbar, named “Q-Gene Statistics Add-In”. To be able to run Q-Gene in Microsoft Excel 2000 and to maintain the macro-virus protection for unknown documents in parallel, it is recommended to activate the “Trust all installed addins and templates” checkbox (Tools/ Macro/Security/Trusted Sources) and to set the “Security Level” to “Medium” (Tools/Macro/Security/Security Level). RESULTS Mean Normalized Gene Expression Table 1 contains the results of all steps of two different ways to calculate the mean normalized gene expression from an example of three repeated quantitative real-time RT-PCR measurements (well nos. 1–3). The calculation was performed on the basis of Table 2, Equation 1, which does not assume that the PCR amplification efficiencies of the target gene and the reference need to be equal (12). The mean of the normalized expression was calculated (i) by averaging three independently calculated normalized expression values of the triplicate (Table 2, Equation 2) and (ii) by averaging the CT values (of the target and of the reference) and subsequent calculation of the mean normalized expression (Table 2, Equation 3). The mean normalized expression values calculated on the basis of the sample values Vol. 32, No. 6 (2002)
in Table 1, according to Table 2, Equations 2 and 3, respectively, led to two different results that differed by 2.5%. Error Propagation Based on the equation of Gauss (Table 2, Equation 5), calculations of error propagations were performed with regard to the data analysis requirements of quantitative real-time RT-PCR experiments. If the mean normalized expression is calculated according to Table 2, Equation 2 (i.e., by averaging three independently calculated normalized expression values), the standard error can be calculated as depicted in Table 2, Equation 4. On the other hand, if the mean normalized expression is calculated according to Table 2, Equation 3 (i.e., by averaging the CT values of the target and of the reference), then the equation of Gauss (Table 2, Equation 5) needs to be applied for the calculation of the standard error. The reason is that the mean CT values used in Table 2, Equation 3, represent mean values and, thus, include a standard error (∆CT), which can be calculated as depicted in Table 2, Equation 4. Nevertheless, the overall standard error of the mean normalized expression (∆MNE) can only be obtained by applying the equation of Gauss. Table 2, Equation 6, shows the overall standard error of the mean normalized expression (calculated according to Table 2, Equation 3) based on the equation of Gauss. Structure, Features, and Characteristics of Q-Gene The Q-Gene Core Module file exists in two versions, one preformatted for 96-well microplates (qgene96.xls) and the other preformatted for 384-well microplates (qgene384.xls). However, due to its flexible structure, it is also possible to apply any other numbers and sizes of wells. The quantitative realtime RT-PCR measurements are intended to be performed in triplicates, which represents the standard operation mode of the Q-Gene Core Module. Nevertheless, it is also possible to use the QGene Core Module for single measurements, as the normalized expressions are calculated independently for each well. In the Core Module, the descrip-
tion of the individual wells, the input variables, and the calculated output variables are in distinct columns. The worksheets of the Core Module are organized in a logical and streamlined fashion, enabling a fast and structured performance of the experiments. In each worksheet, all variables, either asked to be entered by the user (blue cells) or calculated by the software (white cells), are explained by pop-up windows, making Q-Gene easy to use and self-explanatory. In the “Setup” worksheet, it is possible to assign a number or short description to every well of the 96- or 384-well microplate. These numbers or descriptions are then automatically taken over to all other worksheets and charts, as well as to the Q-Gene Database Module, to keep track of the samples. The worksheet “Q-PCR Reaction” enables the calculation of the composition of the PCR mixture. On the basis of the user-defined final and stock concentrations of all reagents and the total volume of the reaction mixture (1), QGene calculates the volumes of all individual reagents to be added to the reaction mixture. The worksheet “Ampl. Efficiency Plot” is used for the generation and evaluation of the amplification efficiency plots of the target gene and the reference gene. These plots yield the amplification efficiencies of the target and the reference (Etarget and Eref), which are both crucial parameters for the calculation of the normalized gene expression. The calculation of the normalized expression in the “Data Analysis” worksheet is supported by any amplification efficiency values that are directly taken over from the worksheet “Ampl. Efficiency Plot”. The evaluation of the raw data and the calculation of the normalized gene expression are performed in the worksheet “Data Analysis”. Here, the CT values of the target gene and of the reference gene either can be entered manually by the user or be imported, guided by four different VBA programs, from data files generated by the software of the detection system. The normalized expression values are represented by a 3-D chart reflecting the outline of a 96- or 384-well microplate. Subsequent calculations performed by BioTechniques 5
BioComputing/BioInformatics>>>>> Q-Gene comprise the mean of the normalized expression values (according to Table 2, Equation 2, or likewise according to Table 2, Equation 3) of the triplicates and their standard errors. These values are represented in a 2-D chart with the corresponding error bars. Furthermore, standard errors of triplicates exceeding a certain percentage, specified by the user, are automatically highlighted in bold red. The Q-Gene Database Module enables the user to perform a variety of (cross-experiment) comparisons of the expression data. The expression values can be directly imported from any QGene Core Module file using an integrated VBA program. The expression values can be compared between two matched groups, namely A and B. These two groups can be interpreted as two different tissues, the absence or presence of an inhibitor or inducer, two timepoints, two concentrations of compounds, etc. In an alternating mode, every first sample of an experiment is automatically assigned to group A and every second sample to group B, respectively. This enables the calculation of ratios A divided by B. In addition, the expression relative to a calibrator (i.e., the expression value of any sample divided by the mean calibrator’s expression value) is automatically calculated for every sample in the database. As a calibrator, any value of choice or the mean of several values can be assigned (guided by a VBA program). Statistical analysis can be performed using the corresponding menu item from the “Q-Gene Statistics Add-In” toolbar. To assess the significance level of difference between any two groups of expression values, it is possible to perform a paired or an unpaired Student’s t test, a Mann-Whitney U-test, or a Wilcoxon signed-rank test (14). In addition, the Pearson’s correlation analysis can be applied between two matched groups of expression values. Furthermore, all statistical programs calculate the mean values of both groups analyzed and their difference in percent. DISCUSSION Quantitative real-time RT-PCR is a sensitive and powerful technique for 6 BioTechniques
the gel-free quantitation of mRNA with minimal demands on the quantity of template material and with a tremendous potential for high-throughput applications. During the past two years, the range of available detection systems for quantitative real-time RT-PCR has increased rapidly. However, the softwares delivered with these systems hardly offer any features for sophisticated automated analysis and calculation of the data generated by quantitative real-time RT-PCR experiments. Furthermore, these softwares usually lack the possibilities of cross-experimental comparison, graphical presentation, and statistical analysis. Although the detailed analysis requirements of quantitative real-time RT-PCR experiments vary depending on the particular application, a thorough evaluation of the raw data is crucial. Analysis of quantitative real-time RT-PCR experiments, particularly if performed at a high-throughput scale, is therefore challenging. Usually, in the case of microplate-based (96 or 384 wells) detection systems [e.g., ABI PRISM® 7900HT (Applied Biosystems, Foster City, CA, USA), iCycler (BioRad Laboratories, Hercules, CA, USA), and Mx4000 (Stratagene, La Jolla, CA, USA)], the individual measurements are performed in triplicates. This procedure is, at least from a practical point of view, recommended and provides high reproducibility. The calculation of the mean normalized gene expression (Table 2, Equations 2 and 3) can be performed in at least two different ways. As shown in Table 1, these calculation procedures do not yield the same results. In the present example, which represents a typical data set, the results differed by 2.5%. Table 2, Equation 3, as compared to Equation 2, yielded the lower mean normalized expression (348.41 vs. 357.07) and a lower standard error in percent (11.35% vs. 14.93%). This example also demonstrates the increase in the standard errors when proceeding from the CTmean to the mean normalized expression (0.49%, 0.70% vs. 14.93% and 11.35%, respectively). The more the CT values of the triplicates scatter, the more the results of the two calculation procedures will differ, with Table 2, Equation 3, always yielding the
lower value. Therefore, it is mandatory to use the same calculation procedure for all experiments if expression data have to be compared across experiments. Furthermore, it needs to be declared which procedure has been applied. In our opinion, the calculation procedure outlined in Table 2, Equation 3, should be preferred for expression analyses, as the mean values are calculated on the basis of the values that are really measured (i.e., the CT values). The Q-Gene Core Module supports both calculation procedures (Table 2, Equations 2 and 3), leaving the final decision of which procedure is to be used up to the user, as the scientific community currently uses both procedures. Typically, the mean normalized gene expression represents a mean value calculated on the basis of triplicate quantitative real-time RT-PCR measurements. Its precision, in terms of the standard error, is crucial for the evaluation of results of gene expression measured by quantitative real-time RT-PCR. Applying the differential equation of Gauss (Table 2, Equation 5), it is possible to determine the standard error of any result calculated on the basis of mean values of series of experimental measurements and their standard errors, as the standard errors are propagated to the final result (2,15). The standard error of the mean normalized expression is represented by error bars in the charts of the Q-Gene Core Module. To identify outliers quickly and conveniently, standard errors exceeding a user-specified percentage are automatically underlined and highlighted in bold red. Furthermore, the Q-Gene Core Module provides the possibility to evaluate an important control experiment needed during optimization of quantitative realtime RT-PCR conditions—the amplification efficiency plot. As many PCRs do not have an ideal 100% amplification efficiency (i.e., E < 2), it is important to assess the exact amplification efficiencies of the target and the reference genes before any calculation of the normalized gene expression. Typically, the relationship between CT and the logarithm of the starting copy number of the target sequence should remain linear up to five orders of magnitude. As the data import procedure for the Q-Gene Core Module is flexibly orgaVol. 32, No. 6 (2002)
>>>>>>>>>>>>>>>>>>>>>>>>>>> nized and explained in detail by four independent VBA programs, the Q-Gene Core Module can be used together with the software of any detection system for quantitative real-time RT-PCR. The raw data (i.e., the individual CT values) can be arranged either in distinct columns or according to the outline of a 96-well or even a 384-well microplate. If any CT values arranged in this format are copied into the clipboard (from any program application), the user needs just to launch the appropriate VBA program from the toolbar to import the data into the Q-Gene Core Module. The Q-Gene Database Module, a central database for the depository of expression data, enables the user to perform a variety of cross-experiment comparisons of any kind of expression data. The data can be directly imported from the Q-Gene Core Module by launching a VBA program. Hence, after the evaluation and analysis of the raw data and the calculation of the expression values, a centralized storage file contains all the expression data generated by numerous individual experiments. The expression values are automatically annotated with the name of the gene they were measured from and with the description of the respective well (imported from the Q-Gene Core Module). The Q-Gene Database Module supports the assignment of any phenotypic data to the expression values, a prerequisite for a possible grouping and/or sorting procedure. These procedures can easily be performed by using the standard commands of Microsoft Excel. The Q-Gene Statistics Add-In enables the user to perform a variety of important statistical tests not included in Microsoft Excel as standard procedures. The user can rapidly perform the most frequently used statistical tests for the comparison of two groups of expression values directly in Microsoft Excel. For all statistical tests, the expression values can be selected with the mouse pointer. To assess the significance level of difference between any two groups of expression values, the QGene Statistics Add-In supports the paired or unpaired Student’s t test, the Mann-Whitney U-test, and the Wilcoxon signed-rank test. In case of small sample sizes that are too small to reliably follow a Gaussian distribution, the Vol. 32, No. 6 (2002)
nonparametric tests of Mann-Whitney and Wilcoxon, which are distributionindependent and thus more conservative, should be preferred (14). To assess whether two genes (e.g., target-genes belonging to the same signaling pathway) are expressed in a coordinate fashion, Pearson’s correlation analysis between two matched groups of expression values can be performed. The Q-Gene software application described here is a tool to manage complex quantitative real-time RT-PCR experiments at a high-throughput scale and is an achievement towards a more sophisticated data analysis environment, as no other generally applicable tools are freely available. Q-Gene considerably expedites and rationalizes the experimental setup, data analysis, and data management while ensuring highest reproducibility. ACKNOWLEDGMENTS The authors would like to express their gratitude to Etienne Studer for his expertise and his helpful advice concerning the implementation of the Visual Basic source code of the program components. This work was supported by the Swiss National Science Foundation grant nos. 3200-049125.96/1, 2 and 3200-063979.00. A.R.M. is supported by the Swiss Clinicians Opting for Research (SCORE) grant no. 3231048896.96 of the Swiss National Science Foundation. REFERENCES 1.Applied Biosystems. 1997. User Bulletin No. 2 ABI PRISM 7700 Sequence Detection System. PE Applied Biosystems, Foster City, CA. 2.Bevington, P.R. and D.K. Robinson. 1992. Data Reduction and Error Analysis for the Physical Sciences. McGraw-Hill, New York. 3.Bijwaard, K.E., N.S. Aguilera, Y. Monczak, M. Trudel, J.K. Taubenberger, and J.H. Lichy. 2001. Quantitative real-time reverse transcription-PCR assay for cyclin D1 expression: utility in the diagnosis of mantle cell lymphoma. Clin. Chem. 47:195-201. 4.Chang, T.J., C.C. Juan, P.H. Yin, C.W. Chi, and H.J. Tsay. 1998. Up-regulation of βactin, cyclophilin and GAPDH in N1S1 rat hepatoma. Oncol. Rep. 5:469-471. 5.Fairman, J., L. Roche, I. Pieslak, M. Lay, S. Corson, E. Fox, C. Luong, G. Koe, et al. 1999. Quantitative RT-PCR to evaluate in vivo
expression of multiple transgenes using a common intron. BioTechniques 27:566-574. 6.Fang, Y., W.H. Wu, J.L. Pepper, J.L. Larsen, S.A. Marras, E.A. Nelson, W.B. Epperson, and J. Christopher-Hennings. 2002. Comparison of real-time, quantitative PCR with molecular beacons to nested PCR and culture methods for detection of Mycobacterium avium subsp. paratuberculosis in bovine fecal samples. J. Clin. Microbiol. 40:287-291. 7.Foss, D.L., M.J. Baarsch, and M.P. Murtaugh. 1998. Regulation of hypoxanthine phosphoribosyltransferase, glyceraldehyde-3phosphate dehydrogenase and β-actin mRNA expression in porcine immune cells and tissues. Anim. Biotechnol. 9:67-78. 8.Freeman, W.M., S.J. Walker, and K.E. Vrana. 1999. Quantitative RT-PCR: pitfalls and potential. BioTechniques 26:112-125. 9.Heid, C.A., J. Stevens, K.J. Livak, and P.M. Williams. 1996. Real time quantitative PCR. Genome Res. 6:986-994. 10.Muller, P.Y., L. Barella, and A.R. Miserez. 2001. RepGene: a spreadsheet template for the management of reporter gene assays. BioTechniques 30:1294-1298. 11.Muller, P.Y., E. Studer, and A.R. Miserez. 2001. Molecular Biocomputing Suite: a word processor add-in for the analysis and manipulation of nucleic acid and protein sequence data. BioTechniques 31:1306-1313. 12.Pfaffl, M.W. 2001. A new mathematical model for relative quantification in real-time RTPCR. Nucleic Acids Res. 29:E45-E45. 13.Schneeberger, C., P. Speiser, F. Kury, and R. Zeillinger. 1995. Quantitative detection of reverse transcriptase-PCR products by means of a novel and sensitive DNA stain. PCR Methods Appl. 4:234-238. 14.Sheskin, D. 2000. Handbook of Parametric & Nonparametric Statistical Procedures. CRC Press LLC, Boca Raton, FL. 15.Taylor, J.R. 1982. An Introduction to Error Analysis: The Study of Uncertainties in Physical Measurements. University Science Books, Mill Valley, CA. 16.Thellin, O., W. Zorzi, B. Lakaye, B. De Borman, B. Coumans, G. Hennen, T. Grisar, A. Igout, and E. Heinen. 1999. Housekeeping genes as internal standards: use and limits. J. Biotechnol. 75:291-295.
Received 22 February 2002; accepted 11 April 2002. Address correspondence to: Patrick Y. Muller or André R. Miserez Research Group Cardiovascular Genetics Institute of Biochemistry and Genetics Department of Clinical-Biological Sciences University of Basel Vesalgasse 1 CH-4051 Basel, Switzerland e-mail:
[email protected] or
[email protected]
BioTechniques 7