and storage requirements of NGS data, we have devel- oped custom tools in C++ after the standard UNIX âpipe and filterâ design pattern. We have used BioLite ...
BioLite, a lightweight bioinformatics framework with automated tracking of diagnostics and provenance Mark Howison Brown University
Nicholas A. Sinnott-Armstrong Brown University
Abstract We present a new Python/C++ framework, BioLite, for implementing bioinformatics pipelines for NextGeneration Sequencing (NGS) data. BioLite tracks provenance of analyses, automates the collection and reporting of diagnostics (such as summary statistics and plots at intermediate stages), and profiles computational requirements. These diagnostics can be accessed across multiple stages of a pipeline, from other pipelines, and in HTML reports. Finally, we describe several use cases for diagnostics in our own analyses.
1
Introduction
As scientific data sets increase in size and analyses become more complex, there is growing concern about the need to track provenance: the exact origin and history of all products of a study. Ad hoc or scripted analyses that do not carefully document intermediate steps and results can lead to poor science: results may not be reproducible by other scientists (or even the scientist who conducted the original analysis!); errors can be difficult to detect; errors, once discovered, cannot be easily traced to earlier stages of the analysis; and results can’t be verified by extending the analyses to related data sets. In the bioinformatics community, these problems have become especially acute with the rise of Next-Generation Sequencing (NGS) data. The sheer size of these data sets, as well as the complexity of analyzing them, have exacerbated existing challenges and led to entirely new ones. In addition to the final results of a NGS study (which could include, for example, a de novo genome assembly, quantitative transcriptome analysis, or ChIP-Seq profile), there is new need for detailed diagnostics at each step. These diagnostics usually come in the form of plots or summary statistics. Comparing diagnostics across data sets and analyses provides a rich source of information to resolve issues with sample preparation methods and
Casey W. Dunn Brown University
data collection, optimize parameters used in analyses, and more accurately predict computational and storage demands. In this paper, we present a new framework, BioLite, developed in Python and C++ for implementing bioinformatics pipelines. BioLite is designed around three priorities: automating the collection and reporting of diagnostics, tracking provenance, and providing lightweight tools for building out customized analysis pipelines. By lightweight, we mean that we are targeting commandline usage and emphasizing minimal resource overhead, maximum performance, portability across systems, ease of installation, and a minimal set of dependencies. Our framework is accessible as a Python module and can run on a wide range of hardware, from laptops to large-memory servers to distributed-memory clusters, with minimal configuration. Where possible, we wrap existing bioinformatics tools, especially for assembly, alignment and annotation. For analyses where a tool does not exist or is not optimized for the high computational and storage requirements of NGS data, we have developed custom tools in C++ after the standard UNIX “pipe and filter” design pattern. We have used BioLite to implement Agalma, a collection of pipelines for de novo transcriptome assembly from Illumina data. These pipelines are the source of the examples in our Results section, but will be described in more detail in a subsequent publication.
2
Previous Work
There are many available frameworks and workflow management systems for bioinformatics analyses (for an overview, see the review by Romano [8]). These efforts have focused largely on increasing the accessibility of computational methods through GUI development; on formalizing and abstracting workflow representations (for instance, as directed-acyclic graphs); on addressing the interoperability of data available in disparate formats
3.1
and from disparate sources; and on facilitating reproducibility of analyses. Workflow management is a topic of general interest across many scientific domains, not just in the life sciences, especially as scientific inquiry has become increasingly data-driven (i.e., as computation and simulation have grown into a “third branch” of scientific inquiry, alongside experiment and theory) [3].
To implement automated provenance tracking and diagnostics collection, a BioLite installation maintains a SQLite database with three tables (see Figure 1). The catalog table pairs metadata with the raw NGS data files (identified by their absolute path on disk). It includes the following:
Of the available bioinformatics workflow frameworks, Galaxy [1, 4] has the most extensive support for automatically tracking the provenance of data and analyses. Although many of the systems reviewed by Romano support some type of exchangeable, executable format for sharing and rerunning analyses, only Galaxy collects enough metadata to disambiguate which version of a tool was used, or where input data is located. To a certain extent, Galaxy has made a tradeoff that favors ease of use (especially by biologists with minimal computational experience) at the expense of making installation more difficult. Installation can require extensive system administration experience to properly configure a system to support the supplied GUIs and other user tools. The Galaxy project provides a free public server, hosted at Penn State University, so that users can execute small analyses without needing to install Galaxy on their own machines. This service will not be sustainable as data sets grow in size, as Galaxy’s authors note [1].
• A unique ID for referencing the data set. If the data is paired-end Illumina HiSeq data, the ID can be automatically generated using unique information in the Illumina header. • Paths to the raw sequence data. For paired-end Illumina data, this is expected to be two FASTQ files (possibly compressed) containing the forward and reverse reads. • Notes about the species, the sample preparation and origin, the species, IDs from NCBI and ITIS taxonomies, and the sequencing machine and center where the data were collected. The catalog acts as a bridge between the BioLite diagnostics and a more detailed laboratory information management system (LIMS) for tracking provenance of sample preparation and data collection upstream of and during sequencing. GNomEx [7] is an example of such a system for NGS data that can track sample quality; document library preparation, cluster generation, and sequencing; and record experimental parameters and document laboratory protocols during data collection. In contrast, the BioLite catalog contains the minimal context needed to associate diagnostics reports of downstream analyses with the raw sequence data, but without replicating or reimplementing the full functionality of a LIMS. The runs table allocates an incremental run ID and documents the catalog ID, pipeline name, user name, system name, and start time for each invocation of a pipeline. Pipelines can be restarted if they fail, as discussed below, and in this case reuse the run ID already assigned to the run. Thus, a run ID encapsulates a completed, successful run of a pipeline, even if this requires
Both Ruffus [5] and PaPy [2] are lightweight pipeline frameworks that are simpler to install than Galaxy. They do not, however, track provenance. There is therefore currently an unmet need for a bioinformatics that is both lightweight and tracks provenance.
3
Provenance and Diagnostics
System Design
BioLite is designed to be as lightweight as possible, both to simplify installation and maintain flexibility. There is no dependency on a web server or networking infrastructure. Though implementing novel analyses requires programming experience, many difficult bioinformatics tasks are already abstracted, recording provenance is automatic, and there are simple hooks for logging diagnostics. BioLite is agnostic to batch systems, instead relying on the user to navigate the execution environment, which may be a batch system on a compute cluster, a commandline on a lab workstation, or even a cloud instance.
catalog diagnostics
VARCHAR
paths
TEXT VARCHAR
id
VARCHAR
species
run_id
INTEGER
ncbi_id
INTEGER
entity
VARCHAR
itis_id
INTEGER
attribute
In addition, BioLite is designed to collect and aggregate diagnostic data across runs to identify broader patterns that will help optimize data collection and analysis. No existing framework or system that we are aware of provides these kinds of comparative diagnostics, which we describe in more detail in our Results section.
id
runs
VARCHAR
value
TEXT
timestamp
DATETIME
run_id id
INTEGER VARCHAR
name
VARCHAR
hostname
VARCHAR
username
VARCHAR
timestamp
DATETIME
extraction_id
VARCHAR
library_id
VARCHAR
library_type
VARCHAR
tissue
VARCHAR
sequencer
VARCHAR
seq_center
VARCHAR
note
TEXT
sample_prep
TEXT
timestamp
DATETIME
Figure 1: Table schemas for BioLite’s SQLite database. 2
several restart invocations. The diagnostics table archives summary statistics that can be accessed across multiple stages of a pipeline, from different pipelines, and in HTML reports. Diagnostic entries are timestamped and stored as key/value pairs indexed by run ID. An additional namespace field prevents key collisions, since the same key could arise multiple times within a pipeline run. By default, the namespace is the pipeline name plus the stage name, so that key/value pairs can be traced to the pipeline and stage during which they were entered. Entries in the diagnostics table can include paths to derivative files, which can be summaries of intermediate files that are used to generate reports or intermediate data files that serve as input to other stages and pipelines. Detailed system utilization statistics, including memory high-water marks and compute wall-time are also stored in the diagnostics table by the base pipeline and wrapper classes. The diagnostics table has a complete non-executable history of the analysis, which complements the original scripts that were used to run the analysis. In combination, the diagnostics table and original scripts provide provenance for all analyses. Storage requirements for the diagnostics are minimal. Table 1 shows that for 168 pipeline runs on a collection of 30 Illumina HiSeq data sets, the footprint of the SQLite database and related text files (e.g. histograms) is a small fraction (0.03%) of the total run data. BioLite also distinguishes between two types of storage for intermediate results: permanent and scratch. This reflects the layout of file systems at most scientific computing centers. Permanent files are kept long term, and scratch files can be deleted at will. This arrangement allows the user to inspect temporary intermediate files after a run has completed, while simplifying garbage collection.
function with the values in the state dictionary whose keys match the function’s argument names. This is implemented using the function inspection methods available from the inspect module in the Python standard library. If the stage function returns a dictionary, it is ingested into the pipeline’s state by adding values for any new keys and updating values for existing keys. Arguments passed on the command-line to the pipeline script form the initial data in the pipeline’s state. Modularity is a key design goal, and it is possible to reuse one or more stages of an existing pipeline when building a new pipeline. It is also possible to build metapipelines that connect together several sub-pipelines. The pipeline object also incorporates fault tolerance. At the end of each stage, the pipeline stores a checkpoint by dumping its current state to a binary file with Python’s pickle module. This way, if a run is interrupted, either due to an internal error or to external conditions, such as a kill signal from a batch system or a hardware failure, the run can be restarted from the last completed stage (or, optionally, from any previous stage in the checkpoint). A pool of wrapper functions is available for commonly used NGS tools, such as the Bowtie aligner [6] and Oases transcriptome assembler [9], The base wrapper class can be extended to support additional tools.
4
Rounds of Purifcation
4.1
Table 1: Storage requirements for 168 runs Data raw data sets intermediate results (permanent) intermediate results (scratch) diagnostics: SQLite and text files
3.2
Results
GB 192.4 1,241.6 1,057.1 0.073
Sample Preparation 2 1 0
20
40 60 % non-ribosomal RNA
80
100
Figure 2: Diagnostics for the non-ribosomal RNA content after a filtering stage of our pre-assembly pipeline. Diagnostics enable validation and optimization of sample preparation methods. Figure 2 shows the percent of non-ribosomal RNA reads remaining after a filtering stage in our pre-assembly pipeline for transcriptomes. The preparation methods that used two rounds of purification beads were much more effective at removing ribosomal RNA, and therefore increasing the usable content of sequence data for transcriptome assembly.
Pipelines
BioLite borrows from Ruffus [5] the idea of using Python function decorators to delineate pipeline stages. Pipelines are created with a sequence of ordinary Python functions decorated by a pipeline object, which registers each function as a stage in the pipeline. The pipeline object maintains a persistent, global dictionary, called the state, and runs each stage by looking up the argument names in the stage function’s signature, and calling the
4.2
Automated Parameter Selection
Paired-end Illumina reads are sequenced with both a “forward” and “reverse” read, which cover the begin3
(a) Run 56
(b) Run 77
(c) Run 100
Figure 3: Diagnostics for distribution of insert sizes of three paired-end Illumina HiSeq data sets: (a) shows the distribution observed for most of our data sets, while (b) and (c) show deviations that require further investigation. ning and end of a DNA fragment. The total length of the sequenced fragment, including the reads and any unsequenced DNA in between them, is called the insert size. This is an important parameter for tools that use the paired-end information, since it constrains the distance between the two reads, and choosing a correct value for the insert size is critical for accurate and efficient analysis. BioLite includes a tool insert size that builds a small sub-assembly of the paired-end input data with oases, then maps another subset of reads against the assembly with bowtie to construct a histogram of actual insert sizes for the data (see Figure 3). If this step is performed before any other analyses, these improved estimates of mean and standard deviation for insert size are available in the diagnostics for all subsequent analyses by tools that require the insert size of the data.
4.3
5
Input size vs. memory used in pre-assembly
• PSCIC Full Proposal: The iPlant Collaborative: A Cyberinfrastructure-Centered Community for a New Plant Biology [0735191] • Collaborative Research: Resolving old questions in Mollusc phylogenetics with new EST data and developing general phylogenomic tools [0844596] • Infrastructure to Advance Life Sciences in the Ocean State [1004057]
35 30 25 20 15 10 515
Illumina TruSeq NuGen Ovation
20
25
30 35 40 Read pairs (Millions)
45
50
Acknowledgments
Thanks to Freya Goetz for helping to interpret sample preparation diagnostics. BioLite has been developed with support from the following National Science Foundation awards:
Resource Utilization 40
Memory high-water mark (GB)
puter purchases. We can also construct detailed execution profiles to see where time and memory are spent throughout a pipeline’s execution (see Figure 5). This is informative for pipeline development, as it shows which stages are the best targets for further optimization. In the case of the assembly pipeline, both the samtools and subsample calls are good candidates for optimization: we can avoid some of the samtools calls by incorporating the C library for BAM (binary SAM) files into our C++ tools, and we can parallelize the subsample tool to use more available compute cores. The diagnostics allow us to better prioritize software development tasks in terms of their potential impact on performance.
This research was conducted using computational resources and services at the Center for Computation and Visualization, Brown University.
55
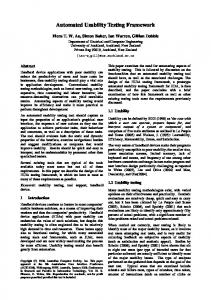
Figure 4: Diagnostics help correlate computational and memory requirements with data input size for our preassemble pipeline. Requirements vary with the sample preparation method of the sequenced data.
6
Availability
BioLite is distributed under the GNU General Public License version 3, and is available for download at
BioLite automatically collects resource profiles for all tools called through wrappers. This helps us infer the relationship between resource requirements and problem size (see Figure 4). Predicting these requirements helps us plan efficient use of computational infrastructure, for example by more accurately specifying memory and wall time limits when submitting jobs to a compute cluster. These data will also help users efficiently size new com-
http://www.dunnlab.org/biolite
References [1] A FGAN , E., BAKER , D., C ORAOR , N., G OTO , H., PAUL , I. M., M AKOVA , K. D., N EKRUTENKO , A., AND TAYLOR , J. Harnessing cloud computing with Galaxy Cloud. Nature Biotechnology 29, 11 (Nov. 2011), 972–4.
4
Memory (GB)
25 20 15 10 5 0 0
5000 velvetg samtools
10000 subsample velveth
15000 oases bowtie2
20000 Wall Time (s) filter_illumina exclude
25000
interleave blastn
30000 randomize cap3
35000 bowtie2-build fastqc
40000 formcon insert_stats
Figure 5: A diagnostics plot of execution time and memory usage of a transcriptome assembly pipeline implemented in BioLite with 39 stages and 113 calls to 16 external C, C++ or Java tools. The tools are colored from greatest (red) to least (blue) amount of cumulative execution time. Memory usage is reported as the high-water mark within the invocation of a tool, and the dashed line shows the high-water mark across the entire pipeline run. [2] C IE S´ LIK , M., AND M URA , C. A lightweight, flow-based toolkit for parallel and distributed bioinformatics pipelines. BMC Bioinformatics 12, 1 (Jan. 2011), 61. [3] D EELMAN , E., G ANNON , D., S HIELDS , M., AND TAYLOR , I. Workflows and e-science: An overview of workflow system features and capabilities. Future Generation Computer Systems 25, 5 (2009), 528 – 540. [4] G OECKS , J., N EKRUTENKO , A., AND TAYLOR , J. Galaxy: a comprehensive approach for supporting accessible, reproducible, and transparent computational research in the life sciences. Genome Biology 11, 8 (Jan. 2010), R86. [5] G OODSTADT, L. Ruffus: a lightweight Python library for computational pipelines. Bioinformatics 26, 21 (Nov. 2010), 2778–9. [6] L ANGMEAD , B., T RAPNELL , C., P OP, M., AND S ALZBERG , S. L. Ultrafast and memory-efficient alignment of short DNA sequences to the human genome. Genome Biology 10, 3 (2009), R25. [7] N IX , D., D I S ERA , T., DALLEY, B., M ILASH , B., C UNDICK , R., Q UINN , K., AND C OURDY, S. Next generation tools for genomic data generation, distribution, and visualization. BMC Bioinformatics 11, 1 (2010), 455. [8] ROMANO , P. Automation of in-silico data analysis processes through workflow management systems. Briefings in Bioinformatics 9, 1 (Jan. 2008), 57–68. [9] S CHULZ , M. H., Z ERBINO , D. R., V INGRON , M., AND B IRNEY, E. Oases : robust de novo RNA-seq assembly across the dynamic range of expression levels. Bioinformatics 28, 8 (2012), 1086– 1092.
5