Biomarker Indicators of Source and Depositional. Environment for the Organic Matters within Barsarin. Formation (Upper Jurassic) in Kirkuk and Taq Taq Oil.
Journal of Kirkuk University –Scientific Studies , vol.3, No.1,2008
Biomarker Indicators of Source and Depositional Environment for the Organic Matters within Barsarin Formation (Upper Jurassic) in Kirkuk and Taq Taq Oil Fields, Northern Iraq Dler H. Baban and Shadan M. Ahmed College of Science - University of Sulaimani Abstract The GC, GC/MS analysis for twelve bitumen extracts from Barsarin Formation in the wells K-109 and Tq-1 (Kirkuk and Taq Taq oil fields respectively) and for two oil samples from K-156 and Tq-1 wells revealed a euxinic, carbonate marine to mix environment for the initial organic matters. Pr / Ph, Pr / nC17, and Ph / nC18 ratios indicated also a marine source organic matters deposited under reduced condition with a less effect of biodegradation and mature stage of occurrence. The diasteranes / steranes ratio showed generally low ratios (0.27 – 0.56) as in most marine carbonate sources, while Algal-bacterial organic matter contribution for the extracts and the oil samples suggested depending on the predominance of C23 tricyclic terpane relative over the C19 tricyclic terpane and the C23 tricyclic terpane greater than C24 tricyclic terpane. The gammacerane Index indicated a low salinity environment of deposition for the initial organic matters existed in the analyzed samples.
Introduction The Barsarin Formation was first described by Wetzel (1950), in Bellen, (1959). The type locality and type section of Barsarin Formation located in Barsarin, Rowanduz district, north east Iraq. The formation at the type section comprises of limestones and dolomitic limestone (laminated, some fluffy-textured, locally cherty) and argillaceous, brecciated, and contorted beds. The formation is believed to be-at least partly of lagoonal evaporitic origin, indicated partly by the presence of anhydrites and oolitic in layers in some sections, partly by ubiquitous brecciated and crumbled beds (Buady, 1980). The Formation expected to be a basin floor evaporite facies by Sadooni (1997). A Kimmeridgian-Early Tithonian Age for the Formation is based on its stratigraphic position below the Chia Gara Formation of the Late-Tithonian Age and above the Kimmerdigian-Oxfordian Naokelekan Formation (Jassim & Buday, 2006 in Jassim & Goff, 2006).
51
Journal of Kirkuk University –Scientific Studies , vol.3, No.1,2008
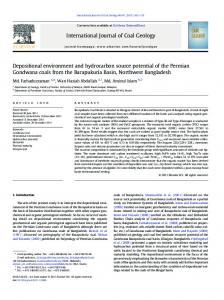
The Analyzed Samples Twelve extracts from Barsarin Formation has been chosen from the two subsurface sections of K-109 well from Kirkuk oil field and Tq-1 well from Taq Taq oil field, in addition to two oil samples from K-156 and Tq-1 wells to be analyzed in Baseline Resolution, Inc. (Analytical Laboratories in Huston, USA) by GC and GC/MS instruments (fig. 1, table 1). The thickness of Barsarin Formation in Kirkuk reached to about 283m and in Taq Taq about 75m. The GC analysis for the extracts from both sections show different degrees of contamination which expected to be caused by oil base mud during drilling. The degree of the contamination varied among the samples and affected the C15+ parameters. The three extracts from K-109 (3104, 3164, and 3364m) and one from Tq-1 section (3200m) were the least contaminated and their obtained ratios seem largely to be original or close to original. The biomarker data obtained from the saturate GC/MS analysis of the eight source rock extracts (five from K-109 and three from Tq-1) and the two oil samples show no affect of contamination from the oil base mud (Appendix).
Tq-1 K-109 K-156
Figure (1): Location map for the studied subsurface sections
52
Journal of Kirkuk University –Scientific Studies , vol.3, No.1,2008
Table (1): The analyzed extract samples of Barsarin Formation by GC and GC/MS instrument from both K-109 and Tq-1 wells, in addition to two oil samples from K-156 and Tq-1 wells. Analyzed Samples
Depth (m)
K-156, oil
GC
GC/MS
64 16201651
*
*
*
*
K-109
3104
*
K-109
3143
*
K-109
3164
*
K-109
3188
*
K-109
3210
*
*
K-109
3289
*
*
K-109
3299.4
*
*
K-109
3316
*
*
K-109
3364
*
*
Tq-1
3143
*
*
Tq-1
3165
*
*
Tq-1
3200
*
*
Tq-1, oil
Depositional Environment and Source Related Biomarkers Biological markers or biomarkers are molecular fossils, (originated from formerly living organisms), and are complex organic compounds composed of carbon, hydrogen, and other elements. They occur in sediments, rocks, and crude oils and show little or no change in structure from their parent organic molecules in living organisms (Peters et al., 2005) and their carbin skeletons can be traced back to living organisms (Hunt, 1996). The quality of information provided by the biomarkers or geochemical fossils in terms of depositional environment depends on three factors (as mentioned by Tissot and Welte, 1984):1- Their state of conservation, which may or may not allow one to link them to their biochemical precursor molecule. 2- The distribution of the biochemical precursor (parent molecule) in the present animal and /or plant kingdom.
53
Journal of Kirkuk University –Scientific Studies , vol.3, No.1,2008
3- The assumption that the distribution was comparable in ancient organisms. The utility of biomarkers as indicators of depositional environments arises from the fact that certain types of compounds are associated with organisms or plants that grow in specific types of depositional environments (Philp, 2004). Broocks et al. (1969) in Philp, (2004) noted the presence of the regular isoprenoids pristane (Pr) and phytane (Ph) in crude oils and coal extracts. This led Powell and Mickidy, (1973) in Philp, (2004) to propose a mechanism for the production of relatively high concentrations of pristine in oxic type environments and high concentration of phytane in reducing type environments. Thus, the Pr/Ph ratio evolved as an indicator of the oxicity of the depositional environment. Because some biomarkers pointed to specific taxa, they can also act as indicators of specific habitats. Fresh water environments are often indicated by the presence of biomarkers of typical fresh water organisms such as Botryococus braunii. Lacustrine conditions are often indicated by the predominance of algal steroids (Chen & Summons, 2002 in Brocks & Summons, 2004). Hypersaline lakes and ponds often develop anoxic conditions if saline deep water is covered with water of lower density. Sedimentary rocks that were deposited under these conditions often contain high relative concentrations of gammacerane, which is a biomarker generally associated with water column stratification (Sinninghe Damste et al., 1995 in Brooks & Summons, 2004). Rearranged steranes (diasteranes) are relatively more abundant in clastic sediments than in carbonates (van Kaam-Peters et al., 1998 in Brooks & Summons, 2004). Hopanoide appear to be similarly affected so that diahopanes and neohopanes are relatively more prominent in bitumen and oils derived from shales as opposed carbonates (Peters & Moldowan, 1993 in Brooks & Summons, 2004). However increase in thermal maturity is also a key factor in the conversion of biomarkers to their rearranged forms. Carbonate–dominated sediments tend to be deposited in low latitude environments and therefore biomarkers for organisms that preferentially colonize warm water tend to be important signatures in these sediments.
54
Journal of Kirkuk University –Scientific Studies , vol.3, No.1,2008
1. Pristane/Phytane: The abundant source of pristane (C19) and phytane (C20) is the phytal side chain of chlorophyll (a) in phototrophic organisms and bacteriochlorophyll (a) and (b) in purple sulphur bacteria (Mc Kirdy, 1973 in Peters et al., 2005). Reducing or anoxic conditions in sediments promote cleavage of the phytal side chain to yield phytol, which undergoes reduction to dehydrophytal and phytane. Oxic conditions promote the competing conversion of phytol to pristine by oxidation of phytol to phytenic acid, decarboxylation to pristene and then reduction to pristane (Peters et al., 2005). Didyk et al. (1978) in Peters et al. (2005) interpreted the redox conditions of the source rock depositional environment for crude oil based on a model for the origin of pristane (Pr) and (Ph) phytane. According to many authors, Pr/Ph less than 1 in crude oil indicates anoxic source rock deposition, particularly when accompanied by high porphyrin and sulphur contents, while Pr/Ph more than 1 indicates oxic deposition. Pr/Ph is commonly applied because Pr and Ph are measured easily using gas chromatography. In summary, the Pr/Ph ratios in the range of 0.8-3.0 are interpreted to indicate specific paleoenvironmental conditions without corroborating data. Pr/Ph more than 3.0 indicates terrigenous plant input deposited under oxic to suboxic conditions, while Pr/Ph less than 0.8 indicates saline to hypersaline conditions associated with evaporate and carbonate deposition (Peters et al., 2005). The ratio Pr/nC17 is useful for differentiating organic matter from swamp environment (more than 0.1) from those formed under marine environment (less than 0.5), but this ratio is affect by maturity, as well as biodegradation (Osuji & Antia, 2005). According to Elvsborg et al., (1985), Cohen and Dunn, (1987) both in Sletten, (2003) Pr/Ph ratios typical for type II marine shales are 0.6-1.6. An oil accumulation have pristane / phytane ratio more than 3.0, indicative of a predominantly non marine source from terrestrial organic matter. Furthermore, the progressive change from waxy to light oil has been interpreted to indicate an increased contribution of bacterial or algal source inputs to the lighter oil (Powel et al., 1989 in Boreham & Hill, 1998). An alternative interpretation is that the original source input, although dominated from terrestrial organic matter, has been masked by secondary alteration processes.
55
Journal of Kirkuk University –Scientific Studies , vol.3, No.1,2008
The ratios of the Pr / Ph for the four uncontaminated extracts mentioned above in this study were generally low and ranged between 0.34 and 0.61 (less than 0.8) (table 2) indicating anoxic, reduced marine carbonate depositional environment. The ratio of Pr / nC17 for the same four extracts ranged between 0.15 and 0.29 (less than 0.5) indicating marine environment of deposition also. The cross plot of Pr / nC17 versus Ph / nC18 for the whole analyzed samples (fig. 2) shows clear marine source organic matters deposited under reduced condition with a less effect of biodegradation and mature stage of occurrence. Table(2):Ratios of Pr/Ph, Pr/(Pr+Ph), Pr/nC17, and Ph/nC18 for the analyzed samples.
64 16201651
0.84
Pr/ (Pr+Ph) 0.46
0.87
0.47
0.18
0.25
K-109
3104
0.39
0.28
0.25
0.69
K-109
3143
0.14
0.12
0.24
1.08
K-109
3164
0.39
0.23
0.23
0.45
K-109
3188
0.14
0.12
0.38
3.34
K-109
3210
0.14
0.13
0.29
2.11
K-109
3289
1.88
0.66
0.33
0.19
K-109
3299.4
1.95
0.66
0.32
0.17
K-109
3316
1.51
0.56
0.29
0.21
K-109
3364
0.61
0.38
0.15
0.31
Tq-1
3143
1.34
0.57
0.36
0.34
Tq-1
3165
0.53
0.35
0.28
0.6
Tq-1
3200
0.34
0.25
0.29
1.07
Samples K-156, oil Tq-1, oil
Depth (m)
Pr/Ph
Pr/nC17
Ph/nC18
0.27
0.36
The result of analysis for the two oil samples of K-156 and Tq-1 also seem to be original and no effects of contaminations have been detected. The position of these two oil samples on the cross plot of Pr / nC17 versus Ph / nC18 show a good correlation with the analyzed extracts. The small difference between the Pr / Ph ratio of the two oil samples (0.84 for K-156
56
Journal of Kirkuk University –Scientific Studies , vol.3, No.1,2008
and 0.87 for Tq-1 oil) and those of the extracts may be interpreted as those two oils generated from additional marine sources of organic matters (generally of Jurassic age) and not only from Barsarine source rocks.
A
B ion dat C a r deg
tion
tion duc
tura Ma
Bio Re
17
n atio
Pr / n-C
Terrestrial Source Peat-Coal Source Mixed Source Marine Source
id Ox
A B C D
D
Pr //n-C Ph n-C18 18
Oil, K-156 Oil, Tq-1 K-109, 3104m K-109, 3143m K-109, 3164m K-109, 3188m K-109, 3210m K-109, 3289m K-109, 3299.4m K-109, 3316m K-109, 3364m Tq-1, 3143m Tq-1, 3165m Tq-1, 3200m
Figure (2): Pr/nC17 versus Ph/nC18 cross plot, from which a mature, marine source organic matter can be detect for the analyzed samples. (The plot after Shanmugam, 1985 in Younes and Philip, 2005). 2. Diasteranes/Steranes: Diasteranes / steranes ratios are commonly used to distinguish petroleum from carbonate versus clastic source rocks (Mello et at., 1988 in peters et al., 2002). Low diasteranes / steranes ratios (mass/charge 217) in oils indicate anoxic clay-poor or carbonate source rocks. During diagenesis of these carbonate sediments, bacterial activity provides bicarbonate and ammonium ions, resulting in increased water alkalinity. Under these conditions of high pH and low Eh, calcite tends to precipitate and organic matter preservation is improved (Peters et al., 2005). High diasteranes / steranes ratios are typical of petroleum derived from clay-rich source rocks and in some crude oils can result from high thermal maturity (Seifert & Moldowan, 1979 in Peters et al., 2005) and/or heavy biodegradation (Peters et al., 2005).
57
Journal of Kirkuk University –Scientific Studies , vol.3, No.1,2008
At high levels of thermal maturity, rearrangement of steroids to diasterane precursors may become possible, even without clays, due to hydrogen-exchange reactions, which are enhanced by the presence of water (Van Kaam-Peters et al., in Peters et al., 2005). Alternatively, diasteranes simply may more stable and survive thermal degradation better than steranes. The diasteranes/steranes ratio is useful for distinguishing sourcerock depositional conditions only when samples show comparable levels of thermal maturity (Peters et al., 2005). Heavy biodegradation can result in selective destruction of steranes relative to diasteranes. However, it's possible that non-biodegraded oil might mix with heavily biodegraded oil showing a much higher diasteranes/steranes ratio. In such cases, only careful quantitative assessment of each biodegradation-sensitive parameter can led to the correct interpretation (Peters et al., 2005). The diasteranes / steranes ratio for the analyzed extracts and oil samples show generally low ratios (0.27 – 0.56) (table 3) indicating anoxic carbonate source rocks. There is a positive correlation between Pr / (Pr+Ph) and C27 diasteranes/ (diasteranes+steranes) that were controlled by the depositional environments (Moldowan et al. 1994 in Peters et al., 2005). Pr / (Pr+Ph) increases with clay content, as measured by increasing diasteranes, which parallels oxidative strength (Eh) of the water column during deposition. Depending on the relation between Pr / (Pr+Ph) and C27 diasteranes/ (diasteranes+steranes) (fig. 3) a slight difference in the source of the organic matters between K-109 and Tq-1 sections appeared as a contribution from anoxic shale source seems to be occurred in the section K-109 while anoxic carbonate source is clear in Tq-1. The cross plot of C27 / C29 diasterane versus C27 / C29 sterane used to identify the source of the analyzed extracts and oil samples in this study (fig. 4).The result of this cross plot indicated a mixed origin of organic matters, and all the extracts and the two oil samples have generally C27 / C29 diasterane values larger than C27 / C29 sterane (table 4). 3. C27, C28, and C29 Steranes Ternary Plot: Haung and Meinschein (1979) in Peters et al., (2005) proposed that the distribution of C27, C28, and C29 sterol homologs on a ternary diagram might be used to differentiate ecosystems.
58
Journal of Kirkuk University –Scientific Studies , vol.3, No.1,2008
The ternary plot of the relative amounts of C27, C28, and C29 steranes for the analyzed samples (table 4) definitely indicated hydrocarbons generated in a marine with a carbonate nature source environment (fig. 5). The locations of the plotted samples are similar with those proposed by Osadetz et al., (2004) for samples of Mesozoic marine source.
0.8
Anoxic Shales
0.7
Suboxic strata
Pr (Pr + Ph)
0.6
Oil, K-156 Oil, Tq-1 K-109, 3210m K-109, 3289m K-109, 3299.4m K-109, 3316m K-109, 3364m Tq-1, 3143m Tq-1, 3165m Tq-1, 3200m
0.5
Anoxic Carbonates
0.4
0.3
0.2
0.1 0.1
0.2
0.3
0.4
0.5
0.6
0.7
C27 Dia/(Dia+Reg Steranes)
Figure (3): Pr/ (Pr+Ph) versus C27 diasteranes/ (diasteranes+steranes) cross plot, from which anoxic carbonate and anoxic shale marine source organic matter can be detect forTq-1 and K-109 samples respectively. (The cross plot is from Peters et al., 2005).
59
Journal of Kirkuk University –Scientific Studies , vol.3, No.1,2008
Table (3): C27, C28, and C29 Sterane and Diasterane ratios for the analyzed oil and extract samples. Sterane (217 m/z) Depth (m) 64 16201651 3210 3289 3299.4 3316 3364 3143 3165 3200
Samples K-156 Tq-1 K-109 K-109 K-109 K-109 K-109 Tq-1 Tq-1 Tq-1
Diasterane (217 m/z)
Sterane/ Diasterane (217m/z)
C27
C28
C29
C27
C28
C29
178.2
195.4
245.7
33.7
76.4
33.6
0.27
37.9
37.2
53.9
13.1
22.8
13.1
0.53
7204 7672 8650 9591 3093 6592 6365 10785
7652 9351 9895 11047 3372 6983 7134 12496
9372 10586 11356 12752 4150 8558 8942 14983
2567 2772 3068 3504 1111 2237 2250 3781
3890 4359 4932 5717 1594 3460 3503 5976
2035 2470 2741 3519 1081 1998 1933 3460
0.54 0.55 0.55 0.56 0.54 0.51 0.53 0.55
2.0
Marine
C27 / C29 Diasteranes
1.5
Mixed 1.0
0.5
Terrestrial
0 0
0.5
1.5
1.0
2.0
C27 / C29 Steranes
Oil, Tq-1 Oil, K-156 K-109, 3210m K-109, 3288m K-109, 3299.4m K-109, 3316m Tq-1, 3200m Tq-1, 3165m Tq-1, 3143m K-109, 3364m
Figure (4): C27/C29 Diasteranes versus C27/C29 Steranes cross plot shows a mixed depositional environment for the analyzed oil and extract samples. Very good oil – source rock correlation also can be recognized. (The cross plot is from Ghori, 2000).
60
Journal of Kirkuk University –Scientific Studies , vol.3, No.1,2008
Table (4): The ratios of different biomarkers which have been used in detecting the source and depositional environment for the analyzed oil and extract samples. Samples
Depth (m)
K-156 Tq-1
64 16201651 3210 3289 3299.4 3316 3364 3143 3165 3200
K-109 K-109 K-109 K-109 K-109 Tq-1 Tq-1 Tq-1
C27/C29 Ster. (217m/z) 0.72 0.7
C27/C29 Dias. (217m/z) 1 1
C27 Dias./ (Dias.+Ster.) (217 m/z) 0.15 0.25
Steranes/ Hopanes
0.76 0.72 0.76 0.75 0.74 0.77 0.71 0.71
1.2 1.1 1.1 0.99 1 1.1 1.1 1
0.26 0.26 0.26 0.267 0.264 0.25 0.261 0.259
0.52 0.63 0.6 0.51 0.48 0.58 0.55 0.6
0.34 0.43
Steranes Index (218 m/z) 3.24 3.83 3.72 3.48 3.6 3.6 3.83 3.48 3.4 3.12
Olean. Index (191m/z) 0.05
0.07 0.04
C28 100%
Oil, K-156 Oil, Tq-1 K-109, 3210m K-109, 3289m K-109, 3299.4m K-109, 3316m K-109, 3364m Tq-1, 3143m Tq-1, 3165m Tq-1, 3200m
10
10
20
20
Non-marine shale
30
30
Marine > 350 M.Y.
40
40
Marine carbonates Marine shale
50
50
60
60
70
70
80
80
90
90
100
C27
100 90
80
70
60
50
40
30
20
10
C29
Figure (5): Ternary plot of the relative amounts of C27, C28, and C29 steranes for the analyzed oil and extract samples. Marine with a carbonate nature source environment can be recognized. Overlap between the different oil source types limits the use of sterane distribution to describe the source rock depositional environment. (The diagram from Moldowan et al., 1985 in Peters et al., 2005). 61
Journal of Kirkuk University –Scientific Studies , vol.3, No.1,2008
4. C30 Sterane Index [C30/ (C27-C30) Steranes]: The C30 sterane ratios generally increase with marine versus terrigenous organic matter input to the source rock (Peters et al., 2005). The presence of C30 4-desmethysteranes in crude oil is the most powerful means in order to identify input of marine organic matter to the source rock (Peters et al., 1986 in Peters et al., 2005). These C 30 steranes are identified as 24-n-propylcholestanes, which originate from 24-n-propylcholeseroles (Moldowan et al., 1990 in Peters et al., 2005) Ratio of C30/ (C27-C30) steranes against oleanane / hopane give a better assessment of marine versus terrigenous input to petroleum than either parameter alone. High oleanane and lower C30 steranes, suggesting a deltaic source rock with strong terrigenous input. High C 30 steranes and lower oleanaes, suggesting a marine source rocks with less terrigenous input. The generally high ratios of the C30 Sterane Index of the analyzed samples (3.12 – 3.83) (table 4) is an indication for marine source of organic matters. Plotting the obtained values of C 30/ (C27-C30) steranes versus oleanane index for the two extract samples from the depths 3165m and 3200m in Tq-1 well and the oil sample of K-156 revealed a marine source organic matters rather than terrigeneous origin figure (6). 1
Sterane Index, C30/(C27-C30) (%)
IIB
IIC e u rc
o cS tai
2
no ge rri e T
3
us
l De
ut Inp
IIA
4 IA n ari
o eS
e urc
I/II
M
5 IB
0
0.05
0.1
0.15
0.2
0.25
0.3
Oleanane Index, Oleanane / ( Oleanane+ Hopane) (%) Oil, K-156
Tq-1, 3165m
Tq-1, 3200m
Figure (6): Sterane Index versus Oleanane Index cross plot shows a clear marine influence on the source of the analyzed oil and extract samples. (The cross plot is from Peters et al., 2005). 62
Journal of Kirkuk University –Scientific Studies , vol.3, No.1,2008
5. Gammacerane: A C30 pentacyclic triterpane in which each ring contains six carbon atoms. Source rock deposited in stratified anoxic water columns (commonly hypersaline) and related crude oils commonly have high gammacerane indices (gammacerane / hopane). The gammacerane Index (gammacerane / hopane C31) for all analyzed samples (extracts and oil samples) show a low ratio (0.1 – 0.3) (table 5) indicating a low salinity environment of deposition for the initial organic matters. Higher salinity is typically accompanied by density stratification and reduced oxygen content in bottom waters (i.e. lower Eh), which results in lower Pr / Ph. Figure (7) shows the relationship between the gammacerane index and Pr / Ph ratio for the analyzed oil and extract samples. The cross plot indicates a marine environment of deposition and it is comparable with the results of the diagram of peters et al., (2005).
Table (5): Ratios of different biomarkers within the analyzed oil and extract samples. Samples
K-156 Tq-1 K-109 K-109 K-109 K-109 K-109 Tq-1 Tq-1 Tq-1
Depth (m)
64 16201651 3210 3289 3299.4 3316 3364 3143 3165 3200
Gammacerane Index (191 m/z)
Tricyclic Tricyclic terpanes terpanes C22/C21 C24/C23 (191 m/z) (191 m/z)
Tricyclic terpanes C28+C29 / Ts (191 m/z)
C29H / C30H (191 m/z)
C35H / C34H (191m/z)
0.1
0.7
0.36
0.84
1.31
1.19
0.1
0.5
0.46
0.50
1.12
1.01
0.15 0.1 0.1 0.3 0.26 0.11 0.1 0.08
0.54 0.63 0.52 0.51 0.6 0.42 0.51 0.54
0.56 0.57 0.55 0.54 0.6 0.58 0.56 0.62
0.67 0.89 0.71 0.40 0.35 0.72 0.98 1.01
1.24 1.17 1.21 1.44 1.31 1.16 1.08 1.13
0.96 1.01 0.97 0.96 1.04 0.98 0.88 0.97
63
Journal of Kirkuk University –Scientific Studies , vol.3, No.1,2008
2.0
1.9
1.8
1.6
Oil, K-156 Oil, Tq-1 K-109, 3209m K-109, 3288m K-109, 3299m K-109, 3316m K-109, 3364m Tq-1, 3143m Tq-1, 3165m Tq-1, 3200m
1.4
Pr / Ph
1.2
1.0
0.8
0.6
0.4
0.2
0 0
0.1
0.2
0.3
0.4
Gammacerane Index % Figure (7): Gammacerane index versus Pr / Ph ratio for the analyzed oil and extract samples. (The cross plot is from Peters et al., 2005). 6. Terpanes: The biomarker compounds referred to as terpanes are mainly derived from bacterial (prokaryotic) membrane lipids (Mukhopadhyah, 2004). These ratios help to identify extracts and crude oils derived from carbonate source rocks. Generally, oils from carbonate source rocks can be distinguished by high C22/C21 tricyclic terpane and low C24/23 tricyclic terpane (Peters et al., 2005). The plot of the analyzed extracts and oil samples (specially the oil sample from K-156) (table 5) (fig.8) shows a great similarity with the analyzed extracts and oil samples of carbonate origin worldwide by Geo Mark Research Inc. (2000) in Peters et al., (2005) and that relating to their included ratios of tricyclic terpanes C22/C21 versus tricyclic terpanes C24/C23. In the terpane distribution (m/z 191), the predominantly algal-bacterial organic matter contribution for the extracts and the oil samples can be suggested from the C19 – C25 tricyclic terpanes
64
Journal of Kirkuk University –Scientific Studies , vol.3, No.1,2008
Tricyclic Terpane C24 /C23
distribution by the predominance of C23 tricyclic terpane relative over the C19 tricyclic terpane and the C23 tricyclic terpane greater than C24 tricyclic terpane. The C19 / C23 tricyclic terpane ratio is thus very low (extracts: 0- 0.33; oils: 0.21 and 0.60) and the C23 / C24 tricyclic terpane ratio is greater than 1 (extracts: 1.59- 1.83; oils: 2.16 and 2.71). In the pentacyclic terpanes, the high C24 tetracyclic / C26 tricyclics ratio (extracts: 1.57 – 4.18; oils: 3.94 and 4.04), the high norhopane / hopane ratio (extracts: 1.08 – 1.44; oils: 1.12 and 1.43), and the high C35 / C34 hopane ratio (extracts: 0.88 – 1.04; oils: 1.01 and 1.19) (table 5) indicate marine carbonate facies and anoxic depositional condition for the source rock of the extracts and the oils. Figure (9) shows the relationship between norhopane / hopane (C29H/C30H) and C35 / C34 hopane ratios for the analyzed extracts and oil samples. From the cross plot a carbonate content and anoxic condition dominant is clear. A high hopane/Sterane ratio can indicate terrestrial input, while low ratios are typical for marine derived petroleum (Sletten, 2003). Based on this, all the analyzed samples as appears in the cross plot between Pr/Ph ratio and hopane/ sterane ratio (fig.10) indicate a marine source of organic matters.
Tricyclic Terpane C22 /C21 Oil, K-156 Oil, Tq-1 K-109, 3210m K-109, 3289m K-109, 3299.4m K-109, 3316m K-109, 3364m Tq-1, 3143m Tq-1, 3165m Tq-1, 3200m
Figure (8): Tricyclic terpanes C22/C21 versus Tricyclic terpanes C24/C23 ratios for the analyzed oil and extract samples. Such a relationship indicates a marine, carbonate sources. (The cross plot is from Peters et al., 2005).
65
Journal of Kirkuk University –Scientific Studies , vol.3, No.1,2008
Anoxic condition 2.0
Carbonate content
1.2
0.8
0.4
0
0.2
0.6
0.4
0.8
1.2
1.0
1.8
1.6
1.4
2.0
C35H/C34H Oil, K-156
Oil, Tq-1
Tq-1, 3143m
K-109, 3299m
Tq-1, 3165m
K-109, 3316m
K-109, 3364m
K-109, 3209m
K-109, 3288m
Tq-1, 3200m
Figure (9): C29H/C30H versus C35H/C34H ratios shows the influence of anoxicity in a carbonate marine environment for the analyzed oil and extracts samples. The diagram also indicates similarity in the source of the extracts and the oil samples. 8
Terrestrial
Hopane/Sterane
6
4
Marine 2
0
C29H/C30H
1.6
0
0.2
0.4
0.6
0.8
1.0
1.2
1.4
1.6
1.8
2.0
2.2
Pr / Ph K-109, 3210m K-109, 3288m K-109, 3299.4m Oil, K-156 Oil, Tq-1 Tq-1, 3200m Tq-1, 3165m K-109, 3364m Tq-1, 3143m K-109, 3316m
Figure (10): Cross plot between Pr/Ph ratio and hopane/sterane ratio indicating a marine source of the analyzed extracts and oil samples. (The diagram from Sletten, 2003 with modifications)
66
Journal of Kirkuk University –Scientific Studies , vol.3, No.1,2008
Conclusions The GC/MS analysis for extracts from selected samples from Barsarin Formation in the two sections of K-109 and Tq-1 indicated a euxinic, marine (to mix) carbonate source of deposition. The same source also supposed for the two oil samples taken from K-156 and Tq-1 wells. Pr / Ph, Pr / nC17, and Ph / nC18 ratios indicates marine source organic matters deposited under reduced condition with a less effect of biodegradation and mature stage of occurrence. The diasteranes / steranes ratio for the analyzed extracts and oil samples show generally low ratios (0.27 – 0.56) indicating anoxic carbonate source rocks. Algal-bacterial organic matter contribution for the extracts and the oil samples can be suggested. The gammacerane Index indicated a low salinity environment of deposition for the initial organic matters existed in the analyzed samples of both extracts and oil samples.
Acknowledgment We would like to thank very much Dr. George Pinckney and Mr. Don Rae from Western Zagros Oil Company for their cooperation and assistances in analyzing the samples by GC/MS in Baseline Resolution, Inc. (Analytical Laboratories in Huston, USA).
67
Journal of Kirkuk University –Scientific Studies , vol.3, No.1,2008
References Bellen, R.C. van, Dunnington, H.V., Wetzel, R. and Morton, D.M., 1959, Luxique Stratigraphique International, Asie, Fascicule10a, Iraq, Paris, 333 p. Boreham, C.J., and Hill, A.J., 1998, Source Rock Distribution and Hydrocarbon Geochemistry, Petroleum Geology of South Australia, Vol. 4, pp. 129-142. Broock, J.J., and Summons, R.E., 2004, Sedimentary Hydrocarbons, Biomarkers for Early Life, in Holland, H.D. and Turekian, K.K. (eds.), Treatise on Geochemistry, Vol. 8, Biogeochemistry, Elsevier, Amsterdam, 425 P. Buday, T., 1980, The Regional Geology of Iraq, Volume 1, Stratigraphy and Paleogeography, Dar Al-Kutub publishing house, University of Mosul, Iraq, 445 P. Jassim S. Z. and Buday T., 2006, Late Toarcian-Early Tithonian (Mid-Late Jurassic) Megasequence AP7, Chapter 10, in Jassim, S.Z., and Goff, J.C. (Eds.), Geology of Iraq, Printed in Czech Republic, 341 P. Hunt, J. M., 1996, Petroleum Geochemistry and Geology (Second Edition), Freeman and Company, New York, 743p. Mukhopadhyah, P.K., 2004, Evaluation of petroleum potential of the Devonian-Carboniferous rocks from Cape Breton Island, Onshore Nova Scotia, Final Report, Contract Number: 60122058 of March 31, 2004: Global Geoenergy Research Ltd. Osadetz, K.G., Jiang, C.A., Evenchick, C.A., Ferri, F., Stasiuk, L.D., Wilson, N.S.F., and Hayas, M., 2004, Sterane Compositional Traits of Bowser and Sustut Basin Cruid Oils: Indication for three effective Petroleum Systems, Resource Development and Geoscience Branch, Summary of Activities, British Columbia Ministry of Energy and Mines, PP. 99-112. Osuji, L.C., and Antia, B.C., 2005, Geochemical Implication of some Chemical Fossils as Indicators of Petroleum Source Rocks, AAPL Journal, Sci. Environ. Mgt. Vol. 9, No.1, PP. 45-49.
68
Journal of Kirkuk University –Scientific Studies , vol.3, No.1,2008
Ozcelik, O. and Altunsoy, M., 2005, Organic Geochemical Characteristics of Miocene Bituminous Units in the Beypazari Basin, Central Anatolia, Turkey, The Arabian Journal for Science and Engineering, Vol. 30, No. 2A., PP. 181-194. Peters, K.E. and Fowler, M.G., 2002, Applications of petroleum geochemistry to exploration and reservoir management, Organic Geochemistry,vol. 33, pp. 5-36. Peters, K.E., Walters, C.C., Moldowan, J.M., 2005, The Biomarker Guide, Second Edition, Volume II, Biomarkers and Isotopes in Petroleum Systems and Earth History, United Kingdom at the Cambridge University Press, 684 P. Philp, R.P., 2004, Formation and Geochemistry of Oil and Gas, in Holland, H.D. and Turekian, K.K. (eds.), Treatise on Geochemistry, Vol. 17, Sediments, Diagenesis and Sedimentary Rocks, Volume Editor, F.T. Mackenzie, Elsevier, Amsterdam, 425 P. Sadooni, F.N., 1997, Stratigraphy and Petroleum Prospects of Upper Jurassic Carbonates in Iraq, Petroleum Geoscience,Vol. 3, PP. 233243. Sletten, E.B., 2003, A comparison of Petroleum from Reservoirs and Petroleum Inclusions in Authigenic Mineral Cements-Haltenbanken, University of Oslo, Department of Geology, pp. 80-107. Tissot, B.P. and Welte, D.H., 1984, Petroleum Formation and occurrence: A new approach to oil and gas exploration, 2nd ed.: Springer – Verlag, Berlin, 699 P. Younes, .M.A., and Philp, .R.P., 2005, Source Rock Characterization based on Biological Marker Distribution of Crude Oils in the Southern Gulf of Suez, Egypt, Journal of Petroleum Geology, Vol. 28 No. 3, PP. 301-317.
69
Journal of Kirkuk University –Scientific Studies , vol.3, No.1,2008
APPENDIX The GC/MS chromatograms for the analyzed extracts and oil samples
K-109,3210m
K-109, 3316m
K-109, 3289m
K-109, 3299.4m
K-109, 3364m
Tq-1, 3143m
70
Journal of Kirkuk University –Scientific Studies , vol.3, No.1,2008
Tq-1, 3165m
Tq-1, 3200m
Tq-1, Oil sample, 1620-1651m
71
K-156, Oil Sample, 64m
Journal of Kirkuk University –Scientific Studies , vol.3, No.1,2008
استخدام الداالت الحياتية لتحديد أصل المواد العضوية الموجودة في تكوين بارسرين (الجوراسي األعلى) و بيئة ترسيبها و ذلك في حقلي كركوك و طقطق النفطيين /شمال العراق
دلير حسين بابان و شادان محمود أحمد كلية العلوم ـ جامعة السليمانية الخالصة تحاليل كروماتوكراف الغاز( (GCو كروماتوكراف الغاز/طيف الكتلي(((GC/MS
ألثني( شرير
مستخلصا بتيومينيا من تكوين بارسرين ف( بئرى كركوك 901-و طقطق 9-و نموذجين من النفط ميخخوذين من بئري كركوك 951-و طقطق 9-بينت أن المواد العضوية األولية ف( التكوين مترسبة ف( بيئية بحريية هوائية كربوناتية إلى ممتزجة .كما أظهرت نسب البرستين C17 /و الفايتين C18 /بخن المواد العضوية في( التكوين مترسبة ف( بيئة اختزالية و إنها ناضجة حراريا و غير متخثرة بعمليات التكسير الحييات( .إن النسيبة
الواطئة للدايسترين /استيرين ( ) 0251- 02,0أكدت األصل البحري الكربونات( للمواد العضيوية 2كميا إن ريوع الترايسايكليك تربين ( )C23و تجاوز نسبتها نسب كل من الترايسايكليك تربين ( )C19و ( )C24أكيدت بخن الطحالب و البكتيريا راركتا ف( إنتاج المواد العضوية الممثلة ألصل المستخلصات البتيومينيية و نميوذج( النفط الت( تم دراستها .من ناحية أخرى 2أمكن ا ستد ل شلى الملوحة الواطئة لبيئة ترسيب الميواد العضيوية
األولية ف( النماذج المدروسة اشتمادا شلى شامل الكمسيرين.
72