Biomedical Document Triage: Automatic Classification Exploiting Category Specific Knowledge L. Venkata Subramaniam, Diwakar Punjani*, Sougata Mukherjea IBM India Research Lab, New Delhi, India E-mail: {lvsubram, smukherj}@in.ibm.com *Indian Institute of Technology, Roorkee, India E-mail:
[email protected]
Abstract— We approached the problem of categorizing papers for the 2005 TREC Genomics Track Categorization task in three different ways. In the first, we used a machine learning based approach. We used the MeSH ontology and other specialized ontologies from MGI to identify the set of features to be used in the classification. In the second, for each of the categories, we identified a set of terms to use for filtering the articles. In the third, combined approach, we used the machine learning based approach on the filtered set of articles. In all three approaches we incorporate biological knowledge about the classes into the classification system to achieve improved utility.
I. I NTRODUCTION The categorization task for the 2005 genomics track uses data from the Mouse Genome Informatics (MGI) [12] system and is a document triage task. The categorization task looks at how well systems can categorize articles for four major categories of information collected and catalogued by MGI. These four categories include articles about: 1) Alleles of mutant phenotypes [17] 2) Embryologic Gene Expression [6] 3) Gene Ontology (GO) [4] 4) Tumor Biology [14] To find information on mouse genomics biology (relating to the categories listed above and others) MGI follows a three step process [5]. In the first step new scientific literature is automatically scanned for records containing one or more instances of the words “mouse”, “mice”, and “murine”. In the second triage step the articles that should be sent for curation are identified by MGI personnel. The goal of this triage process is to limit the number of articles sent to human curators for more exhaustive analysis. Articles that pass this step go into the MGI system with a tag for GO, tumor, expression, etc. Tagged articles are then sent for the actual curation by human curators. For example, for the gene function category curators identify genes for which there is experimental evidence to warrant assignment of GO codes within an article. The categorization task for the 2005 genomics track is to automate the triage task that involved correctly classifying which articles have been selected for curation in the four categories. The 2004 genomics track also included the triage
task [5]. However, in it, only the gene ontology category for assignment of GO codes was considered. Different machine learning methods have been used for the classification of text documents [16]. Support Vector Machines (SVM) [8], Naive Bayes classification [11] and a number of other machine learning techniques have shown a lot of promise in text categorization tasks. A variety of implementations of the various machine learning methods are available. For example, the Weka toolkit [20] comprises a suite of machine learning tools that can be used for classification. Similarly, SVMlight [7] and LibSVM [1] are implementations of SVM. Many of the top teams in 2004 used the MeSH terms from the Medline records as one of the features [5]. An ontology like Medical Subject Headings (MeSH) [10] provides a set of broad-based, multidisciplinary concepts and categories to annotate the content of biological literature in terms of key concepts describing genes, proteins, cell function, anatomical objects, diseases and so on. Also depending on the application, either features selected from the full article or carefully selected sections of it have been shown to give different results [15]. Such an approach where sections are weighted differently is possible when the documents are structured. This paper presents techniques to automatically triage the articles into the four categories. We have tried to incorporate category specific knowledge to improve the classification accuracy. We have used category specific word lists from MGI to select the features for the classification. We approach the classification task in three ways. In the first approach we considered a machine learning based method. We represent the article as a bag of concepts. We chose a set of concepts which best represent the classes and these features are then used to classify the articles. We tried different category specific features, like using specialized term lists and MeSH terms, and also different ways of selecting the relevant features. Our second approach consisted of identifying concepts that can be used to filter the articles. In the 2004 task it was noted that the utility for the MeSH term “Mice” for GO classification was better than all but the best run [3]. We try to identify a larger set of concepts that are specific to the categories and help in improving the utility when used to filter the documents.
Data set Training data Test data
Total articles 5837 6043
Allele Pos 338 332
Neg 5499 5711
Expr. Pos 81 105
Neg 5756 5938
GO Pos 462 518
Neg 5375 5525
Tumor Pos 36 20
Neg 5801 6023
TABLE I D ESCRIPTION OF THE DATA SET
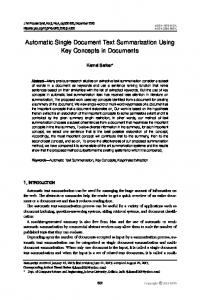
Fig. 1.
Classification System Block Diagram
For example, the presence of the concept “tumor” is a strong indicator of an article being positive for the tumor biology category, where as, the presence of the concept “transplanted tumor” is a strong negative indicator for the same class. In our final approach we use a two stage classifier. In the first step articles are filtered based on the presence or absence of a predefined set of concepts. In the second step the positive documents, after the first step, were classified using a machine learning based method. As stated above, the features for the machine learning approach were the MeSH terms and concepts chosen using specialized dictionaries relevant to the category. The best performing run in 2004 had also used a two stage classifier [3]. However, there the presence of MeSH term “Mice” alone was used in the first step for identifying positive articles. The paper is organized as follows. Section II presents an overview of the system along with a brief discussion of the TREC 2005 data set, the resources we used and our methodology. Section III presents and discusses the results. Finally Section IV concludes the paper. II. S YSTEM OVERVIEW AND M ETHODOLOGY A block diagram of the classifier system is shown in Figure 1. For a given document we construct a feature vector comprising the MeSH terms obtained from PubMed and look up terms identified in the document using specialized dictionaries. In the machine learning based approach SVM classification is done based on the feature vectors after filtering the documents using the MeSH term “Mice”. For the rule based approach only the filtering is done using a list of positive and negative concepts. In the combined approach both the filter and the SVM classifier come into play. These methods are described in more detail subsequently in this section. A. Data set The dataset for the 2005 task is same as that used at TREC 2004, which is a collection of articles from three journals
over two years (2002 and 2003). The articles are available in structured SGML format. The 2002 articles form the training set and the 2003 articles form the test set. The training data had a total of 5837 articles and and the test data 6043 articles. Table I shows the distribution of the positive and negative examples in the training and test sets for the four categories. As can be seen the number of positive examples is quite low for all the categories but it is especially very low in the Tumor and Expression categories. Apart from the articles we also had the PubMed ID of all the articles. We obtained the Medline records by crawling the PubMed database. Importantly for us the Medline records contained the MeSH terms assigned to the articles. B. Evaluation measure The evaluation measure used for the task was the normalized utility Unorm Uraw Unorm = Umax Uraw = (ur ∗ T P ) + (unr ∗ F P ) and Umax = ur (T P + F N ) where, ur = relative utility of relevant articles and unr = relative utility of non relevant articles and TP - true positive, TN - true negative, FP - false positive and FN - false negative. For the TREC runs it was officially given that, unr = −1 and the values for ur were officially calculated to be 17 for allele, 64 for expression, 11 for GO and 231 for tumor by using MGI’s current practice of triaging everything. The high values of ur imply that errors on positive examples are very heavily penalized. Effectively this means a high recall is very important even if the precision is low. C. Feature Generation for Machine Learning Approaches For each of the categories we identified a list of concepts that we could use as features. We used BioAnnotator [18] to look up the concepts in the articles. BioAnnotator is a tool we have developed for finding and annotating biological concepts in documents based on different dictionaries and ontologies. It is possible to load different dictionaries and ontologies into BioAnnotator for look up. In this case the concepts of interest
to us were gene ontology, gene expression and phenotypic lists from MGI [13]. Table II shows the specialized lists used for concept look up in the articles for each of the categories. For the tumor category we could not locate a tumor specific term list. Using these specialized lists allowed us to select features relevant to a category. TABLE II T ERM LISTS USED FOR L OOKUP Category GO Tumor Biology Expression Alleles
Ontologies/Term Lists used GO Gene Expression Phenotypic Data
For the machine learning approaches the features, for an article, comprised the assigned MeSH terms from Medline plus look up on the MGI dictionary concepts. We also tried other features like look up on UMLS [19] terms followed by Chi-square feature selection. For the GO category look up on UMLS results in a feature set of over 100, 000 concepts, where as, using MeSH and MGI lists results in a compact feature set of about 7000 concepts. Using MeSH and MGI based features also resulted in much better performance compared to UMLS based features. This underlines the importance of using the right features in the classification. We first used the complete article but on finding that using only the title and abstract worked just as well, we confined the look up to the title and abstract.
D. Selection of Concepts for Filtering Documents The TREC participants were provided a cheat sheet [9] developed by MGI for its curators who triage articles. This sheet contained instructions on what to look for in positive and negative articles. For example, for the GO category the cheat sheet asks the curator to always select an article that reports “protein studies (e.g. enzyme assays, binding studies)”. We used the instructions in the cheat sheet to come up with negative and positive concepts. The presence of a negative concept implied the document should not be selected and the presence of a positive concept meant that the document should be selected. For Allele, Expression and GO classes, in addition to the terms identified from the cheat sheet, all the terms present in the phenotypic, gene expression and gene ontology lists from MGI [13], respectively, and the MeSH term “Mice” were taken as positive concepts. Some examples of other positive concepts are, “fibroma” and “sarcoma” for the Tumor category. Some examples of negative concepts are, “syngeneic” and “transplanted tumors” for the Tumor category and MeSH term “synthetic genes” for GO etc. We selected the concepts that gave a high TP/FP ratio as positive concepts and those with high TN/FN ratio as negative concepts. Since FNs are heavily penalized by the very high utility factor, the selection of negative concepts was very strict.
TABLE III U TILITIES FOR M E SH TERM “M ICE ”
Test Set Train Set
Allele 0.6038 0.6639
Expression 0.6055 0.5473
GO 0.5539 0.5335
Tumor 0.4641 0.7358
E. Machine Learning Approach The cosine normalized term frequency vectors formed the input to the machine learning system. The SVM implementation we used was the SVMLight implementation [7]. The SVMLight implementation of SVM requires the user to specify a number of parameters. We used the radial basis function (rbf) kernel. We set the j parameter, which specifies the cost factor by which training errors on positive examples outweigh errors on negative examples to be equal to the relative utility for the category. For example, for the tumor category we set j=231. We set the c and g parameters for each category at the value that gave the best performance over the training data set. We also used the Weka implementation of Naive Bayes but found that SVM outperformed it by a large factor. We found that using a two stage classifier, where, in the first stage we only select articles containing the MeSH term “Mice”, gave the best performance. Thus, even for our ”pure” machine learning run we did use this filter step. F. Rule Based Approach The selection of concepts based on the ratios over the training set allowed us to come up with sets of positive and negative concepts using which we could define rules for filtering articles. The rules were simply: 1) if article contains a negative concept mark it as negative 2) else if article contains a positive concept mark it as positive 3) else mark it as negative The results for using an empty negative concept set and MeSH term “Mice” in the positive concept set are shown in Table III. By adding more carefully chosen concepts to each of these sets we improved the utilities. G. Combined Approach In this approach we combine the Rule Based approach with the machine learning approach. We used a two step classifier. In the first step articles are filtered based on the rule based approach. In the second step the positive articles, remaining after filtering, were classified using SVM. The rules were chosen to be high recall rules and the primary purpose of the SVM step was to improve the precision. TABLE IV U TILITIES OBTAINED ON T RAINING S ET
SVM Rule Combined
Allele 0.8605 0.7803 0.8338
Expression 0.6504 0.6568 0.7185
GO 0.5726 0.5470 0.5712
Tumor 0.8786 0.8725 0.8963
TABLE V R ESULTS OBTAINED ON T EST S ET FOR A LLELE AND E XPRESSION C ATEGORIES (O FFICIAL RUN ) Method SVM Rule Combined Best Median Worst
Pr. 0.2982 0.3185 0.3200 0.7957 0.3582 0.2191
Rec. 0.8946 0.8855 0.8434 0.9578 0.8946 0.2500
Allele F-score 0.4473 0.4685 0.4640 0.6667 0.5070 0.2387
Util 0.7707 0.7741 0.7380 0.8710 0.7785 0.2009
Pr. 0.0571 0.0642 0.0627 1.000 0.1228 0.0000
Rec. 0.9238 0.7238 0.7333 0.9905 0.8190 0.0000
Expression F-score 0.1075 0.1179 0.1155 0.4333 0.1994 0.0000
Util 0.6854 0.5589 0.5621 0.8711 0.6548 -0.0074
TABLE VI R ESULTS OBTAINED ON T EST S ET FOR GO AND T UMOR C ATEGORIES (O FFICIAL RUN ) Method SVM Rule Combined Best Median Worst
Pr. 0.2069 0.1883 0.2028 0.5542 0.2102 0.0706
Rec. 0.8668 0.9286 0.9015 0.9363 0.6506 0.1023
GO F-score 0.3341 0.3132 0.3311 0.4230 0.3185 0.0979
III. R ESULTS AND D ISCUSSION The results of applying our classification systems to the training set are presented in Table IV. For the SVM and combined approaches we split the training set into two equal parts for validation. The scores over the test set are given in Table V and Table VI. The precision, recall, F-Score and Utility obtained by us and the best, median and worst scores for the track are given in these tables. In the TREC 2004 categorization task many teams reported much higher utilities on the training set than over the test set. Our results over the training and test sets did not vary greatly. Over three of the four categories our utilities for the SVM run were quite close for the training and test data sets. We believe our results did not vary over the two sets because the use of specific biological knowledge about the category, in the form of category specific dictionaries and the cheat sheet instructions, was incorporated into the system resulting in the selection of better features. Further, after the release of the results we tried to change the SVM parameters to see if we could get better results. For the Allele category the SVM performance over the official run was 0.7707 and by changing of the SVM parameters the highest possible result was 0.8070 which are reasonably close. This indicates that we were able to choose the SVM parameters quite close to the best possible. One of the reasons for the difference in performance over the test and training sets is the choice of features. Cohen et. al. [2] had observed a conceptual drift in the documents over the period of one year. They observed that as the field of science changes over time, so does the language used to describe it. They observed that for the GO class the similarity between their top features in the test and training sets was very small. They reasoned that since the test and training collections were collected over non-overlapping periods of time, the features identified as strong predictors had changed
Util 0.5648 0.5648 0.5793 0.5870 0.4575 -0.342
Pr. 0.0308 0.0415 0.0945 1.0000 0.0526 0.0132
Rec. 0.8000 0.9500 0.9500 1.0000 0.9000 0.0500
Tumor F-score 0.0593 0.0795 0.1719 0.4375 0.0952 0.0260
Util 0.6909 0.8550 0.9106 0.9433 0.7610 0.0413
over time. Their features consisted of words selected using Chi-square feature selection from the set consisting of all stopped and stemmed words from different sections of the document and the MeSH terms. For their features they found that the Dice similarity coefficient was 0.2489, the Jaccard similarity coefficient was 0.1422, and the Cosine similarity was 0.2489, where for two binary vectors X and 2|X∩Y | |X∩Y | √|X∩Y | . The Y , Dice= |X|+|Y | , Jaccard= |X∪Y | and Cosine= |X|×|Y |
conceptual drift that [2] observed was not as pronounced over the features we obtained. The Dice similarity coefficients between the training and test features were, Allele: 0.8438, Expr.: 0.7070, GO: 0.8604 and Tumor: 0.3950. The Jaccard similarity coefficients were, Allele: 0.7298, Expr.: 0.5477, GO: 0.7550 and Tumor: 0.2461. The Cosine similarity coefficients were, Allele: 0.9642, Expression: 0.9461, GO: 0.9642, and Tumor: 0.8625. The Tumor category had the lowest similarity and hence also the maximum difference between the test and training sets for the SVM run. For this class the value of using the cheat sheet is clearly brought out in the results. The utility is greatly improved in the combined run as compared to the SVM run. On the other hand, the results for the Expression class show that wrong selection of concepts for the rule run can result in deterioration of utility. There is a strong case for incorporating biological knowledge into the classification system. Further improvements can result from incorporating even more biological knowledge for the selection of relevant features and for forming rules. It is also necessary to find ways of incorporating the rules directly into the machine learning process. In this paper, though, we tried to incorporate category specific knowledge, we are not biomedical experts, and some of the rules are decided by statistics rather than biological reasoning. Hence, the contribution of an expert in biological taxonomy would greatly increase the efficiency of classification as our results
tend to indicate. IV. C ONCLUSION Automatic document triage can be an useful aid to the MGI triage process. Our results show that the careful use of category specific knowledge can result in good utility. This is a strong case for incorporating more biological knowledge into the classification system. R EFERENCES [1] C. C. Chang and C. J. Lin, LIBSVM: an integrated software for support vector classification and regression, released April 2000. (http://www.csie.ntu.edu.tw/ cjlin/libsvm) [2] A. M. Cohen, R. T. Bhupatiraju, W. Hersh, “Feature generation, feature selection, classifiers, and conceptual drift for biomedical document triage,” The Thirteenth Text Retrieval Conference: TREC 2004, Gaithersburg, MD: National Institute of Standards and Technology, 2004. [3] A. Dayanik, D. Fradkin, A. Genkin, P. Kantor, D. D. Lewis, D. Madigan, V. Menkov, “DIMACS at the TREC 2004 genomics track,” The Thirteenth Text Retrieval Conference: TREC 2004, Gaithersburg, MD: National Institute of Standards and Technology, 2004. [4] M. A. Harris et. al., “The Gene Ontology (GO) database and informatics resource,” Nucleic Acids Res., 32:D258-61, 2004. [5] W. Hersh, R. T. Bhupatiraju, L. Ross, P. Johnson, A. M. Cohen, D. F. Kraemer, “TREC 2004 genomics track overview,” The Thirteenth Text Retrieval Conference: TREC 2004, Gaithersburg, MD: National Institute of Standards and Technology, 2004. [6] D. P. Hill, D. A. Begley, J. H. Finger, T. F. Hayamizu, I. J. McCright, C. M. Smith, J. S. Beal, L. E. Corbani, J. A. Blake, J. T. Eppig, J. A. Kadin, J. E. Richardson, M. Ringwald, “The Mouse Gene Expression Database (GXD): updates and enhancements,” Nucleic Acids Res., 32:D568-D571, 2004. [7] T. Joachims, Making large-Scale SVM Learning Practical, Advances in Kernel Methods - Support Vector Learning, B. Schlkopf and C. Burges and A. Smola (ed.), MIT-Press, 1999.
[8] T. Joachims, “Text categorization with support vector machines: Learning with many relevant features,” Proceedings of the 10th European Conference on Machine Learning (ECML), 137-142, Chemnitz, Germany, 1998. [9] Library Triage Cheat Sheet. http://ir.ohsu.edu/genomics/cheatsheet.pdf. [10] Medical Subject Headings (MeSH). http://www.nlm.nih.gov/mesh/meshhome.html. [11] A. McCallum, K. Nigam, “A Comparison of Event Models for Naive Bayes Text Classification,” AAAI-98 Workshop on ”Learning for Text Categorization”, 1998. [12] Mouse Genome Informatics, The Jackson Laboratory, Bar Harbor, Maine. (URL: ftp://ftp.informatics.jax.org/). [13] MGI Data and Statistical Reports from the Mouse Genome Database (MGD), Mouse Genome Informatics, The Jackson Laboratory, Bar Harbor, Maine. (URL: ftp://ftp.informatics.jax.org/pub/reports/index.html). (August, 2005). [14] D. Naf, D. M. Krupke, J. P. Sundberg, J. T. Eppig, C. J. Bult, “The Mouse Tumor Biology database: a public resource for cancer genetics and pathology of the mouse,” Cancer Res. 62(5):1235-40, 2002. [15] Y. Regev, M. Finkelstein-Landau, R. Feldman, “Rule-based extraction of experimental evidence in the biomedical domain: the KDD Cup 2002 (task 1)”, ACM SIGKDD Explorations Newsletter, v.4 n.2, p.9092, December 2002. [16] F. Sebastiani, “Machine learning in automated text categorization,” ACM Computing Surveys, 34(1), 1-47, March 2002. [17] M. Strivens, J. T. Eppig, “Visualizing the laboratory mouse: capturing phenotype information,” Genetica 122: 89-97, 2004. [18] L. V. Subramaniam, S. Mukherjea, P. Kankar, B. Srivastava, V. S. Batra, P. V. Kamesam, R. Kothari, ”Information Extraction from Biomedical Literature: Methodology, Evaluation and an Application,” Proceedings of the ACM Conference on Information and Knowledge Management (CIKM 2003), New Orleans, USA, Nov. 3-8, 2003. [19] Unified Medical Language System (UMLS). http://umlsks.nlm.nih.gov. [20] I. H. Witten, E. Frank, Data Mining: Practical machine learning tools and techniques, 2nd Edition, Morgan Kaufmann, San Francisco, 2005.